
Market Overview
| Study Period | 2020 - 2031 |
|---|---|
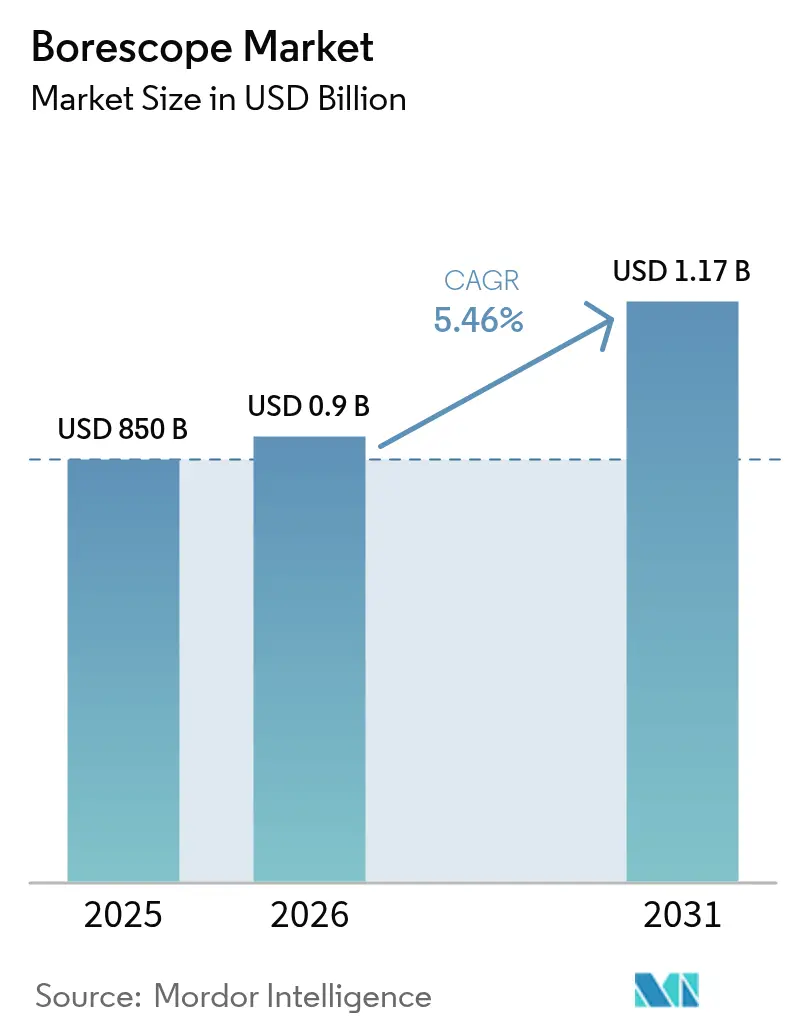
| Market Size (2026) | USD 0.9 Billion |
| Market Size (2031) | USD 1.17 Billion |
| Growth Rate (2026 - 2031) | 5.46 % |
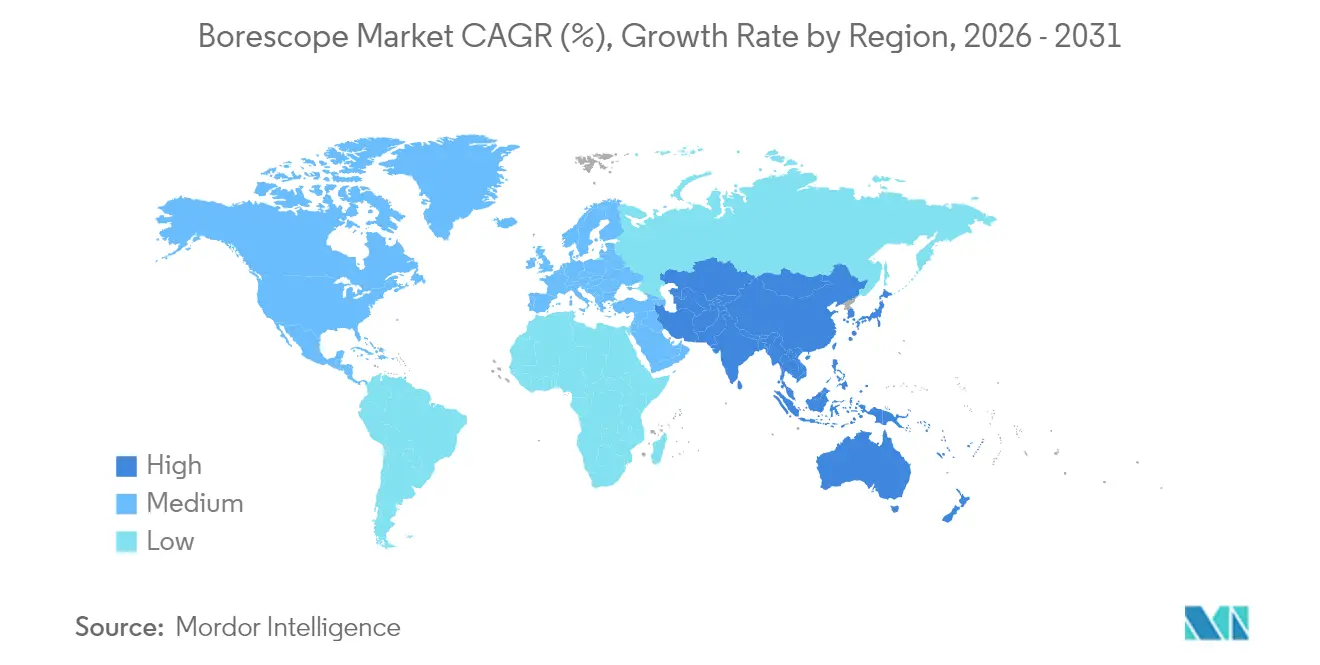
| Fastest Growing Market | Asia Pacific |
| Largest Market | North America |
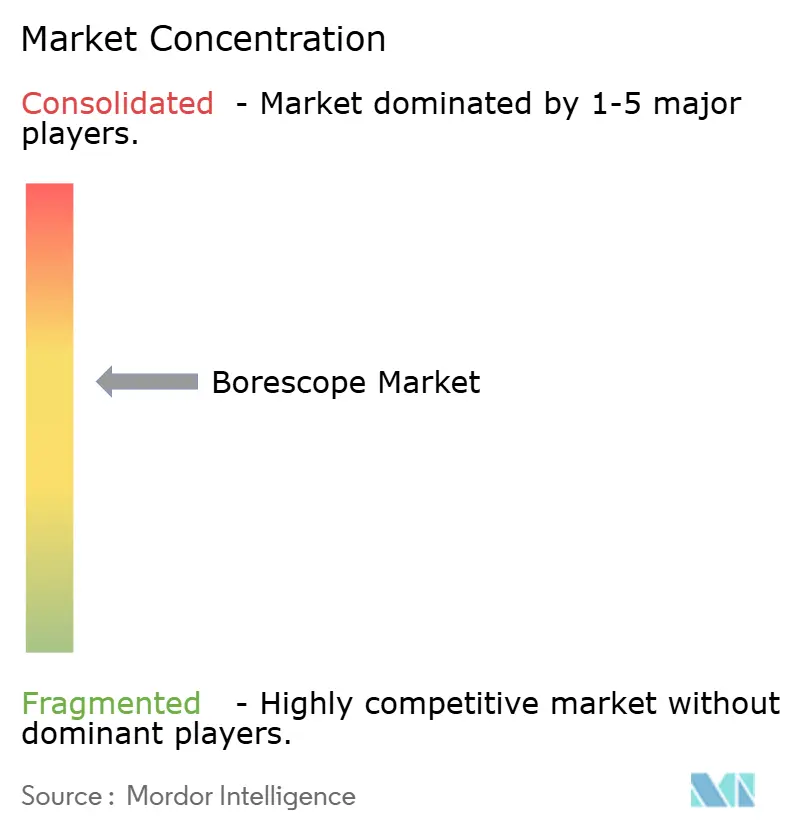
| Market Concentration | Medium |
Major Players *Disclaimer: Major Players sorted in no particular order Image © Mordor Intelligence. Reuse requires attribution under CC BY 4.0. | |
Borescope Market Analysis by Mordor Intelligence
The borescope market size was valued at USD 850 million in 2025 and estimated to grow from USD 900 million in 2026 to reach USD 1.17 billion by 2031, at a CAGR of 5.46% during the forecast period (2026-2031). Sustained demand for non-destructive inspection across aviation, energy, oil and gas, and precision manufacturing forms the backbone of this expansion. Operators view high-definition internal visualization as a practical hedge against unplanned downtime, a concern that escalates as critical infrastructure ages and safety regulations tighten. Miniaturization of CMOS sensors, wider‐angle articulation, and seamless cloud connectivity now allow inspectors to reach previously inaccessible cavities without dismantling assets, compressing maintenance cycles and lowering lifetime operating cost. In parallel, artificial-intelligence routines are migrating from pilot projects to standard features that automatically flag blade pitting, corrosion, or weld porosity, diminishing operator subjectivity and shortening training curves. Regulatory bodies on both sides of the Atlantic continue to update inspection mandates, compelling asset owners to document findings with time-stamped imagery—an administrative requirement that invariably pushes buyers toward premium video borescopes. Competitive pressure favors suppliers capable of bundling hardware with data analytics, on-site training, and outcome-based service contracts that align with operators’ shift from reactive to predictive maintenance models.
Key Report Takeaways
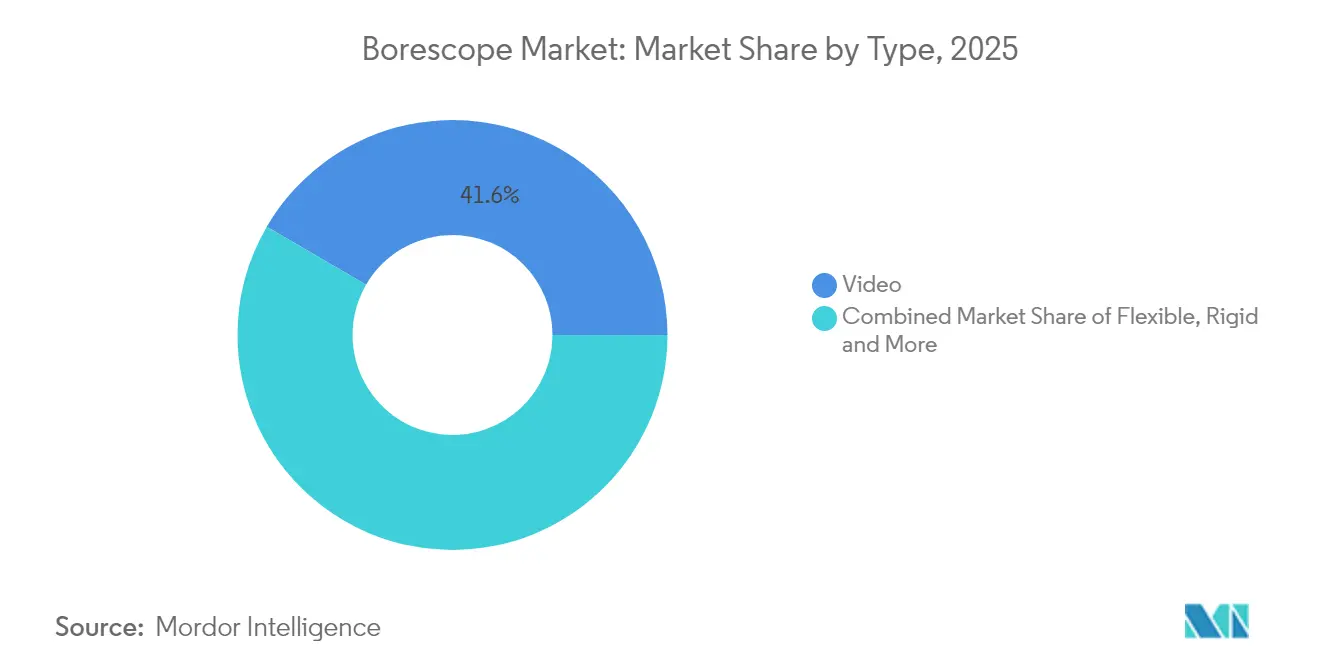
- By technology, video borescopes led with 41.60% of the borescope market share in 2025; the segment is forecast to grow at a 7.64% CAGR through 2031.
- By end-user industry, aviation accounted for 27.60% share of the borescope market size in 2025, while oil and gas is expected to expand at a 7.22% CAGR during 2026-2031.
- By diameter, the 6–10 mm category captured 34.50% of the borescope market share in 2025; the 0–3 mm range is projected to rise at a 6.19% CAGR over the same period.
- By viewing angle, 0°–90° systems held 39.70% revenue share in 2025, whereas 180°–360° devices are set to post the fastest 6.37% CAGR to 2031.
- By geography, North America dominated with 33.70% of the borescope market size in 2025; Asia-Pacific is poised for a 6.74% CAGR between 2026 and 2031.
Note: Market size and forecast figures in this report are generated using Mordor Intelligence’s proprietary estimation framework, updated with the latest available data and insights as of 2026.
Global Borescope Market Trends and Insights
Drivers Impact Analysis*
| Driver | ( ~ ) % Impact on CAGR Forecast | Geographic Relevance | Impact Timeline |
|---|---|---|---|
| Rising demand for high operational productivity | +1.20% | Global; concentration in North America & Europe | Medium term (2-4 years) |
| Accelerating adoption of video borescopes in MRO programs | +1.00% | Global; led by North America & APAC | Short term (≤ 2 years) |
| Regulatory inspection mandates in aviation & energy sectors | +0.90% | North America & Europe, expanding to APAC | Long term (≥ 4 years) |
| Preventive-maintenance push in oil & gas & power generation | +0.80% | Global; emphasis on mature markets | Medium term (2-4 years) |
| Source: Mordor Intelligence | |||
Rising Demand for High Operational Productivity
Industrial managers increasingly link downtime costs to shareholder returns; as a result, visual inspection budgets are shifting from discretionary to mandated line items. Modern gas-turbine operators report that high-definition borescope passes can detect blade deterioration a full maintenance season before routine strip-downs, allowing repairs to be scheduled during low-demand windows. Micro-diameter probes have entered quality-control cells on automotive engine lines to spot casting voids before final assembly. AI-assisted recognition shortens each inspection loop, boosting throughput in factories that once considered visual checks a bottleneck. Across these settings, the borescope market benefits from a clear value narrative: small capital outlays avert multimillion-dollar outages.
Accelerating Adoption of Video Borescopes in MRO Programs
Maintenance, repair, and overhaul providers now favor video systems that capture 4K imagery, store audit trails, and enable live remote collaboration. Aviation MRO teams cite 30-40% cycle-time savings versus legacy fiber scopes, while higher resolution delivers more confident go-no-go decisions. Military specifications reinforce the shift; USSOCOM’s 2025 tender requires waterproof, low-latency, 4K forensic cameras, a specification that cascades to civilian suppliers. [1]United States Special Operations Command, “USSOCOM Tactical Forensics Event 2025,” SAM.gov, sam.gov The net result is an upgrade wave that anchors the borescope market in digital workflows.
Regulatory Inspection Mandates in Aviation and Energy Sectors
The U.S. Pipeline and Hazardous Materials Safety Administration broadened 49 CFR 192.493 in 2024, obliging pipeline operators to deploy in-line and visual tools where conventional pigs cannot travel. [2]Pipeline and Hazardous Materials Safety Administration, “Pipeline Safety: Periodic Updates of Regulatory References to Technical Standards and Miscellaneous Amendments,” Federal Register, federalregister.gov Aviation regulators similarly require deeper documentation of turbine health following high-profile in-flight failures. Olympus responded by shipping extended-depth-of-field scopes that achieved FDA clearance in 2025, underscoring the feedback loop between policy and product. This compliance environment compels operators to replace aging optics, supporting mid-term demand for premium solutions.
Preventive-Maintenance Push in Oil & Gas & Power Generation
Following several pipeline ruptures, supermajors are formalizing condition-based maintenance programs. Petrobras partnered with Baker Hughes to develop corrosion-resistant flexible pipes and an inspection regime that aligns with a 30-year design life. Power utilities apply similar logic: regular turbine borescoping can extend component life by up to 30%, freeing cash for plant upgrades. Integrating findings with digital twins lets asset managers model degradation curves and stagger outages, reinforcing the borescope market’s role in predictive strategies.
Restraints Impact Analysis*
| Restraint | ( ~ ) % Impact on CAGR Forecast | Geographic Relevance | Impact Timeline |
|---|---|---|---|
| High upfront acquisition and training costs | −0.7% | Global; particularly emerging markets | Short term (≤ 2 years) |
| Skilled-operator shortage in emerging markets | −0.5% | APAC & Latin America, expanding to Africa | Long term (≥ 4 years) |
| Source: Mordor Intelligence | |||
High Upfront Acquisition and Training Costs
Premium video scopes equipped with AI analytics often list between USD 50,000 and USD 100,000—well above the capital budgets of small repair shops. Certification programs can add another USD 10,000-15,000 per technician. [3]InterNACHI, “Borescopes for Home Inspectors,” nachi.org These economics slow adoption in developing economies, creating a two-tier structure in which large fleet operators access advanced optics while smaller vendors continue with lower-resolution tools.
Skilled-Operator Shortage in Emerging Markets
Rapid industrialization has outpaced the supply of certified technicians across APAC and Latin America. Training content remains English-centric, and travel costs to overseas academies are prohibitive for smaller firms. The resulting talent gap limits the velocity at which new borescope installations translate into usable inspection hours, restraining full-cycle market potential.
*Our forecasts treat driver/restraint impacts as directional, not additive. The impact forecasts reflect baseline growth, mix effects, and variable interactions.
Segment Analysis
By Type: Video Dominance Drives Digital Transformation
Video systems held the largest 41.60% slice of the borescope market in 2025, a position underwritten by regulatory calls for image archiving and remote audit trails. The segment’s 7.64% forecast CAGR will push its revenue from an estimated USD 360 million in 2025 to roughly USD 560.15 million by 2031, reinforcing the borescope market size leadership of digital platforms. Flexible video models win where complex geometries demand articulation, while rigid optics remain the choice when absolute image clarity outweighs reach. Hybrid semi-rigid probes carve out niches in small-engine inspection, balancing maneuverability against cost.
Continued feature infusion shapes competitive moats. Olympus introduced the EZ1500 line with extended depth-of-field imaging, mitigating the focus drift that once plagued deep bores. Cloud APIs now funnel footage into AI object-detection services that tag pitting, fatigue, and scale without human oversight. These dynamics collectively ensure that the video category remains the borescope market’s digital vanguard and the primary gateway for downstream analytics revenues.



By Diameter: Miniaturization Enables New Applications
The 6–10 mm range—home to mainstream turbine and pipeline work—accounted for 34.50% of borescope market share in 2025. This sweet spot combines high lumen output with adequate articulation, keeping lifetime service costs in check. Meanwhile, 0–3 mm probes are registering a 6.19% CAGR as semiconductor fabs and medical-device plants pursue defect detection at micrometer scale. Gradient Lens has commercialized 0.5 mm models that thread through narrow coolant channels on micro-milling equipment. SCHÖLLY’s 0.35 mm fiberscope, comprising 3,000 individual fibers, underscores a roadmap toward sub-millimeter inspection.
Larger diameters above 10 mm remain indispensable for boiler tubes and petrochemical vessels, where lumen intensity and integrated measurement modules trump size. Across all classes, advances in CMOS sensitivity and LED lighting sustain image clarity even as external diameters shrink, ensuring the borescope market can service industries moving toward perpetual miniaturization.
By Angle: Wide-Angle Systems Enhance Inspection Coverage
Viewing angles between 0° and 90° delivered 39.70% of the 2025 turnover, reflecting their adaptability to most standard inspection routes. That said, 180°–360° articulation is climbing at a 6.37% CAGR because pressure-vessel codes and aviation manuals now stipulate near-total internal surface coverage. Baker Hughes’ Mentor Visual iQ+ brings joystick-controlled tip articulation coupled with 3D metrology, allowing inspectors to measure crack depth without repositioning the probe. As operators quantify the labor savings of single-pass surveys, demand gravitates toward full-rotation heads.
Angles in the 90°–180° band continue to serve compact engine blocks and small-bore piping, although the gap between mid-range and full-rotation pricing narrows each product cycle. Overall, broader articulation expands the borescope market’s addressable envelope by trimming access tooling, scaffolding, and inspection time.

By End-user Industry: Aviation Leads While Oil and Gas Accelerates
Aviation retained a commanding 27.60% share in 2025 and remains the most compliance-sensitive vertical. Aircraft engines are multi-million-dollar assets governed by airworthiness directives that explicitly reference borescope findings, embedding visual inspection deep within MRO budgets. The sector prefers high-resolution video units with cloud archives that can be revisited after teardown. Simultaneously, oil and gas is tracking a 7.22% CAGR as pipeline operators migrate from five-year hydrostatic tests to annual visual passes integrated with digital twins. Petrobras’ multiyear contracts with Baker Hughes illustrate how inspection deliverables bundle with broader integrity-management services.Power generation ranks close behind, leveraging turbine inspections to synchronize outages with capacity-planning windows. On the automotive front, video flex scopes enter battery-pack QA lines to examine cell-bond welds, while defense agencies procure ruggedized scopes for field forensics. This diverse application spread insulates the borescope market from single-sector volatility.
Geography Analysis
North America maintained 33.70% of borescope market revenue in 2025, anchored by the United States’ extensive pipeline grid and the Federal Aviation Administration’s stringent engine-inspection directives. PHMSA’s 2024 rulemaking added more than 20 technical standards, compelling pipeline operators to collect detailed visual evidence of compliance. Early uptake of AI-enabled analytics further embeds premium scopes in operator budgets, and a mature service ecosystem sustains high aftermarket revenues.Asia-Pacific is advancing at a 6.74% CAGR, converting factory expansions and infrastructure build-outs into sustained equipment demand. Chinese OEMs such as QBH Technology leverage scale economics to offer competitively priced scopes across more than 60 export destinations. Japan and South Korea, driven by shipbuilding and semiconductor investments, purchase high-end optics that stand up to clean-room protocols. India’s push for industrial safety audits in power and chemical plants opens green-field opportunities where service capacity is still nascent, positioning the region as the fastest-moving component of the global borescope market.
Europe shows consistent mid-single-digit growth as aging industrial assets, offshore wind farms, and nuclear facilities adopt predictive inspection regimes. Germany’s Industrie 4.0 rollout embeds scopes within automated quality gateways, while the United Kingdom’s mature North Sea assets rely on high-angle probes that operate in confined, high-pressure environments. EU environmental directives reinforce condition-monitoring investments, keeping replacement cycles steady and supporting stable contribution to overall borescope market size.

Regulatory Landscape
Regulation and standards around remote visual inspection are tightening around traceable digital evidence, calibration, and operator qualification, which favors higher-end video borescopes. In 2024, ASTM updated A1015 to incorporate calibration requirements and to support digital recording and remote evaluation for sanitary tubular inspection workflows. In 2025, ASME released the BPVC Section V edition covering nondestructive examination requirements and personnel qualification expectations that influence how borescope procedures are written and audited in pressure equipment environments.
In 2026, aviation and inspection oversight continued to add specificity to borescope usage and documentation. The FAA formalized expectations for remote inspection plans to be captured in certification documentation (PSCP/CIP), and on April 14, 2026 it proposed a directive in the Federal Register establishing mandatory repetitive borescope inspection intervals for certain helicopter components. Standards development also progressed with ISO registering the committee draft for ISO/CD 22527-1 (visual testing with industrial endoscope) in April 2026, while the Energy Institute published EI 3623:2026 to codify good practice for borescope-based RVI in high-hazard sectors.
Value Chain Analysis
The borescope value chain starts with component supply and design, including optical assemblies, LEDs/illumination modules, probe sheathing and articulation mechanisms, and CMOS sensor integration, followed by device manufacturing and software enablement for imaging, measurement, and archiving. Manufacturers differentiate through in-house R&D, mechanical fabrication, optical module production, and embedded software stacks that support high-definition capture and inspection record-keeping; market access is shaped by quality and conformity requirements such as ISO 9001:2015 and product compliance marks including CE, FCC, RoHS, and UKCA.
Downstream, distribution is handled via direct sales to large asset owners and MROs, as well as regional distributors and private-label/OEM programs that broaden channel reach without duplicating R&D. Service providers and end users (aviation, oil and gas, power generation, automotive, and increasingly telecommunications infrastructure inspections) convert device output into maintenance actions, with growing emphasis on workflow integration, training, and digital evidence management. Bottlenecks commonly sit in operator availability and process standardization, making bundled training, procedure development, and data-management tools an important part of the delivered solution.
Competitive Landscape
The borescope market remains moderately fragmented but is consolidating as incumbents seek scale in digital analytics. Wabtec’s USD 1.78 billion purchase of Evident’s Inspection Technologies unit in 2025 doubled its addressable market and integrated optical hardware into its rail-centric Digital Intelligence platform. Baker Hughes extends a systems-of-systems strategy: turbine OEM expertise blends with inspection know-how, letting the firm command turnkey integrity programs from hardware through data-science dashboards. Olympus leverages medical imaging R&D to roll out industrial scopes with extended depth of field, a cross-vertical play that defends high-margin product tiers.
Emerging challengers differentiate through ultra-thin diameters, AI-native software stacks, or SaaS business models that convert capex into subscription opex. Patent filings target conformable transducers capable of self-position sensing—technology that improves tip-location accuracy inside convoluted vessels. Strategic partnerships are multiplying as optics firms ally with cloud providers to speed compute-heavy defect classification. Regional service integrators also enter co-branding deals to secure distribution in skill-scarce markets, underscoring the shift from standalone devices toward holistic outcome contracts that bundle training, analytics, and lifecycle support.
Borescope Industry Leaders
Olympus Corporation
AB SKF
Baker Hughes Company
FLIR Systems
Fluke Corporation
- *Disclaimer: Major Players sorted in no particular order

Market Opportunities and Future Outlook
A major whitespace area is conforming borescope workflows to stronger digital-evidence controls demanded by inspection bodies and asset owners. ISO/IEC 17020:2026, published on March 27, 2026, introduces standalone requirements for digital data control, software validation, and data integrity assurance, pushing inspection organizations to formalize how borescope imagery is captured, stored, and audited. This creates room for suppliers that can deliver validated software toolchains, role-based access controls, and tamper-evident audit trails as part of the borescope offering rather than as an IT add-on.
Another opportunity is the shift from operator-dependent inspection to AI-supported and automated routines that compress inspection cycles and increase repeatability. Panasonic’s March 2026 launch of licensing for its AI Platform for Visual Inspection signals a broader industrial push to operationalize visual AI across robots and industrial PCs, aligning with borescope vendors that expose open interfaces for analytics and fleet management. In aviation MRO, RTXs Pratt and Whitney acquired Aiir Innovations in July 2026 to integrate AI-assisted borescope analytics into engine inspection operations, reinforcing demand for borescope systems that produce analytics-ready data and integrate into digital maintenance records.
Recent Industry Developments
- May 2026: Baker Hughes, through Waygate Technologies, launched the next-generation Everest Mentor Flex+ video borescope with interchangeable QuickChange probes for industrial inspection workflows. The modular probe concept reduces tool-change downtime and supports multi-asset inspection programs across aerospace and energy environments. The launch raises competitive pressure around platform-based hardware plus software workflows rather than single-purpose scopes.
- March 2026: SKF signed an agreement to acquire G-Tech Instruments Inc. to strengthen its condition monitoring and measuring instrument technology portfolio. The move broadens SKF reliability offerings that often sit alongside visual inspection programs in predictive maintenance. For borescope suppliers, it highlights customer preference for integrated reliability ecosystems that connect inspection findings to maintenance decisions.
- February 2026: Baker Hughes launched the Waygate Technologies Mentor Zoom, a pan-tilt-zoom camera system aimed at remote visual inspection in confined industrial spaces such as pressure vessels, pipes, and nuclear facilities. By expanding RVI beyond probe-based borescopes into fixed/remote camera deployments, the product supports faster surveys and reduces the need for confined space entry. This widens the competitive set for borescope vendors toward broader RVI platforms and services.


Research Methodology Framework and Report Scope
Market Definition and Coverage
For this study, the market covers revenues from borescopes used for non-medical remote visual inspection, including optical and video systems sold as new equipment for industrial and technical checks.
Scope exclusions: We exclude medical and veterinary endoscopy devices and services, along with rentals and most aftermarket repair revenue.
Segmentation Overview
- By Type
- Video
- Flexible
- Rigid
- Semi-rigid
- Endoscopes
- By Diameter
- 0–3 mm
- 3-6 mm
- 6-10 mm
- Above 10 mm
- By Angle
- 0°–90°
- 90°–180°
- 180°–360°
- By End-user Industry
- Automotive
- Aviation
- Power Generation
- Oil and Gas
- Manufacturing
- Chemicals
- Food and Beverages
- Pharmaceuticals
- Mining and Construction
- Defense and Security
- By Geography
- North America
- United States
- Canada
- Mexico
- South America
- Brazil
- Argentina
- Rest of South America
- Europe
- Germany
- United Kingdom
- France
- Italy
- Spain
- Russia
- Rest of Europe
- Asia-Pacific
- China
- Japan
- India
- South Korea
- Australia and New Zealand
- ASEAN
- Rest of APAC
- Middle East and Africa
- Middle East
- GCC
- Turkey
- Rest of Middle East
- Africa
- South Africa
- Nigeria
- Rest of Africa
- Middle East
- North America
Data Sources, Market Sizing, and Validation
Desk Research
Desk work starts with building a clear demand map for where borescopes are typically used, followed by a review of how inspection standards shape buying cycles. Public sources help us anchor the base context, such as FAA maintenance guidance, NIST references for imaging and measurement, and industry documents from groups such as ASTM International and ISO.
To keep the model grounded, we also review broad manufacturing and trade signals through sources such as the US Census Bureau, Eurostat, and UN Comtrade, along with patents and technical publications that show technology shifts like CMOS miniaturization and articulation improvements. Company filings, investor presentations, and credible press releases are used to confirm product positioning and regional exposure, and a paid subscription for company financials and patent databases is used selectively to fill missing detail. These are illustrative sources, and many other public references were also used for data collection, cross-checking, and clarification.
Primary Interviews and Surveys
Primary inputs were gathered through expert interviews and surveys with manufacturers, distributors, inspection service managers, and end users across aviation MRO, automotive, energy, and process industries. We use these discussions to confirm what is counted as a borescope sale, validate typical replacement cycles and price ranges, and then pressure-test adoption assumptions across regions before totals are finalized.
Distribution of primary research fieldwork respondents
| Company type | Respondent position | Region |
|---|---|---|
| Top tier: 37% | CXOs: 20% | APAC: 44% |
| Mid tier: 43% | Functional/Unit leaders: 32% | EMEA: 32% |
| Smaller Players: 20% | Managers: 48% | Americas: 24% |
Market-Sizing & Forecasting
Sizing is built using a top-down structure where maintenance intensity and installed base signals are used to reconstruct demand pools by end-use industries and regions, and then translated into revenue using typical price bands. The result is subsequently checked with selective bottom-up approximations, such as sampled ASP x unit volumes by product class and channel discussions, which helps adjust for gaps where public shipment detail is limited.
A few inputs that matter in this market include aircraft and turbine maintenance schedules that drive inspection frequency, the share shift from fiber to video systems, typical probe diameters and articulation needs that influence price, and replacement cycles that differ between heavy-use MRO and light industrial inspection. We also track adoption of time-stamped imaging and documentation requirements, since this can move buyers toward higher-value systems. For forecasting, scenario analysis is used, where baseline growth is shaped by expert views on MRO activity, industrial output, and pricing progression, and then we test conservative and aggressive cases for technology uptake and refresh cycles.
Data Validation & Update Cycle
Outputs are cross-verified against independent signals, including regional maintenance activity, published production indicators, and observed pricing bands, and then the numbers are reviewed for unusual jumps across years and regions. When a variance looks hard to explain, we re-check assumptions, revisit the source trail, and re-contact relevant respondents to confirm whether the change is real or model-driven.
A multi-step internal review is completed before sign-off, covering scope, arithmetic checks, and logic checks across regions and end uses. Reports are refreshed annually, with interim updates triggered by material events such as sharp changes in aircraft utilization, large regulatory shifts, or visible pricing moves. Before delivery, an analyst runs a fresh pass so clients receive the latest updated view.
Mordor Intelligence's Borescope Market Size Versus Other Published Estimates
Published market values for borescopes often vary because the counted products and the year being referenced are not always the same, and then the price and volume assumptions drift apart. Differences also show up when one estimate leans on older price points or mixes industrial inspection tools with adjacent categories.
The benchmark table shows a tight cluster around mid-single digit growth, but the spread comes from what is treated as a saleable unit and how refresh cycles are applied. Some sources blend in refurbished equipment, rentals, or wider remote-visual tools, while the year used for currency conversion and inflation can also move the USD value by a noticeable margin.
Benchmark comparison
| Source | Market Size | Gaps in Research Methodology |
|---|---|---|
| Mordor Intelligence | USD 0.85 B (2025) | |
| Global Consultancy A | USD 0.82 B (2024) | Uses an earlier base year and blends some refurbished units into revenue, which can pull the value down while still showing similar demand momentum. |
| Trade Journal B | USD 0.90 B (2025) | Leans more heavily on list-price style ASPs for video systems and applies a faster upgrade curve, which tends to lift the market value versus a replacement-cycle based view. |
The table points to scope and pricing as the practical causes of difference, and in Mordor Intelligence's model only newly manufactured optical or video borescopes for non-medical inspection are included, which keeps the total tied to repeatable demand drivers. With the same steps applied across regions and validated through interviews, the final number stays traceable to clear usage signals and reasonable price bands.


Key Questions Answered in the Report
What is the current size of the borescope market?
The borescope market size stands at USD 900 million in 2026 and is on track to reach USD 1.17 billion by 2031.
Which technology segment leads the borescope market?
Video borescopes hold the leading 41.60% share thanks to high-resolution imaging and mandatory documentation requirements.
Which end-user vertical is expanding fastest?
The oil and gas sector is forecast to grow at a 7.22% CAGR between 2026 and 2031 as operators migrate toward predictive maintenance.
Why is Asia-Pacific the fastest-growing regional market?
Rapid industrialization, expanding manufacturing capacity, and stronger safety regulations push Asia-Pacific borescope market demand at a 6.74% CAGR.
What factors restrain wider adoption of advanced borescopes?
High acquisition costs and scarcity of certified operators in emerging markets slow uptake of premium video systems.
How are artificial-intelligence features shaping competitive strategy?
Vendors embed AI for automated defect detection, enabling service-based revenue models while reducing training time, a key differentiator in the evolving borescope market.
Page last updated on:


 Your data is secure and never sold or shared.


