Load Balancer Market Size and Share
Market Overview
| Study Period | 2019 - 2030 |
|---|---|
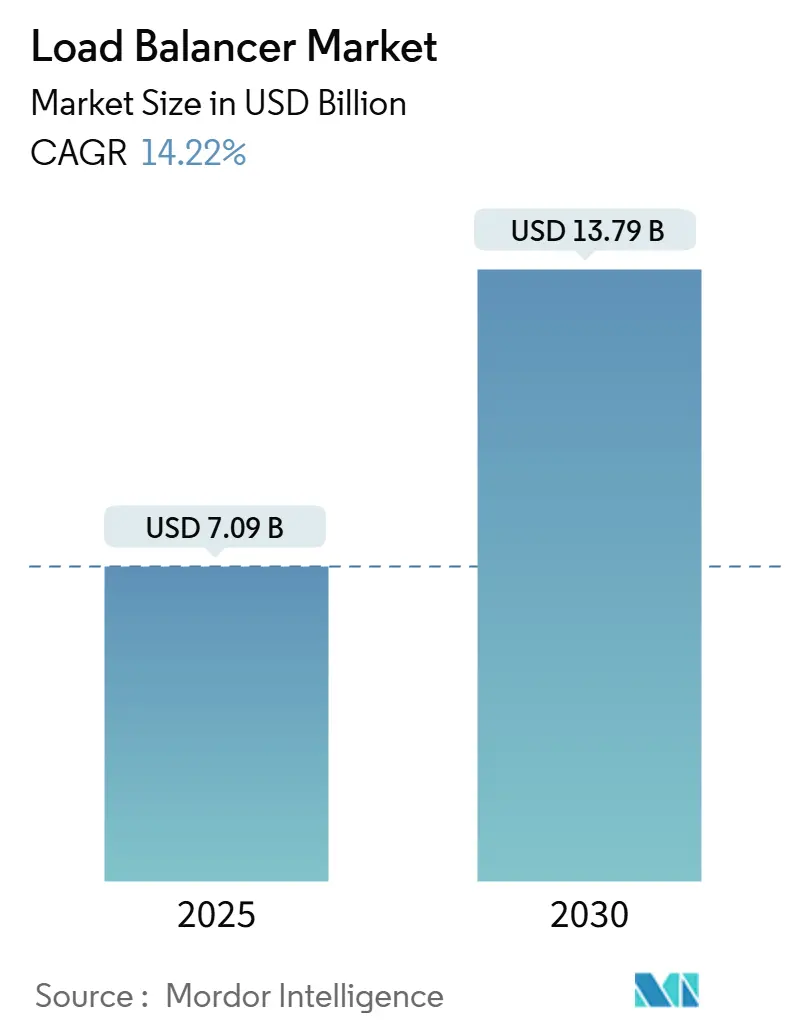
| Market Size (2025) | USD 7.09 Billion |
| Market Size (2030) | USD 13.79 Billion |
| Growth Rate (2025 - 2030) | 14.22% CAGR |
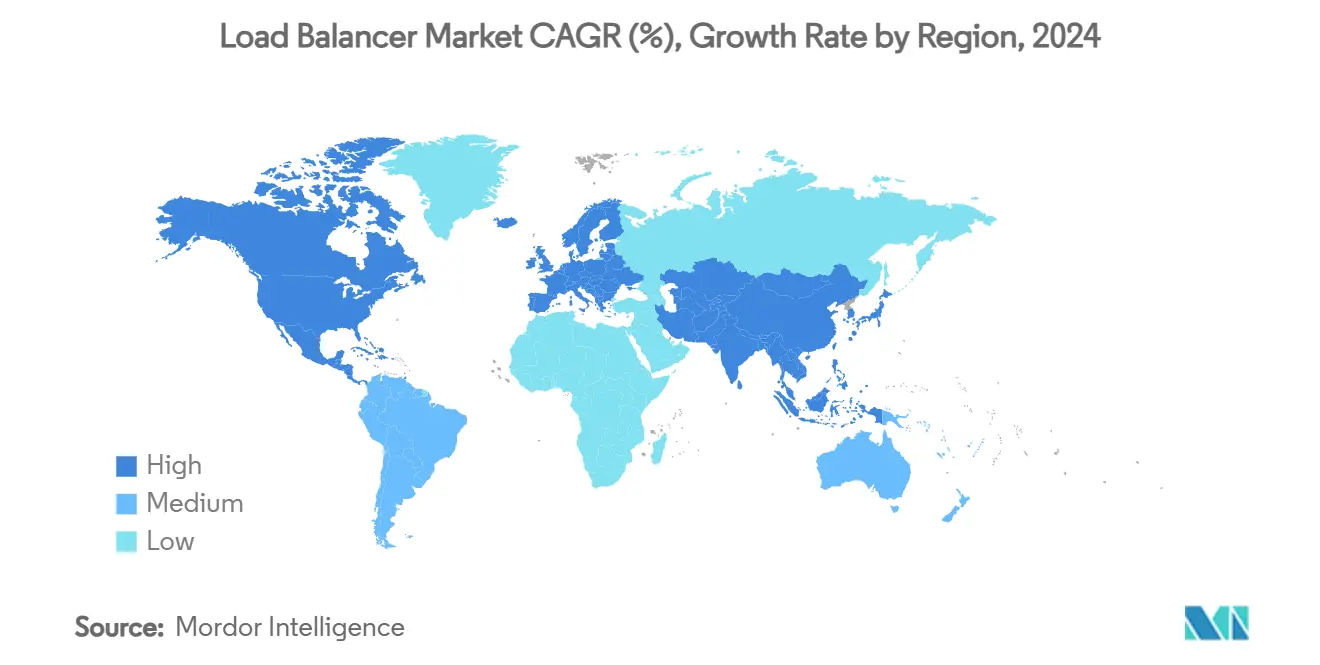
| Fastest Growing Market | Asia Pacific |
| Largest Market | North America |
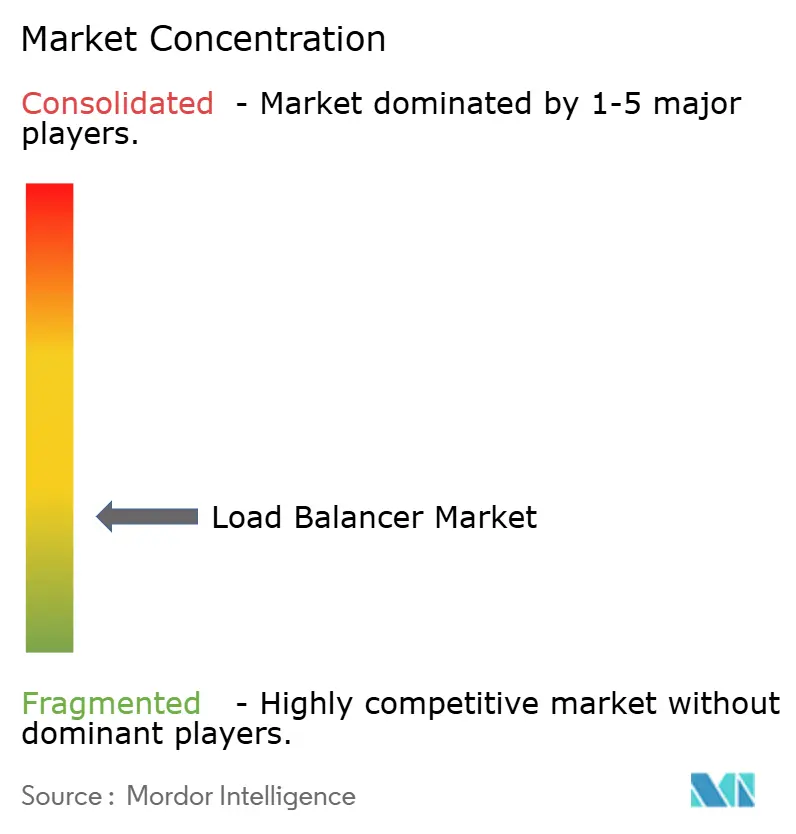
| Market Concentration | Low |
Major Players *Disclaimer: Major Players sorted in no particular order Image © Mordor Intelligence. Reuse requires attribution under CC BY 4.0. | |
Load Balancer Market Analysis by Mordor Intelligence
The load balancer market reached USD 7.09 billion in 2025 and is forecast to reach USD 13.79 billion by 2030, advancing at a 14.22% CAGR over 2025-2030. Strong demand for application-aware traffic management across hybrid multicloud, AI, and edge environments anchors this momentum. Enterprises continue to phase out fixed hardware in favor of software-defined and cloud-resident options that support rapid workload shifts and zero-touch scalability. The pivot toward consumption-based pricing accelerates vendor competition, while rising cyber threats push suppliers to blend security and traffic optimization in one platform. Consolidation among infrastructure, security, and automation providers further reshapes value propositions as customers seek one-stop application delivery ecosystems.
Key Report Takeaways
- By component, software/virtual appliances commanded 60.3% of the load balancer market share in 2024. Load Balancer-as-a-Service is projected to expand at a 15.5% CAGR through 2030.
- By deployment mode, on-premises retained 55.4% share of the load balancer market size in 2024 while cloud-native solutions are set to grow at a 15.1% CAGR to 2030.
- By load balancer type, Layer 7 solutions held 49.8% of the load balancer market share in 2024 whereas Kubernetes ingress is forecast to post a 14.8% CAGR over the same horizon.
- By end-user industry, IT and telecom accounted for 29.7% share of the load balancer market size in 2024; healthcare and life sciences is on track for a 15.7% CAGR through 2030.
- By geography, North America accounted for 38.2% share of the load balancer market size in 2024; APAC is on track for a 14.90% CAGR through 2030.
Global Load Balancer Market Trends and Insights
Drivers Impact Analysis*
| Driver | (~) % Impact on CAGR Forecast | Geographic Relevance | Impact Timeline |
|---|---|---|---|
| Surge in hybrid/multi-cloud architectures | +3.2% | Global, early gains in North America and EU | Medium term (2-4 years) |
| Kubernetes-native ingress demand | +2.8% | Global, spill-over from North America to APAC | Short term (≤ 2 years) |
| Terabit-scale AI/ML workload traffic | +2.5% | North America and APAC core, expanding to EMEA | Long term (≥ 4 years) |
| Data-sovereignty driven geo-aware GSLB | +1.9% | APAC and EU, regulation led | Medium term (2-4 years) |
| Rising DDoS threat and WAF convergence | +1.8% | Global enterprise focus | Short term (≤ 2 years) |
| Edge-computing distributed load balancing | +1.6% | Global, tied to 5G rollout | Long term (≥ 4 years) |
| Source: Mordor Intelligence | |||
Surge in hybrid/multi-cloud architectures
Nearly 90% of enterprises deploy applications across at least two public clouds and one private environment, forcing traffic to span distinct security policies and latency zones. Vendors that unify policy enforcement across AWS, Azure, Google Cloud, and private estates lower operational overhead and raise platform stickiness. Demand leans toward software-defined control planes that decouple data processing from the control layer, simplifying rollouts without forklift upgrades. Strategic partnerships between load balancing suppliers and hyperscalers accelerate feature parity so that customers can move workloads without re-architecting. This shift positions the load balancer market as a core enabler of broader multicloud networking strategies.
Kubernetes-native ingress demand
Containerized microservices add and remove endpoints in seconds, overwhelming legacy appliances that rely on static pools. Vendors integrating Envoy-based proxies with declarative APIs shorten release cycles and keep latency below 5 ms at 1,000 requests/s. Enterprises prioritizing platform engineering teams adopt GitOps pipelines that publish ingress policies as code, turning load balancing into a programmable service layer. The gateway-API evolution brings native Layer 4 and Layer 7 routing across clusters, reducing the need for separate TCP gateways. Consequently, Kubernetes ingress is the fastest-growing slice of the load balancer market.
Terabit-scale AI/ML workload traffic
GPU clusters moving model checkpoints create “elephant flows” that dwarf conventional web payloads. Dynamic Load Balancing (DLB) techniques redistribute RDMA traffic to keep fabric utilization near 90% without congestion. Research on locality-aware balancers such as SkyLB achieved up to 2.06 × throughput gains and 25% cost savings for cross-region inference. Vendors layering AI-specific algorithms onto existing platforms open premium service tiers while defending margins as basic HTTP routing commoditizes.
Data-sovereignty driven geo-aware GSLB
GDPR, CCPA, and similar statutes force enterprises to keep resident data within jurisdiction. Modern GSLB engines attach policy labels to traffic and route sessions to compliant regions in real time.[1]Scale Computing, “Data Sovereignty, Data Residency, and Data Localization: An Introduction,” scalecomputing.com. IP masking and edge encryption embedded in load balancers help privacy officers satisfy audits without extra appliances.[2]Ambassador Labs, “Benchmarking Envoy Proxy, HAProxy, and NGINX Performance on Kubernetes,” getambassador.io. This regulatory tailwind strengthens regional load balancer deployments, especially across APAC where new localization rules appear each quarter.
Restraints Impact Analysis*
| Restraint | (~) % Impact on CAGR Forecast | Geographic Relevance | Impact Timeline |
|---|---|---|---|
| Open-source load balancer cannibalization | -2.1% | Global, higher in cost-sensitive markets | Medium term (2-4 years) |
| Advanced-policy skills gap | -1.8% | Global, acute in emerging economies | Long term (≥ 4 years) |
| Cloud-LBaaS latency penalties | -1.5% | Global enterprise focus | Short term (≤ 2 years) |
| Service-mesh traffic offloading | -1.3% | North America and EU early adopters | Medium term (2-4 years) |
| Source: Mordor Intelligence | |||
Open-source load balancer cannibalization
Free options such as HAProxy, NGINX, and LoxiLB now deliver 533 Gbps on commodity ARM instances.[3]LoxiLB, “Comparing LoxiLB with ipvs and HAProxy on AWS Graviton2-based EC2 instance,” loxilb.io. Cost-focused buyers weigh the marginal benefit of paid licenses against community support and DIY scripting. Cloud providers integrate open-source engines behind proprietary consoles, turning basic balancing into a utility. Commercial vendors respond with subscription bundles that layer analytics, AIOps, and unified security, but price sensitivity still trims the attainable load balancer market size.
Advanced-policy skills gap
Policy-rich traffic steering, app-aware routing, automated certificate rotation, or geo-compliance, demands specialized engineering. Emerging markets face shortages of platform engineers, lengthening deployment cycles and dampening uptake. Suppliers invest in no-code policy designers and managed service wrappers to close the gap, yet the headcount deficit remains a drag on CAGR.
*Our forecasts treat driver/restraint impacts as directional, not additive. The impact forecasts reflect baseline growth, mix effects, and variable interactions.
Segment Analysis
By Component: Software Dominance amid Service Transformation
Software/virtual appliances captured 60.3% of the load balancer market share in 2024 as CIOs targeted opex-friendly scaling and avoided hardware refresh cycles. Vendors provide image files for cloud marketplaces and container registries, letting DevOps teams spin up new instances in minutes. Over 2025-2030, the segment is expected to compound steadily, reinforced by AI-driven autoscaling modules that right-size capacity every 15 seconds.
Load Balancer-as-a-Service, though only a modest contributor in absolute revenue today, is the quickest mover at 15.5% CAGR. Its pay-as-you-grow model aligns with variable API traffic and seasonal retail bursts. Providers bundle WAF, bot mitigation, and DDoS scrubbing natively, making LBaaS a gateway to upsell security add-ons. Conversely, hardware appliances maintain footholds in ultra-low-latency trading floors and telco core networks, yet their share will erode as PCIe-attached smart-NICs bring hardware offload to software form factors.


By Deployment Mode: Cloud-Native Acceleration Challenges On-Premises Legacy
On-premises deployments still represent the largest slice of the load balancer market size because regulated sectors must house sensitive PII and meet deterministic latency thresholds. Many banks and governments amortize chassis over seven-year cycles, delaying replacement. Even so, cloud-native instances will outrun every other mode, riding a 15.1% CAGR on the back of container orchestration and managed Kubernetes growth.
Hybrid/multi-cloud patterns remain the strategic middle path. Enterprises blend sovereign private clouds with public endpoints for DR and edge POPs. Successful vendors ship portable configurations that migrate from data center to cloud without rewriting policies. Managed service providers also lean on hybrid patterns to deliver SLA-driven performance while meeting data residency mandates.
By Load Balancer Type: Layer 7 Leadership Faces Kubernetes Disruption
Layer 7 HTTP/TLS balancers underpin e-commerce, media streaming, and API monetization, preserving 49.8% share in 2024. Their capabilities, host-header routing, SSL termination, content rewriting, remain essential as TLS 1.3 adoption expands. However, Kubernetes ingress and service mesh will add the most incremental dollars, mirroring container adoption curves. Benchmarks show Envoy-based gateways sustaining sub-5 ms p95 latency even under bursty traffic, easing real-time video and gaming workloads into microservices stacks.
Global server load balancing fills geographic failover gaps for SaaS providers rolling out sovereign cloud regions. Layer 4 TCP/UDP balancing continues in high-throughput environments such as financial exchanges that prize deterministic latency over application-aware routing. DNS-based solutions stay relevant for cost-sensitive SMEs needing simple round-robin distribution without extra appliances.

By End-User Industry: Healthcare Acceleration amid IT Sector Maturity
IT and telecom accounted for 29.7% of 2024 revenue, reflecting a long-standing investment in carrier-grade NAT and CDN-adjacent technologies. Growth moderates as basic traffic steering is commoditized, although 5G network slicing and private 5G campuses inject new demand.
Healthcare and life sciences lead the way in velocity with a 15.7% CAGR forecast. Telehealth consults, PACS image archiving, and HL7/FHIR APIs generate bursty loads that require HIPAA-level encryption, driving demand for programmable, audit-ready balancers. Cloud-hosted EMR rollouts further stimulate LBaaS adoption as hospital groups offload infrastructure chores. BFSI sustains premium ASPs given flash-crash sensitivity; retail and e-commerce pursue elastic scaling during holiday peaks; governments digitize citizen portals under cloud-first mandates, rounding out widespread sector demand.
Geography Analysis
North America accounted for 38.2% of global revenue in 2024, supported by hyperscale cloud availability zones and enterprise cloud budgets exceeding USD 300 billion annually. US-based SaaS exporters adopt sophisticated GSLB to satisfy FedRAMP and regional privacy controls, cementing demand for advanced traffic steering. Canada's public sector cloud strategy likewise boosts homeland data residency projects.
The Asia-Pacific region is poised for the fastest growth, with a 14.9% CAGR through 2030. Data center power under construction surpassed 14,300 MW in 2024, reflecting the expansion of hyperscalers in India, Indonesia, and Malaysia. China encourages indigenous appliance vendors, while Japan and South Korea converge 5G edge nodes with micro-data centers. These trends inject new revenue as local firms upgrade from basic L4 NAT to full application delivery controllers.
Europe is experiencing steady gains, largely driven by the GDPR and emerging digital sovereignty acts. Enterprises prioritize in-region traffic termination and encrypted session persistence across Frankfurt, Paris, and Madrid hubs. Meanwhile, the Middle East and Africa are gradually close infrastructure gaps with sovereign cloud programs in KSA and UAE, though political and fiber-connectivity constraints temper faster uptake. Latin America remains nascent but Brazil's Open Banking regulations and Mexico's fintech wave spark early deals for managed balancers that integrate WAF and identity.

Competitive Landscape
The load balancer market shows moderate consolidation. Major vendors include F5, HPE-Juniper, Citrix-Cloud Software Group, A10 Networks, and AWS ELB, leaving material space for niche players. F5 reported Q2 2025 revenue of USD 731 million, with 27% systems growth following the addition of hundreds of former Citrix customers. Its strategy revolves around bundling API security and AI-driven telemetry into a single SKU.
HPE's USD 14 billion acquisition of Juniper Networks doubled its networking footprint and fused intent-based routing with AI-native operations. The move positions HPE to cross-sell balancers in GreenLake deals and edge-to-cloud bundles. IBM's USD 6.4 billion HashiCorp deal brings Terraform-driven automation to Big Blue's hybrid cloud stack, letting customers treat load balancer policies as code and reducing vendor sprawl.[4]CNBC, “IBM to Acquire HashiCorp in USD 6.4 Billion Deal,” cnbc.com.
Open-source vendors such as NGINX and HAProxy remain formidable on performance and cost, while eBPF start-ups experiment with kernel-native flows that bypass user space, cutting latency 40%. Cloud providers bundle managed services; AWS supports over 300 million new ELB flows per second, squeezing standalone suppliers on price. To stay relevant, incumbents push differentiators like AI traffic modeling, zero-trust integration, and sovereign cloud compliance packs.
Load Balancer Industry Leaders
F5, Inc.
Citrix Systems, Inc.
A10 Networks, Inc.
Radware Ltd.
HAProxy Technologies, LLC
- *Disclaimer: Major Players sorted in no particular order

Recent Industry Developments
- July 2025: Hewlett Packard Enterprise closed its USD 14 billion take-over of Juniper Networks to pair AI-native routing with cloud-based management, aiming to upsell integrated networking and security across GreenLake subscriptions
- April 2025: IBM announced a USD 6.4 billion cash acquisition of HashiCorp to fold infrastructure-as-code into its hybrid cloud portfolio, streamlining multicloud load balancer provisioning
- February 2025: F5 launched a converged Application Delivery and Security Platform combining high-performance load balancing with API and application security to tackle AI data-flow risks
- February 2025: DoiT International bought PerfectScale to automate Kubernetes resource optimization, expanding managed services tied to performance and cost efficiency
- December 2024: Fortinet released FortiAppSec Cloud, integrating WAF and global server load balancing for low-touch multi-cloud resilience


Global Load Balancer Market Report Scope
| Hardware Appliance |
| Software / Virtual Appliance |
| Load Balancer-as-a-Service (LBaaS) |
| On-Premises |
| Cloud-Native |
| Hybrid / Multi-Cloud |
| Layer 4 (TCP/UDP) |
| Layer 7 (HTTP/TLS/Content) |
| Global Server LB (GSLB) |
| DNS Load Balancing |
| Kubernetes Ingress / Service Mesh |
| IT and Telecom |
| BFSI |
| Healthcare and Life Sciences |
| Retail and E-commerce |
| Government and Public Sector |
| Other End-user Industries |
| North America | United States | |
| Canada | ||
| Mexico | ||
| South America | Brazil | |
| Argentina | ||
| Rest of South America | ||
| Europe | Germany | |
| United Kingdom | ||
| France | ||
| Italy | ||
| Spain | ||
| Rest of Europe | ||
| Asia Pacific | China | |
| Japan | ||
| India | ||
| South Korea | ||
| ASEAN | ||
| Rest of Asia Pacific | ||
| Middle East and Africa | Middle East | Saudi Arabia |
| United Arab Emirates | ||
| Turkey | ||
| Rest of Middle East | ||
| Africa | South Africa | |
| Nigeria | ||
| Rest of Africa | ||
| By Component | Hardware Appliance | ||
| Software / Virtual Appliance | |||
| Load Balancer-as-a-Service (LBaaS) | |||
| By Deployment Mode | On-Premises | ||
| Cloud-Native | |||
| Hybrid / Multi-Cloud | |||
| By Load Balancer Type | Layer 4 (TCP/UDP) | ||
| Layer 7 (HTTP/TLS/Content) | |||
| Global Server LB (GSLB) | |||
| DNS Load Balancing | |||
| Kubernetes Ingress / Service Mesh | |||
| By End-user Industry | IT and Telecom | ||
| BFSI | |||
| Healthcare and Life Sciences | |||
| Retail and E-commerce | |||
| Government and Public Sector | |||
| Other End-user Industries | |||
| By Geography | North America | United States | |
| Canada | |||
| Mexico | |||
| South America | Brazil | ||
| Argentina | |||
| Rest of South America | |||
| Europe | Germany | ||
| United Kingdom | |||
| France | |||
| Italy | |||
| Spain | |||
| Rest of Europe | |||
| Asia Pacific | China | ||
| Japan | |||
| India | |||
| South Korea | |||
| ASEAN | |||
| Rest of Asia Pacific | |||
| Middle East and Africa | Middle East | Saudi Arabia | |
| United Arab Emirates | |||
| Turkey | |||
| Rest of Middle East | |||
| Africa | South Africa | ||
| Nigeria | |||
| Rest of Africa | |||


Key Questions Answered in the Report
What is the current value of the load balancer market?
The load balancer market size reached USD 7.09 billion in 2025 and is projected to climb to USD 13.79 billion by 2030.
Which component holds the largest share today?
Software and virtual appliances command 60.3% of 2024 revenue due to their easy scalability and cloud compatibility.
Why is Kubernetes ingress growing so quickly?
Container adoption drives the need for dynamic, API-driven traffic management that traditional appliances cannot match, resulting in a 14.8% CAGR for Kubernetes ingress solutions.
Which region is expanding fastest?
Asia-Pacific is expected to register a 14.9% CAGR through 2030, propelled by hyperscale data center builds and 5G rollouts.
Page last updated on:


