LNG Carriers Market Size and Share
Market Overview
| Study Period | 2021 - 2031 |
|---|---|
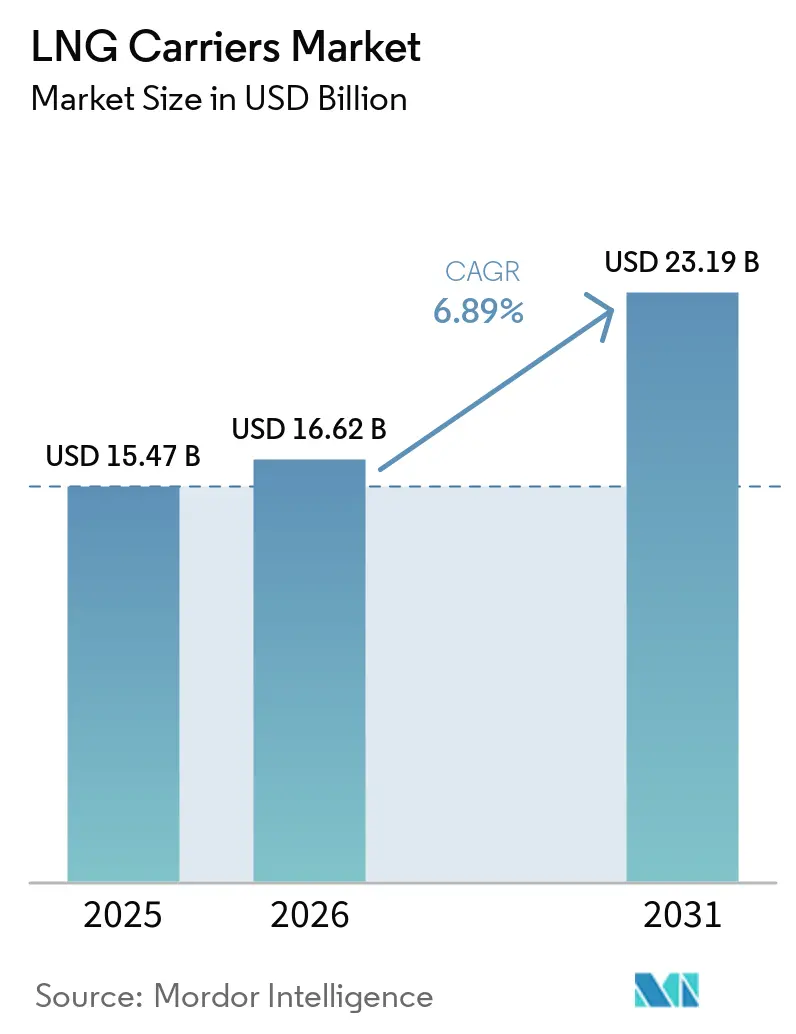
| Market Size (2026) | USD 16.62 Billion |
| Market Size (2031) | USD 23.19 Billion |
| Growth Rate (2026 - 2031) | 6.89% CAGR |
| Fastest Growing Market | Asia Pacific |
| Largest Market | Asia Pacific |
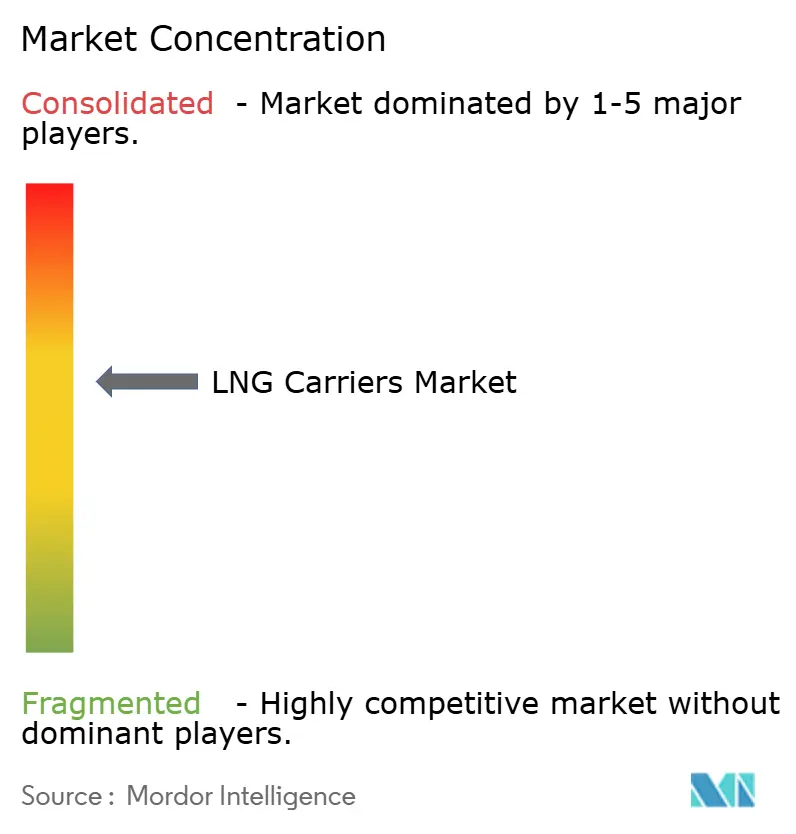
| Market Concentration | Medium |
Major Players *Disclaimer: Major Players sorted in no particular order Image © Mordor Intelligence. Reuse requires attribution under CC BY 4.0. | |
LNG Carriers Market Analysis by Mordor Intelligence
The LNG Carriers Market size is projected to expand from USD 15.47 billion in 2025 and USD 16.62 billion in 2026 to USD 23.19 billion by 2031, registering a CAGR of 6.89% between 2026 to 2031.
Momentum arises from Qatar’s North Field expansion, the tightening of IMO efficiency rules, and growing Asian demand that keeps utilization above 90% despite an orderbook equal to one-half of the active fleet. Membrane containment dominates on volumetric efficiency, dual-fuel engines displace steam turbines for regulatory compliance, and the 180,000–220,000 m³ vessel class balances scale with port access. Charter strategies are split between producers that lock capacity for 20 years and traders who chase spot rate volatility that spiked past USD 200,000 per day in late 2024. Shipbuilding capacity remains concentrated in South Korea and China, pushing newbuild prices to USD 250 million and lengthening lead times to forty-eight months.
Key Report Takeaways
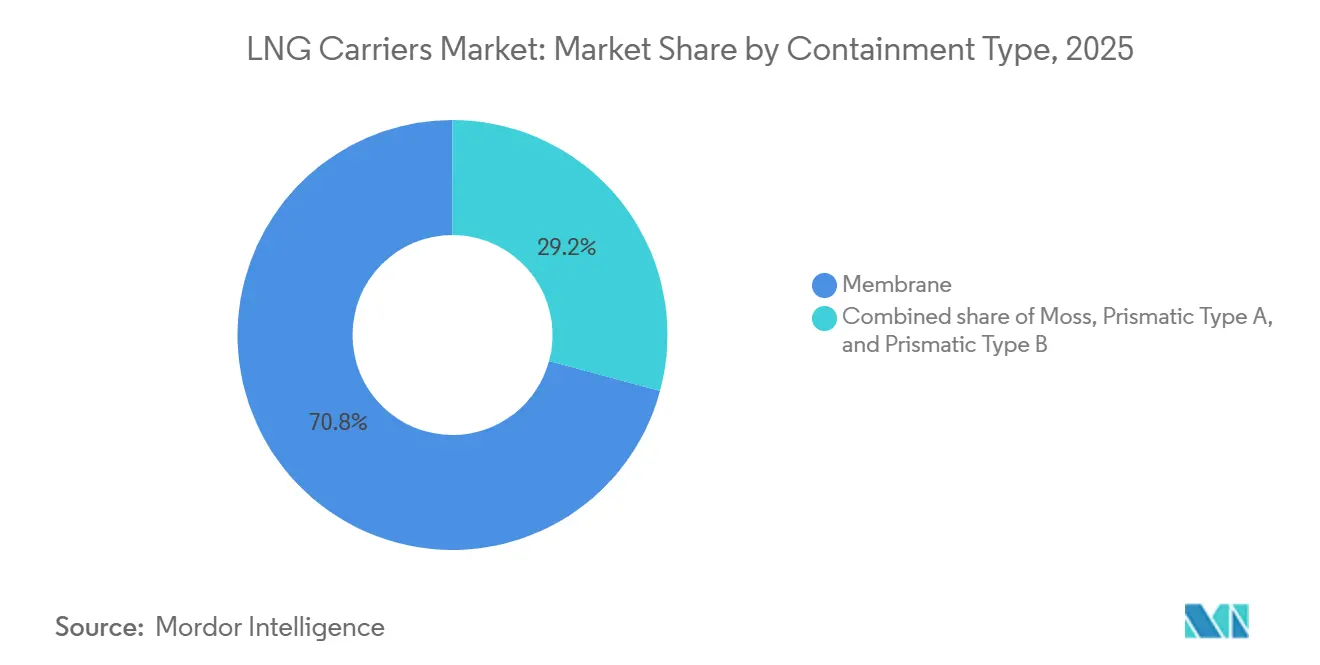
- By containment type, membrane systems held 70.8% revenue share in 2025, while their 7.7% CAGR through 2031 leads segment growth.
- By propulsion type, steam turbines retained 40.2% of the LNG carriers market share in 2025, whereas X-DF two-stroke engines are set to expand at an 8.6% CAGR to 2031.
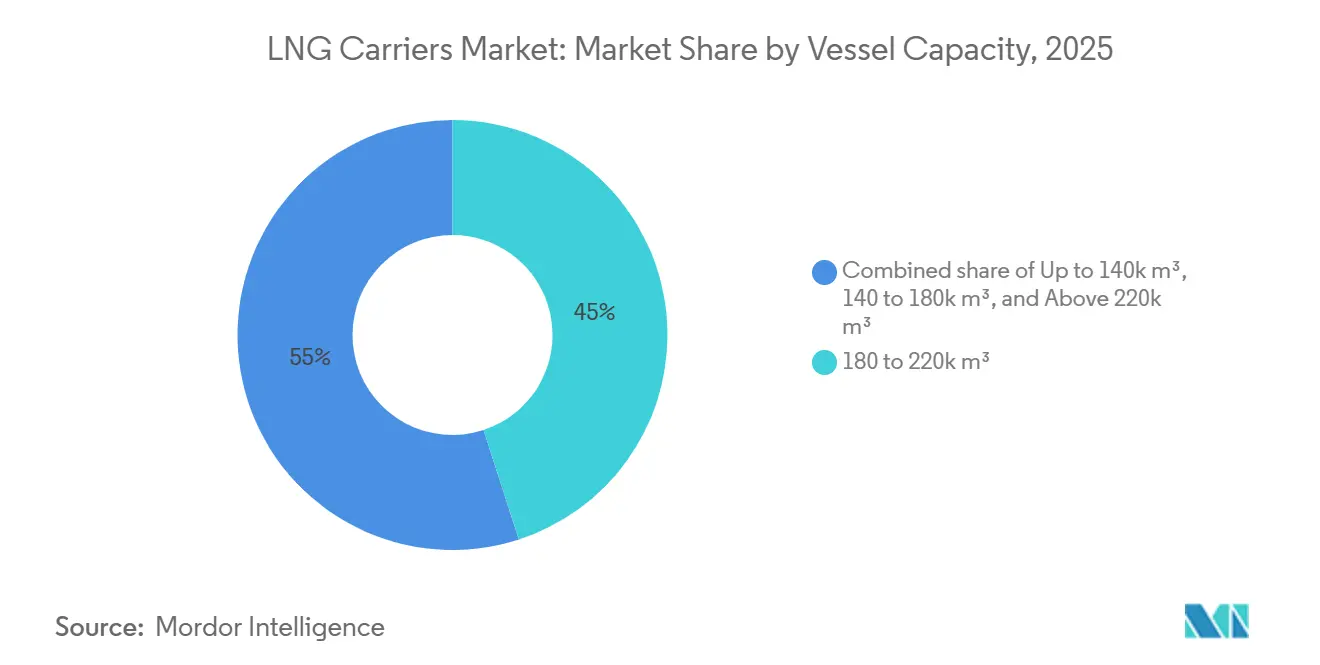
- By vessel capacity, the 180,000–220,000 m³ class captured 45% share of the LNG carriers market size in 2025 and is rising at a 7.4% CAGR through 2031.
- By charter type, time charters controlled 65.4% of the LNG carriers market in 2025, yet spot and voyage charters delivered the fastest 8.0% CAGR to 2031.
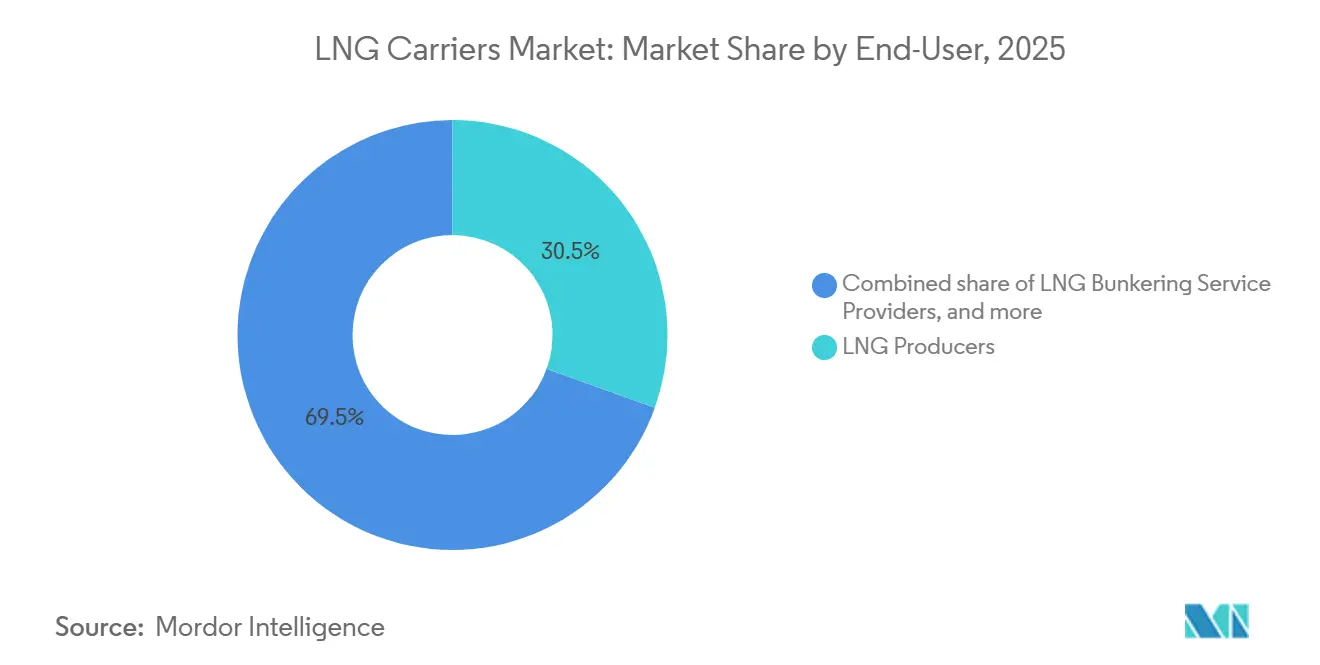
- By end-user, LNG producers commanded a 30.5% share in 2025, while LNG bunkering service providers posted an 8.9% CAGR through 2031.
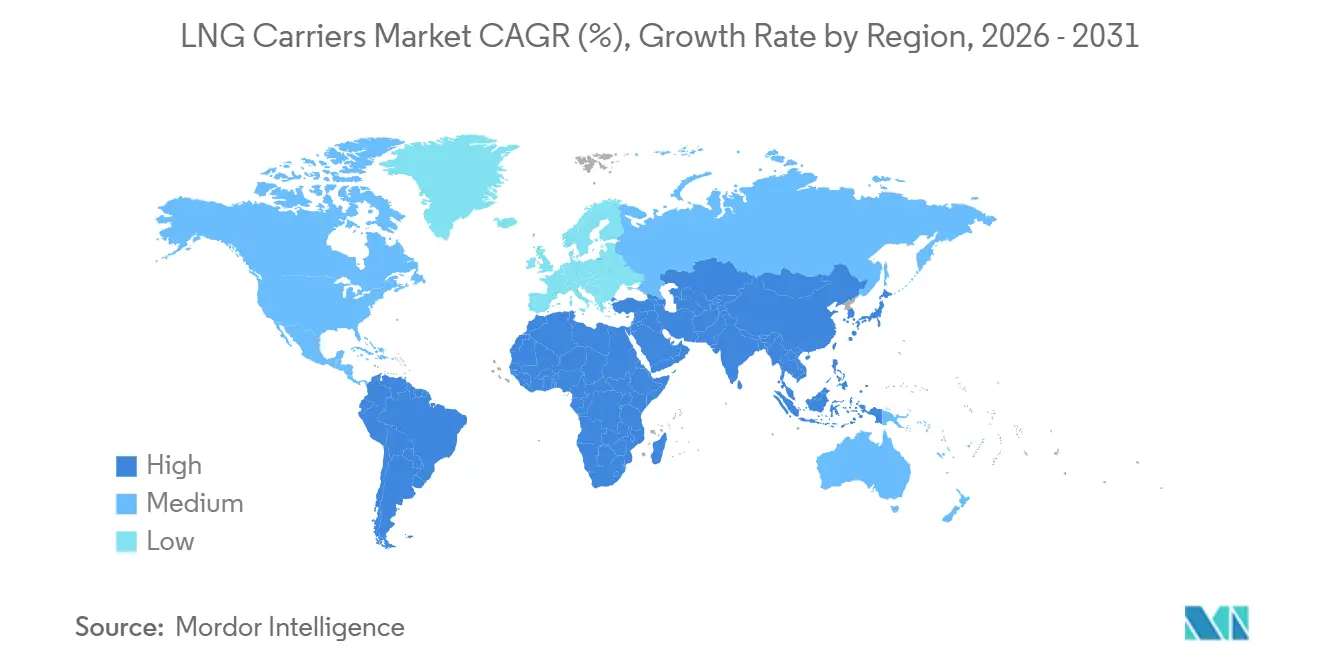
- By geography, Asia-Pacific led with 48.7% revenue share in 2025; the region also records the top regional CAGR at 7.3% to 2031.
Note: Market size and forecast figures in this report are generated using Mordor Intelligence’s proprietary estimation framework, updated with the latest available data and insights as of January 2026.
Global LNG Carriers Market Trends and Insights
Drivers Impact Analysis*
| Driver | (~) % Impact on CAGR Forecast | Geographic Relevance | Impact Timeline |
|---|---|---|---|
| Surge in long-term Qatari/QatarGas charter contracts | +1.8% | Global, with concentration in Asia-Pacific and Europe | Long term (≥ 4 years) |
| IMO EEXI & CII compliance favouring newbuild orders | +1.2% | Global, with early adoption in EU and Japan | Medium term (2-4 years) |
| Rising Asian LNG demand amid coal-to-gas switching | +1.5% | Asia-Pacific core, spillover to Middle East | Medium term (2-4 years) |
| Fleet renewal due to ageing steam-turbine vessels | +0.9% | Global, with focus on Japan, South Korea, and Europe | Long term (≥ 4 years) |
| Hydrogen-ready containment retrofits | +0.6% | Europe and Japan, pilot projects in South Korea | Long term (≥ 4 years) |
| AI-enabled voyage optimisation cutting boil-off losses | +0.7% | Global, with early deployment by major operators | Short term (≤ 2 years) |
| Source: Mordor Intelligence | |||
Surge in Long-Term Qatari Charter Contracts
QatarEnergy is lifting export capacity from 77 million tonnes in 2024 to 142 million tonnes by 2030, requiring 122 dedicated carriers on twenty-five-year charters.[1]QatarEnergy, “North Field Expansion Project Update,” qatarenergy.qa These orders absorb almost all Korean and Chinese yard slots through 2029 and restrict access for independent owners. The eighteen QC-Max vessels at 271,000 m³ each offer 12% lower unit shipping cost on Qatar-to-Asia routes. Charter rates of about USD 120,000 per day insulate producers from spot volatility while guaranteeing shipowners stable cash flows. This bifurcates the LNG carriers market, leaving independents to compete for residual spot cargoes where winter 2024 rates peaked at USD 250,000 per day.
IMO EEXI and CII Compliance Favoring Newbuild Orders
Efficiency rules that entered force in 2023 require a 30% carbon-intensity cut versus 2019 baselines for carriers above 10,000 DWT.[2]International Maritime Organization, “EEXI and CII Regulatory Framework,” imo.org Steam-turbine vessels rated D for three consecutive years face speed limits that prolong voyages and erode earnings. Retrofitting older hulls delivers only small gains for USD 8–15 million, making scrapping economical for units past twenty years. Newbuilds with X-DF or ME-GI engines cut carbon intensity by up to 25% and reduce methane slip below 2 g/kWh. These incentives shifted 68% of 2024-2025 orders toward dual-fuel propulsion.
Rising Asian LNG Demand Amid Coal-to-Gas Switching
Japan and South Korea imported 122 million tonnes in 2024 to safeguard power supply. Southeast Asia is on track for 35 million tonnes of imports by 2030 as Thailand, Vietnam, and the Philippines retire coal plants. China’s 6% import contraction in 2024 stemmed from cheaper coal and stronger hydropower, but policy targets still back double-digit gas growth after 2026. These shifts keep carrier utilization above 90% yet expose owners to demand troughs that can strand capacity. Long-haul routes from the U.S. and Qatar continue to tie up tonnage for eighteen to twenty-two days per voyage.
Fleet Renewal of Aging Steam-Turbine Vessels
Roughly 120 carriers with steam turbines exceeded twenty years of service in 2024, pushing insurance costs up by 60% and shortening dry-dock cycles. Fuel burn runs 30% higher than in dual-fuel ships, adding USD 4 million per year at 2024 bunker prices. Japanese lines plan to retire eighteen of these vessels between 2025 and 2027 while ordering Mark III Flex+ replacements that meet Tier III NOx limits. The two-year delivery lag sustains elevated spot rates and encourages limited retrofits such as advanced hull coatings that cut drag by 5%. Steam turbines, therefore, maintained a 40.2% share in 2025 despite obsolescence.
Restraints Impact Analysis*
| Restraint | (~) % Impact on CAGR Forecast | Geographic Relevance | Impact Timeline |
|---|---|---|---|
| Shipyard slot scarcity & cost inflation | -1.1% | Global, with acute pressure in South Korea and China | Short term (≤ 2 years) |
| Oversupply risk as 50% of fleet on order | -1.4% | Global, with spillover to charter rate compression | Medium term (2-4 years) |
| Methane-slip regulations tightening after 2027 | -0.8% | Europe and North America, with global adoption by 2030 | Long term (≥ 4 years) |
| Strait of Hormuz geopolitical chokepoint risk | -0.6% | Middle East to Asia-Pacific routes | Short term (≤ 2 years) |
| Source: Mordor Intelligence | |||
Methane-Slip Rules Tightening after 2027
The IMO Marine Environment Protection Committee plans standards that limit methane slip to 3 g / kWh by 2030, putting legacy dual-fuel designs at risk. Compliance may require catalytic reduction or engine change-outs costing USD 12–18 million per vessel. Owners who defer upgrades could face port entry restrictions in Europe and North America before 2030.[3]European Commission, “Fit for 55 Package,” ec.europa.eu Financing costs will likely rise, as lenders embed methane metrics into Poseidon Principles assessments. About USD 15 billion in current propulsion investments risk early write-off.
Strait of Hormuz Geopolitical Risk
Twenty-one percent of global Liquid natural gas volumes transited the Strait of Hormuz in 2024, exposing shipments to potential interdiction.[4] U.S. Energy Information Administration, “World LNG Transit Chokepoints,” eia.gov The January 2025 flare-up that prompted naval escorts raised insurance premiums by 15% and diverted three Q-Flex vessels around the Cape of Good Hope. A one-week closure could disrupt 50 cargoes and raise spot charter rates 30% in a month. Producers hold optionality via FSRUs in Europe, yet the rerouting adds fourteen days and USD 2 million in voyage costs. Geopolitical hedging, therefore, remains integral to charter clauses.
*Our forecasts treat driver/restraint impacts as directional, not additive. The impact forecasts reflect baseline growth, mix effects, and variable interactions.
Segment Analysis
By Containment Type: Membrane Systems Dominate on Volumetric Efficiency
Membrane technology secured 70.8% of the LNG carriers market share in 2025 and is projected to grow at a 7.7% CAGR to 2031, supported by GTT’s Mark III Flex+ and NO96 variants that enable 98.5% cargo utilization. Moss spherical tanks stayed relevant for Arctic service with an 18% share, while prismatic Type A and Type B designs filled coastal feeder niches. Membrane systems lower boil-off rates to about 0.11% per day and cut cargo cushioning needs, enhancing freight economics on long routes. Royalties between USD 8 and USD 12 million per hull further anchor GTT’s position.
Emerging hydrogen-ready membranes promise dual-fuel flexibility beyond 2030, although added insulation layers raise upfront cost by 10%. As demand for green fuels rises, early adoption could lift resale values and extend operational life. Moss technology should remain in ice-class projects where mechanical robustness outweighs volumetric penalties. Incremental gains from corrugated stainless liners in Mark III Flex+ shorten cooldown time by six hours, raising annual voyage counts by one per vessel. This reinforces membrane leadership over the forecast horizon.


By Propulsion Type: Dual-Fuel Engines Displace Steam Turbines
Steam turbines still accounted for 40.2% of the LNG carriers market size in 2025, yet X-DF two-stroke engines are expanding at an 8.6% CAGR through 2031. Dual-fuel units burn boil-off gas at high pressure and cut fuel use by 25%, translating into USD 4 million yearly savings. ME-GI engines follow with 24% of newbuild orders thanks to multi-fuel flexibility. DFDE and TFDE systems occupy an 18% share that offers maneuvering agility in emission control areas but lags efficiency benchmarks.
Growing regulatory emphasis on methane slip accelerates steam-turbine retirement despite hull retrofits such as air lubrication that add only marginal benefit. Hybrid STaGE packages blend turbines with auxiliary gas engines and capture specialised trades, yet their 3% orderbook share reflects high complexity. Over time, LNG carriers' market dynamics favor slow-speed dual-fuel engines paired with reliquefaction plants that recover excess boil-off to the cargo tanks, boosting cargo delivered and revenue per voyage.
By Vessel Capacity: 180 000–220 000 m³ Balances Scale and Port Access
Vessels in the 180,000–220,000 m³ class held a 45% share of the LNG carriers market size in 2025 and are expected to post a 7.4% CAGR through 2031. These ships cut freight cost by 10% relative to 140,000 m³ vessels while accessing 90% of global terminals at drafts under 12.5 m. QC-Max hulls at 271 000 m³ secure 12% voyage cost savings on dedicated Qatar‐Asia runs but face berth restrictions at eighteen terminals.
Smaller vessels below 140,000 m³ remain important for feeder routes in Southeast Asia and for ice-class work, though their 28% market share is slowly eroding. The 140,000–180,000 m³ band offers charter versatility, maintaining higher utilization yet sacrifices scale economics. Speculative orders above 220,000 m³ depend on future dredging and terminal upgrades as well as financing appetite for USD 270 million hulls.
By Charter Type: Spot Market Gains as Portfolio Players Exploit Volatility
Time charters controlled 65.4% of the LNG carriers market in 2025, locking rates near USD 120,000 per day over fifteen to twenty-five years. Spot and voyage charters are climbing 8.0% CAGR as traders arbitrage U.S. Gulf supply against seasonal Asian spikes, where prices reached USD 18 per million BTU during the January 2024 cold snap. Bareboat structures serve financial engineering goals but expose owners to performance risk.
The widening spot premium, which averaged 50% above long-term rates in late 2024, encourages owners to keep up to 30% of fleet capacity open for short contracts, adding earnings volatility. Hybrid deals that combine a fixed baseline with a profit share on spot upside gained traction with twelve contracts in 2024. This flexibility could dampen rate swings if oversupply materializes after 2027.
By End-User: LNG Bunkering Emerges as Fastest-Growing Segment
LNG producers captured 30.5% of end-user demand in 2025, leveraging vertical integration to secure logistics for twenty-year offtake agreements. Portfolio players and traders took a 26% share, while utilities held 24% through long-term supply contracts supporting gas-fired generation. LNG bunkering service providers, although small today, are rising at an 8.9% CAGR as IMO sulfur limits steer container and cruise fleets toward gas-fueled engines.
Dedicated bunkering vessels expanded from twelve units in 2020 to forty-eight in 2024, with hubs in Singapore, Rotterdam, and the U.S. Gulf. FSRU and FLNG operators round out demand at 12% through floating infrastructure that substitutes for onshore terminals in emerging markets. The transition to cleaner marine fuels underpins an optimistic outlook for small-scale carriers and associated service providers.
Geography Analysis
Asia-Pacific commanded 48.7% of the LNG carriers market share in 2025 and is forecast to post a 7.3% CAGR to 2031. Japan and South Korea together import 122 million tonnes annually, guaranteeing steady charter demand. China’s 2024 pullback trimmed global trade but is viewed as cyclical, with coal-to-gas targets likely to revive LNG growth beyond 2026. Southeast Asian countries expect combined imports of 35 million tonnes by 2030, creating incremental carrier need and balancing regional exposure.
Europe held a 22% share in 2025, propelled by twelve new import terminals that lifted regasification capacity to 240 million tonnes per year. Germany alone imported 32 million tonnes via FSRUs in 2024 after ending its Russian pipeline supply. Renewable build-out dampens baseload gas use, yet port entry rules on methane slip accelerate dual-fuel fleet adoption and stimulate LNG carriers market modernization.
North America and the Middle East are export hubs at 15% and 10% share, respectively. U.S. liquefaction rose to 98 million tonnes in 2024 and drives annual demand for eighteen to twenty-two carriers on Gulf-to-Asia routes. Qatar’s North Field expansion secures 122 newbuilds through 2030, reinforcing orderbook momentum and underpinning LNG carriers market size growth. South America holds 5% share, led by Brazil, where import dependence varies with hydropower availability, adding cyclicality to regional charter rates.

Competitive Landscape
The shipbuilding segment is quasi-oligopolistic, with three Korean yards and two Chinese yards controlling 92% of the orderbook and pushing newbuild prices to USD 250 million. High capital intensity exceeding USD 2 billion per yard and exclusive GTT licensing maintain high entry barriers. Vessel operation is fragmented among more than eighty owners; Nakilat leads with seventy-four carriers, yet holds under 8% of global capacity.
Strategic activity during 2025 reflects vertical integration and technology positioning. Hanwha Ocean’s USD 2.8 billion order for twelve carriers from QatarEnergy secured yard capacity through 2030 and deepened reliance on Korean construction. Mitsui O.S.K. Lines formed a joint venture with TotalEnergies to operate eight X-DF carriers dedicated to Mozambique LNG, aligning logistics with upstream expansion. Samsung Heavy Industries delivered the first QC-Max hull incorporating Mark III Flex+ containment, setting a new benchmark on the Qatar-Asia corridor.
White-space opportunities cluster around bunkering, hydrogen-ready retrofits, and digital efficiency. Only forty-eight LNG bunkering vessels serve a growing fleet of gas-fueled merchant ships, suggesting room for eighty-plus additional units by 2030. Shipyards pilot dual-fuel hydrogen designs that could future-proof assets and capture early decarbonization premiums. AI platforms that cut boil-off gas by eight to twelve percent provide quick payback and could become an industry standard as carbon reporting tightens.
LNG Carriers Industry Leaders
Samsung Heavy Industries
Hyundai Heavy Industries Group
Daewoo Shipbuilding & Marine Engineering
Qatar Gas Transport Co. (Nakilat)
Mitsui O.S.K. Lines
- *Disclaimer: Major Players sorted in no particular order

Recent Industry Developments
- December 2025: NYK, Kawasaki Kisen Kaisha, Ltd., MISC Berhad, and China LNG Shipping (Holdings) Limited, in a joint venture, named two new liquefied natural gas (LNG) carriers for QatarEnergy, Qatar's state-owned energy company.
- December 2025: Seapeak, a shipowner, has placed an order for two new LNG carriers at Samsung Heavy Industries, securing a long-term time-charter business. The vessels are set to be delivered by September 2028, with the yard quoting a total price of KRW 721.1bn (USD 498.7 million) for both ships.
- December 2025: Capital Clean Energy Carriers (CCEC) has bolstered its long-term LNG strategy, placing an order for three state-of-the-art LNG carriers at HD Hyundai Samho Heavy Industries in South Korea, with a financial commitment nearing USD 770 million.


Global LNG Carriers Market Report Scope
An LNG carrier is a ship designed to transport liquefied natural gas in its chilled tanks. LNG carriers emit fewer greenhouse gases than conventional vessels because they are powered by natural gas.
The LNG carriers market is segmented by containment type, propulsion type, vessel capacity, charter type, end-user, and geography. By containment type, the market is segmented into moss, membrane, prismatic type A, and prismatic type B. By propulsion type, the market is segmented into steam turbine, DFDE/TFDE, slow-speed diesel + relique, ME-GI, X-DF two-stroke, and hybrid STaGE. By vessel capacity, the market is segmented into Up to 140k m³, 140 to 180k m³, 180 to 220k m³, and above 220k m³. By charter type, the market is segmented into time charter, spot/voyage, and bareboat. By end-user, the market is segmented into LNG producers, portfolio players and traders, utilities and IPPs, FSRU/FLNG operators, and LNG Bunkering Service Providers. The report also covers the market size and forecasts for the LNG carrier market across the major regions (North America, Europe, Asia-Pacific, the Middle East and Africa, and South America). For each segment, the market sizing and forecasts have been done on the revenue (USD billion).
| Moss |
| Membrane |
| Prismatic Type A |
| Prismatic Type B |
| Steam Turbine |
| DFDE/TFDE |
| Slow-Speed Diesel + Relique |
| ME-GI |
| X-DF Two-Stroke |
| Hybrid STaGE |
| Up to 140k m3 |
| 140 to 180k m3 |
| 180 to 220k m3 |
| Above 220k m3 |
| Time Charter |
| Spot/Voyage |
| Bareboat |
| LNG Producers |
| Portfolio Players and Traders |
| Utilities and IPPs |
| FSRU/FLNG Operators |
| LNG Bunkering Service Providers |
| North America | United States |
| Canada | |
| Mexico | |
| Europe | Germany |
| France | |
| Spain | |
| United Kingdom | |
| Russia | |
| Norway | |
| Rest of Europe | |
| Asia-Pacific | China |
| India | |
| Japan | |
| South Korea | |
| ASEAN Countries | |
| Australia and New Zealand | |
| Rest of Asia-Pacific | |
| South America | Brazil |
| Argentina | |
| Peru | |
| Rest of South America | |
| Middle East and Africa | Saudi Arabia |
| United Arab Emirates | |
| Qatar | |
| South Africa | |
| Nigeria | |
| Egypt | |
| Angola | |
| Rest of Middle East and Africa |
| By Containment Type | Moss | |
| Membrane | ||
| Prismatic Type A | ||
| Prismatic Type B | ||
| By Propulsion Type | Steam Turbine | |
| DFDE/TFDE | ||
| Slow-Speed Diesel + Relique | ||
| ME-GI | ||
| X-DF Two-Stroke | ||
| Hybrid STaGE | ||
| By Vessel Capacity | Up to 140k m3 | |
| 140 to 180k m3 | ||
| 180 to 220k m3 | ||
| Above 220k m3 | ||
| By Charter Type | Time Charter | |
| Spot/Voyage | ||
| Bareboat | ||
| By End-User | LNG Producers | |
| Portfolio Players and Traders | ||
| Utilities and IPPs | ||
| FSRU/FLNG Operators | ||
| LNG Bunkering Service Providers | ||
| By Geography | North America | United States |
| Canada | ||
| Mexico | ||
| Europe | Germany | |
| France | ||
| Spain | ||
| United Kingdom | ||
| Russia | ||
| Norway | ||
| Rest of Europe | ||
| Asia-Pacific | China | |
| India | ||
| Japan | ||
| South Korea | ||
| ASEAN Countries | ||
| Australia and New Zealand | ||
| Rest of Asia-Pacific | ||
| South America | Brazil | |
| Argentina | ||
| Peru | ||
| Rest of South America | ||
| Middle East and Africa | Saudi Arabia | |
| United Arab Emirates | ||
| Qatar | ||
| South Africa | ||
| Nigeria | ||
| Egypt | ||
| Angola | ||
| Rest of Middle East and Africa | ||


Key Questions Answered in the Report
How big will the LNG carriers market be by 2031?
It is forecast to reach USD 23.19 billion by 2031, up from USD 16.62 billion in 2026, at a 6.89% CAGR.
Which containment technology is most widely used on LNG carriers?
Membrane systems held 70.8% share in 2025 thanks to higher volumetric efficiency and lower boil-off rates.
Why are X-DF engines gaining popularity on newbuild LNG carriers?
X-DF dual-fuel engines cut fuel use by 25% versus steam turbines and meet IMO EEXI and CII emission rules.
What drives the need for 180 000-220 000 m³ vessel sizes?
They balance scale economies with access to nearly all import terminals, capturing 45% of fleet share in 2025.
How fast is LNG bunkering demand growing?
LNG bunkering service providers register an 8.9% CAGR, supported by IMO sulfur limits and more gas-fueled ships.
Which regions add the most LNG carrier demand through 2031?
Asia-Pacific leads with a 7.3% CAGR, driven by Japan, South Korea, and emerging Southeast Asian import growth.
Page last updated on:


