Liquid Nitrogen Market Size and Share
Market Overview
| Study Period | 2020 - 2031 |
|---|---|
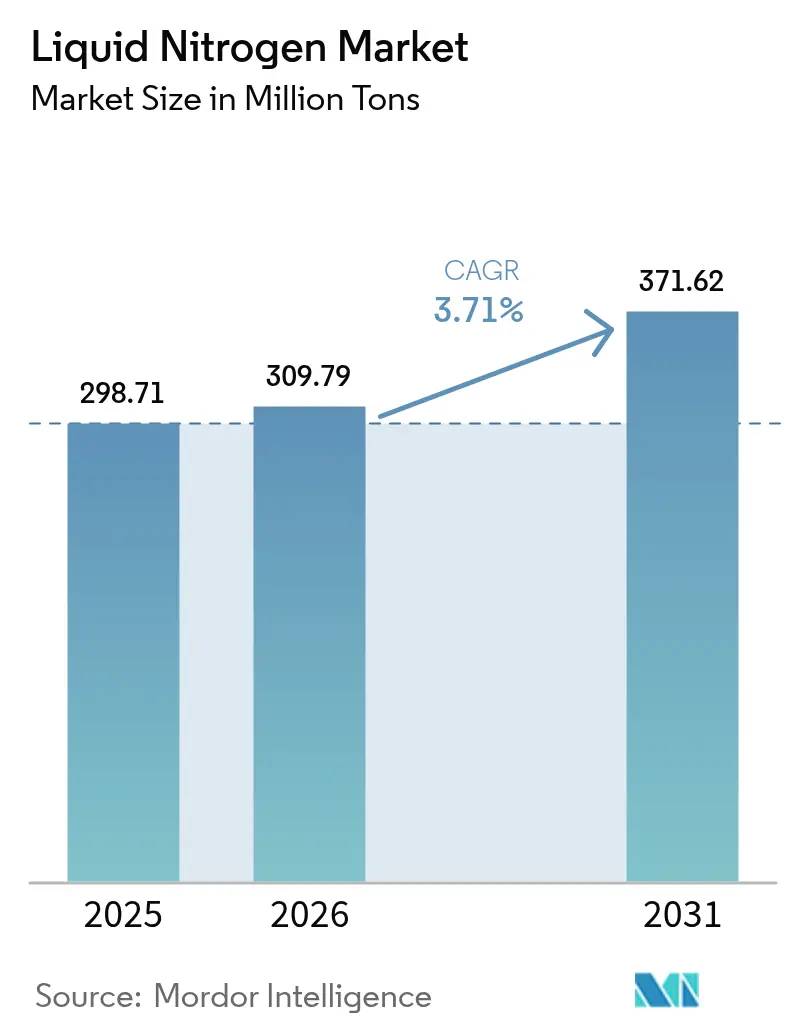
| Market Volume (2026) | 309.79 Million tons |
| Market Volume (2031) | 371.62 Million tons |
| Growth Rate (2026 - 2031) | 3.71% CAGR |
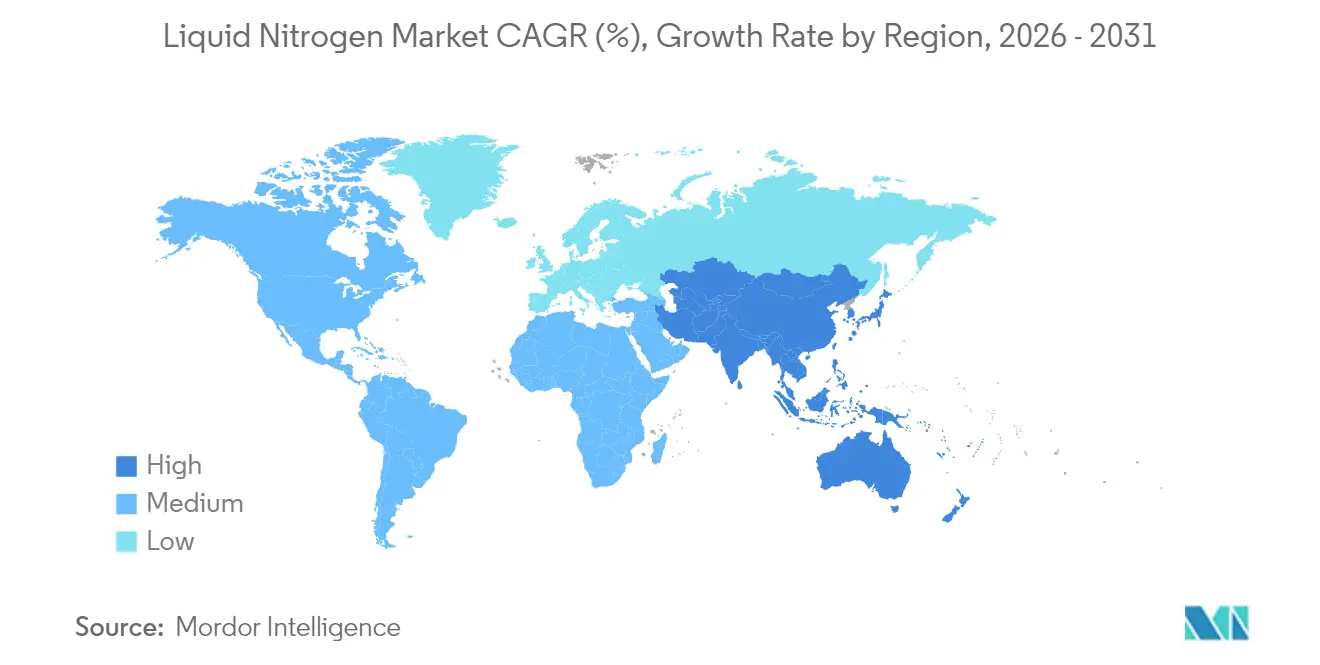
| Fastest Growing Market | Asia Pacific |
| Largest Market | Asia Pacific |
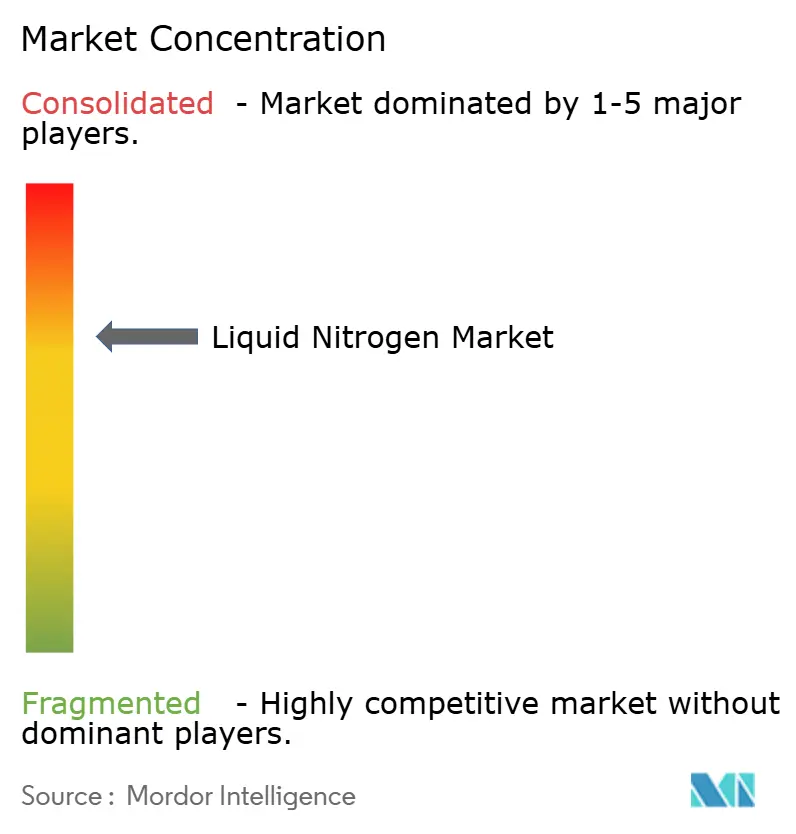
| Market Concentration | Medium |
Major Players *Disclaimer: Major Players sorted in no particular order Image © Mordor Intelligence. Reuse requires attribution under CC BY 4.0. | |
Liquid Nitrogen Market Analysis by Mordor Intelligence
The Liquid Nitrogen Market size in 2026 is estimated at 309.79 Million tons, growing from 2025 value of 298.71 Million tons with 2031 projections showing 371.62 Million tons, growing at 3.71% CAGR over 2026-2031. This healthy expansion underscores the liquid nitrogen market’s evolution from a bulk refrigerant business toward high-value, application-engineered solutions in pharmaceuticals, electronics, and superconducting infrastructure where technical substitutes remain limited[1]Air Liquide, “2024 Universal Registration Document,” airliquide.com. Structural demand is further anchored by long-term supply contracts between air-separation unit operators and anchor customers that view ultra-low-temperature reliability as mission-critical. Asia-Pacific sets the pace, supported by China’s semiconductor build-out and India’s biologics capacity, while North America and Europe preserve demand through biologics cold-chain investments and outpatient oncology adoption. On the supply side, vertically integrated majors deploy digital logistics platforms and energy-efficient plants that compress delivered cost and improve service certainty. Mid-sized regional firms carve out pockets of growth in specialty food processing and laboratory services, illustrating that a balanced ecosystem sustains competitive intensity without suppressing innovation.
Key Report Takeways
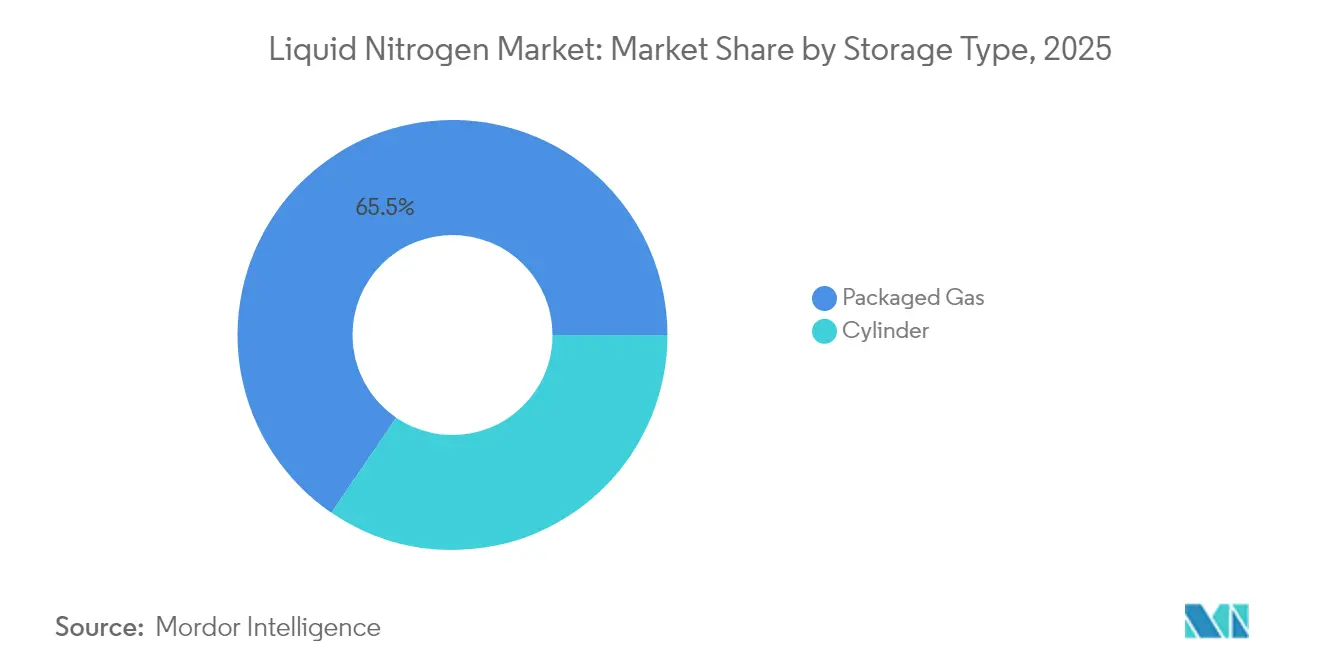
- By storage type, packaged gas held 65.48% of the Liquid Nitrogen market share in 2025, whereas cylinder storage is projected to expand at a 4.15% CAGR through 2031.
- By function, coolant applications commanded 57.72% share of the Liquid Nitrogen market size in 2025, while refrigerant use is advancing at a 4.63% CAGR to 2031.
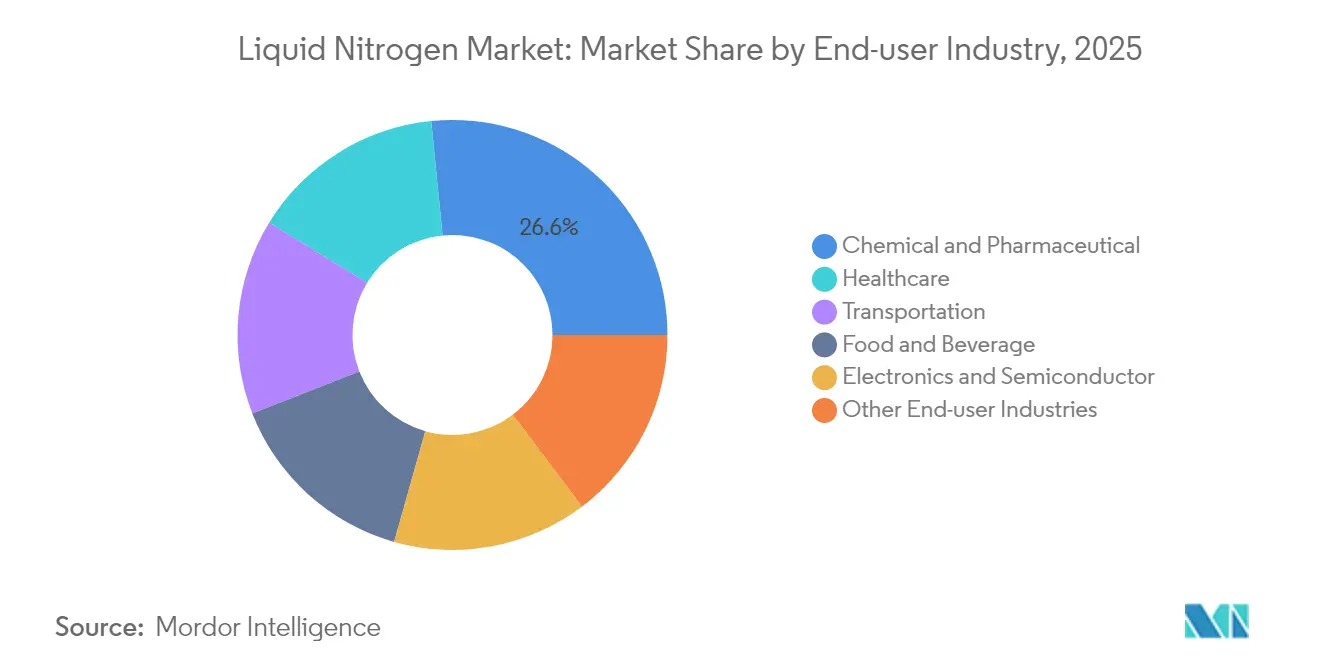
- By end-user industry, the chemical and pharmaceutical segment accounted for 26.58% of the Liquid Nitrogen market size in 2025, and the food and beverage segment is growing fastest at a 4.82% CAGR through 2031.
- By geography, Asia-Pacific led with 46.10% revenue share in 2025 and is forecast to grow at a 4.36% CAGR to 2031.
Note: Market size and forecast figures in this report are generated using Mordor Intelligence’s proprietary estimation framework, updated with the latest available data and insights as of 2026.
Global Liquid Nitrogen Market Trends and Insights
Drivers Impact Analysis*
| Driver | (~) % Impact on CAGR Forecast | Geographic Relevance | Impact Timeline |
|---|---|---|---|
| Increasing demand from chemical and pharmaceutical industry | +0.8% | Global, with concentration in North America & APAC | Medium term (2-4 years) |
| Cryogenic logistics expansion for biologics cold-chains | +0.6% | North America & EU core, expanding to APAC | Long term (≥ 4 years) |
| Rapid uptake of LN2 cryo-ablation devices in outpatient oncology | +0.5% | North America & EU, early adoption in urban APAC | Medium term (2-4 years) |
| Sub-cooled LN2 systems for superconducting grid projects | +0.4% | Global, with early deployment in China & EU | Long term (≥ 4 years) |
| On-site ASU co-product strategies boosting captive supply | +0.3% | Industrial clusters globally, concentrated in APAC | Short term (≤ 2 years) |
| Source: Mordor Intelligence | |||
Increasing Demand from Chemical and Pharmaceutical Industry
Liquid nitrogen underpins inert atmospheres, rapid crystallization, and moisture-free handling that define modern active pharmaceutical ingredient quality. Continuous manufacturing lines require instantaneous temperature shifts that only liquid nitrogen can provide without chemical contamination. Regulatory encouragement for continuous processes accelerates adoption as companies de-risk scale-up timelines. Demand density in pharmaceutical hubs justifies dedicated pipelines, lowering delivered cost and cementing supplier–customer partnerships. The segment also benefits from burgeoning specialty chemical output in the Asia-Pacific that views cryogenic inerting as a productivity multiplier. A virtuous cycle emerges in which stringent purity norms, higher biologics complexity, and proximity logistics jointly lift off-take volumes for leading gas producers.
Cryogenic Logistics Expansion for Biologics Cold-Chains
Personalized medicine drives unprecedented cold-chain complexity. Cell and gene therapies need -80 °C to -196 °C transport conditions, and liquid nitrogen enables this temperature window with reliable phase behavior[2]Haier Biomedical, “Cryogenic Chain Connected Solutions,” haierbiomedical.com. Equipment makers add IoT telemetry that alerts handlers if excursion risk occurs, raising confidence among regulators and insurers. Pharmaceutical sponsors are building distributed manufacturing nodes; each node demands liquid nitrogen tanks, vaporizers, and fail-safe alarms. The high value of shipped biologics means logistics providers accept premium nitrogen pricing because loss events are costlier than gas expenditure. North America dominates volumes, yet European and Asian sites are scaling as approval pipelines widen.
Rapid Uptake of LN2 Cryo-Ablation Devices in Outpatient Oncology
Outpatient clinics increasingly treat dermatologic and small solid tumors via liquid-nitrogen-driven cryo-ablation that avoids operating-room scheduling and general anesthesia. Compact devices create precisely controlled ice fronts, destroying tissue while sparing margins, and achieve outcomes similar to surgical excision with lower cost. Favorable reimbursement and patient preference for same-day procedures spur recurring nitrogen consumption. Device suppliers now design modular dewars and quick-connect valves that minimize waste and simplify staff training. Growth is strongest in dermatology chains in the United States and Germany, with urban Asia-Pacific practitioners beginning to adopt.
Sub-Cooled LN2 Systems for Superconducting Grid Projects
Utilities seek transmission efficiency and grid stability. High-temperature superconducting cables cooled with sub-cooled liquid nitrogen eliminate resistive losses and enable compact rights-of-way. China’s State Grid and European operators have completed demonstration lines that run at -196 °C using closed-loop nitrogen baths. Each kilometer of cable embeds dedicated refrigerator stations and backup dewars, locking in multi-decade gas demand. Government decarbonization targets align with the technology, and supplier consortia offer turnkey cooling stacks paired with long-term gas contracts. As pilot projects validate economics, the addressable load for liquid nitrogen suppliers broadens beyond electronics into energy infrastructure.
Restraints Impact Analysis*
| Restraint | (~) % Impact on CAGR Forecast | Geographic Relevance | Impact Timeline |
|---|---|---|---|
| Safety and regulatory compliance costs for LN2 plants | -0.70% | Global, with stricter enforcement in North America & EU | Short term (≤ 2 years) |
| High energy intensity/carbon footprint of cryogenic distillation | -0.40% | Global, with higher impact in regions with carbon pricing (EU, California) | Medium term (2-4 years) |
| High-efficiency mechanical freezers eroding LN2 demand | -0.50% | Industrial markets globally, concentrated in food processing | Medium term (2-4 years) |
| Source: Mordor Intelligence | |||
Safety and Regulatory Compliance Costs for LN2 Plants
Authorities tightened oversight after several cryogenic incidents, mandating improved ventilation, oxygen-deficiency monitoring, and operator certification. OSHA inspections grew more frequent, raising compliance budgets for gas producers and distributors. Smaller operators struggle to fund upgrades and higher insurance premiums, prompting an uptick in plant divestitures to majors that can amortize costs over larger sales books. While these measures improve workplace safety, they elevate entry barriers and can delay new capacity rollouts, marginally tempering overall liquid nitrogen market growth.
High-Efficiency Mechanical Freezers Eroding LN2 Demand
Advances in cascade and pulse-tube refrigeration deliver -80 °C chambers with lower electricity draw, challenging liquid nitrogen in certain food and biostorage niches. Manufacturers value simplified logistics when they can avoid tank deliveries and venting protocols. Electrical capital outlay is declining as heat-recovery integration offsets utility bills, making mechanical systems appealing in energy-price-sensitive regions. Although mechanical units cannot reach -196 °C, they satisfy many frozen food specifications, trimming incremental nitrogen tonnage, especially in mature markets where retrofit cycles favor new efficiency standards.
*Our forecasts treat driver/restraint impacts as directional, not additive. The impact forecasts reflect baseline growth, mix effects, and variable interactions.
Segment Analysis
By Storage Type – Packaged Gas Remains Dominant While Cylinder Usage Accelerates
Packaged gas led the liquid nitrogen market with a 65.48% liquid nitrogen market share in 2025, owing to cost-effective tanker deliveries that match the high-volume, steady-state consumption profiles of petrochemical, metallurgy, and electronics customers. Bulk storage tanks accept daily top-ups, minimizing handling and vapor loss. Logistics hubs near industrial corridors capitalize on rail sidings and dedicated truck fleets, keeping per-ton transport expense low. Customer retention is strong because site piping and control systems are optimized for bulk flow.
Though smaller today, Cylinder storage is the liquid nitrogen market’s fastest riser at a 4.15% CAGR through 2031 as laboratories, medical practices, and contract manufacturing facilities prefer portability and simplified permitting. Cylinder-based micro-bulk solutions give users modular scalability without installing permanent tanks. Suppliers leverage telemetry caps that transmit fill levels, scheduling dynamic routing, and minimizing stockouts. The growth bifurcation implies that firms able to harmonize bulk tanker infrastructure with agile cylinder services will capture the widest segment spread.


By Function – Coolant Volumes Anchor the Base While Refrigerant Use Gains Momentum
Coolant applications accounted for 57.72% of the Liquid Nitrogen market size in 2025, evident in furnace inerting, semiconductor wafer cooling, and metal quenching lines that cannot risk oxidation. These legacy sectors favor stable contractual volumes and drive network planning for producers. Continuous flow further enables nitrogen recycling loops that lower unit cost and curb vent emissions. Suppliers deploy dedicated pipelines within megaplants, reducing trucking dependency and tightening supplier–client ties.
Refrigerant applications grow at a 4.63% CAGR, outpacing coolants as manufacturers of plant-based proteins, premium ice cream, and ready-to-drink coffee adopt liquid nitrogen for instantaneous freezing and nitrogen infusion. Due to ultracold vaccine logistics, the liquid nitrogen market size attributed to pharmaceuticals also swells within the refrigerant bucket. Although starting from a smaller base, refrigerant buyers value purity grade and temperature control, allowing suppliers to charge premium spreads. Strategic positioning toward these high-margin niches safeguards producers from commoditization pressure prevalent in the traditional coolant domain.
By End-User Industry – Chemical Leadership Persists While Food Becomes the Growth Engine
Chemical and pharmaceutical users claimed 26.58% of Liquid Nitrogen market share in 2025, leveraging nitrogen to protect moisture-sensitive reactions and boost crystallization yields. Continuous-flow reactors in drug manufacture benefit from nitrogen’s instant cooling that stabilizes polymorph forms and preserves potency, with regulators accelerating approvals for continuous plants, nitrogen volumes per kilogram of output inch upward. Geographic clustering of pharma hubs in North America, Western Europe, and India concentrates demand, enabling pipeline distribution and lowering logistics costs.
Food and beverage is the fastest-expanding customer base at a 4.82% CAGR, powered by plant-based meat texturization, nitrogen dosing in cold brew coffee, and micro-bubble formation in craft beer. Consumer preference for clean-label processing favors cryogenic freezing over brine methods, as nitrogen leaves no residue. Small-batch producers select cylinder packages that integrate with compact spiral freezers, boosting service frequency for distributors. This juxtaposition of steady chemical volumes and dynamic food innovation underscores balanced portfolio opportunities for suppliers seeking resilience across economic cycles.
Geography Analysis
Asia-Pacific commanded 46.10% of the Liquid Nitrogen market share in 2025 and is projected to expand at a 4.36% CAGR through 2031, reinforcing its dual status as the largest and fastest-growing region. China leads wafer fabrication investments exceeding USD 50 billion, each fab demanding nitrogen purities under 1 ppm oxygen for etching and testing. India’s biologics surge compounds demand, with new vaccine lines installing bulk nitrogen tanks alongside automated vapor phase storage. Local governments subsidize pipeline corridors in industrial parks, fostering captive demand clusters.
North America maintains mature yet robust consumption anchored by petrochemicals on the Gulf Coast, expansive food processing in the Midwest, and biopharmaceutical hubs in Massachusetts and North Carolina. Long-term contracts between medical centers and gas majors ensure stable bulk dispatches, while outpatient oncology drives incremental cylinder usage. Plant expansions employ energy-recovery turbines and advanced adsorption cycles, trimming electricity intensity by 15%, sustaining competitiveness amid rising power tariffs.
Europe balances stability with innovation, pivoting toward superconducting grid pilots and advanced therapy supply chains. Strict safety codes heighten operating costs, yet high disposable income supports premium nitrogen applications in gastronomy and craft beverages. South America and Middle East & Africa trail in volume but show accelerating installations of packaged gas depots serving food exports and petrochemical complexes. Brazil’s nitrogen-freeze shrimp exports and Saudi Arabia’s polymer projects represent early anchor loads that can scale distribution density. This geographic mosaic demonstrates that global suppliers must navigate differing regulatory, infrastructure, and application maturity levels to maximize portfolio yield.

Competitive Landscape
The Liquid Nitrogen market is moderately concentrated. Vertically integrated operations grant these firms control from oxygen sales to turnkey cryogenic freezers, embedding them deeply within customer process design. Recent capital programs favor modular, energy-efficient ASUs, yielding lower specific power draw and enhancing sustainability credentials in carbon-conscious sectors. The largest companies are acquiring distributors to secure last-mile access, as illustrated by Linde’s Southeast Asia deal that added twelve depots in 2024. The upshot is a landscape where scale and specialization coexist, yet the bargaining power tilts toward providers that combine both attributes.
Liquid Nitrogen Industry Leaders
Air Liquide
Linde PLC
TAIYO NIPPON SANSO CORPORATION
Air Products and Chemicals, Inc.
Messer
- *Disclaimer: Major Players sorted in no particular order

Recent Industry Developments
- August 2025: Taiyo Nippon Sanso Corporation (TNSC) secured a long-term off-site corporate Power Purchase Agreement with Mitsubishi Corporation Clean Energy Ltd to procure electricity derived from renewable sources. With this green energy, TNSC is set to debut its sales of Green Liquid Nitrogen.
- July 2024: Air Liquide inaugurated a new air separation unit (ASU) in Kosi, Uttar Pradesh, India, bolstering healthcare and industrial merchant operations. This ASU boasts a daily production capacity exceeding 300 tonnes of liquid and medical oxygen, approximately 45 tonnes of liquid nitrogen, and 12 tonnes of liquid argon.


Global Liquid Nitrogen Market Report Scope
Nitrogen in a liquid state at low temperature is known as liquid nitrogen. It is a form of element nitrogen and can be used in cryogenic and cooling applications. It is included in all main pharmacological medication classes, including antibiotics. The liquid nitrogen market is segmented based on storage type, function, end-user industry, and geography. The liquid nitrogen market is segmented into cylinders and packaged gas by storage type. By function, the market is segmented into coolant and refrigerant. The end-user industry segments the market into chemical, pharmaceutical, healthcare, transportation, and other industries. The report also covers the market size and forecasts for the liquid nitrogen market in 15 countries across major regions. Each segment's market sizing and forecasts are based on volume (million tons).
| Cylinder |
| Packaged Gas |
| Coolant |
| Refrigerant |
| Chemical and Pharmaceutical |
| Healthcare |
| Transportation |
| Food and Beverage |
| Electronics and Semiconductor |
| Other End-user Industries |
| Asia-Pacific | China |
| India | |
| Japan | |
| South Korea | |
| Rest of Asia-Pacific | |
| North America | United States |
| Canada | |
| Mexico | |
| Europe | Germany |
| United Kingdom | |
| Italy | |
| France | |
| Russia | |
| Rest of Europe | |
| South America | Brazil |
| Argentina | |
| Rest of South America | |
| Middle East and Africa | Saudi Arabia |
| South Africa | |
| Rest of Middle East and Africa |
| By Storage Type | Cylinder | |
| Packaged Gas | ||
| By Function | Coolant | |
| Refrigerant | ||
| End-User Industry | Chemical and Pharmaceutical | |
| Healthcare | ||
| Transportation | ||
| Food and Beverage | ||
| Electronics and Semiconductor | ||
| Other End-user Industries | ||
| By Geography | Asia-Pacific | China |
| India | ||
| Japan | ||
| South Korea | ||
| Rest of Asia-Pacific | ||
| North America | United States | |
| Canada | ||
| Mexico | ||
| Europe | Germany | |
| United Kingdom | ||
| Italy | ||
| France | ||
| Russia | ||
| Rest of Europe | ||
| South America | Brazil | |
| Argentina | ||
| Rest of South America | ||
| Middle East and Africa | Saudi Arabia | |
| South Africa | ||
| Rest of Middle East and Africa | ||


Key Questions Answered in the Report
How large is the liquid nitrogen market in 2026?
The liquid nitrogen market size is 309.79 million tons in 2026 and is forecast to reach 371.62 million tons by 2031.
Which region leads demand for liquid nitrogen?
Asia-Pacific holds 46.10% of global volume, driven by semiconductor fabs in China and pharmaceutical growth in India.
What is the fastest-growing end-user segment?
Food and beverage applications are expanding at a 4.82% CAGR due to plant-based protein processing and nitrogen-infused beverages.
Why are cylinder deliveries gaining popularity?
Smaller labs and outpatient clinics prefer cylinder packages for portability and lower upfront infrastructure cost.
What main restraint could slow growth?
Rising compliance expenses for safety upgrades and competition from high-efficiency mechanical freezers may temper adoption rates.
Page last updated on:


