Liquid Handling System Market Size and Share
Market Overview
| Study Period | 2020 - 2031 |
|---|---|
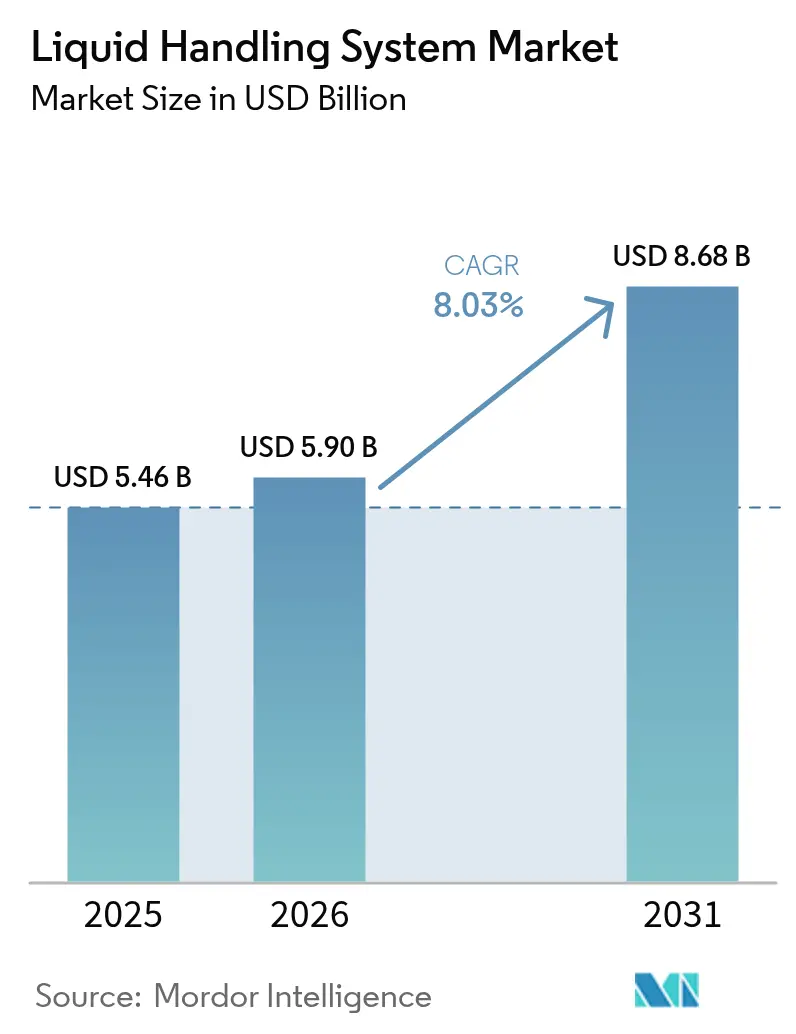
| Market Size (2026) | USD 5.9 Billion |
| Market Size (2031) | USD 8.68 Billion |
| Growth Rate (2026 - 2031) | 8.03% CAGR |
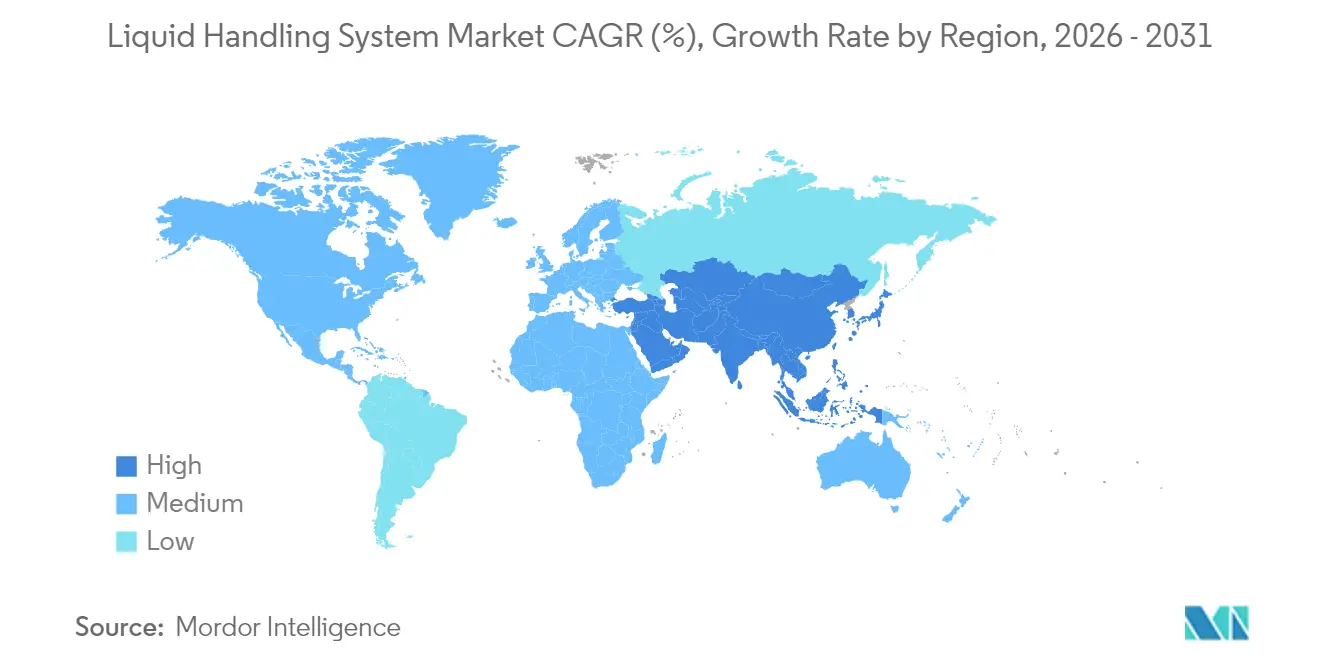
| Fastest Growing Market | Asia Pacific |
| Largest Market | North America |
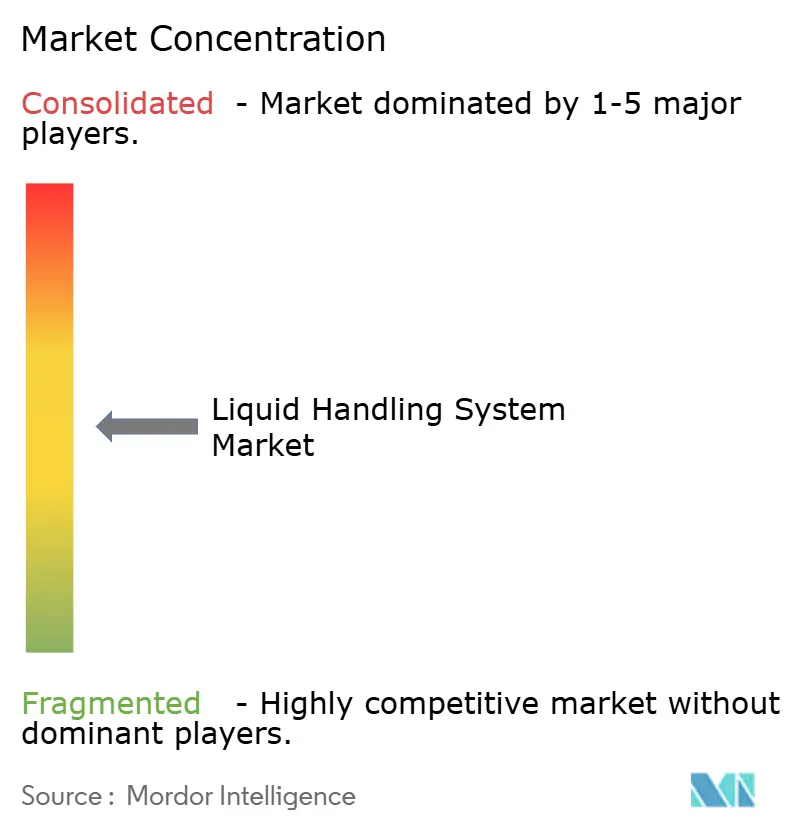
| Market Concentration | Medium |
Major Players *Disclaimer: Major Players sorted in no particular order Image © Mordor Intelligence. Reuse requires attribution under CC BY 4.0. | |
Liquid Handling System Market Analysis by Mordor Intelligence
liquid handling system market size in 2026 is estimated at USD 5.9 billion, growing from 2025 value of USD 5.46 billion with 2031 projections showing USD 8.68 billion, growing at 8.03% CAGR over 2026-2031. Strong adoption of automated systems in pharmaceutical, biotechnology and clinical diagnostic laboratories is driving this expansion as users aim to improve precision and throughput. High-throughput screening requirements, regulations mandating traceable workflows, and expanding cell and gene therapy pipelines are deepening dependence on integrated robotics and acoustic dispensers. Venture investment in synthetic-biology start-ups, advances in microfluidic nano-dispensing and the convergence of AI with laboratory automation are widening deployment options, while modular financing models are lowering capital barriers. Competitive intensity is rising as leading vendors pursue acquisitions to broaden portfolios and emerging firms introduce software-defined platforms that promise rapid protocol iteration and lower cost of ownership.
Key Report Takeaways
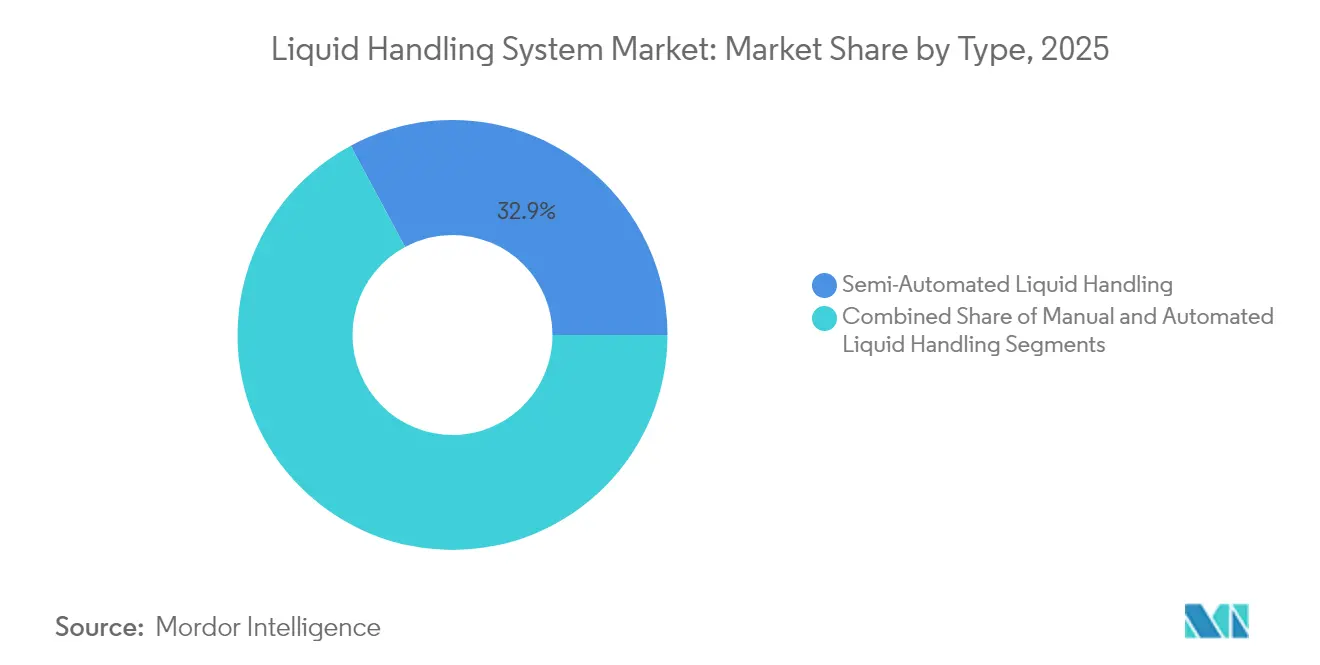
- By system type, semi-automated platforms held 32.85% of liquid handling system market share in 2025, whereas fully automated systems post the fastest 10.79% CAGR to 2031.
- By product category, automated workstations led with 29.10% revenue share in 2025; acoustic ejectors are slated to grow at a 10.21% CAGR through 2031.
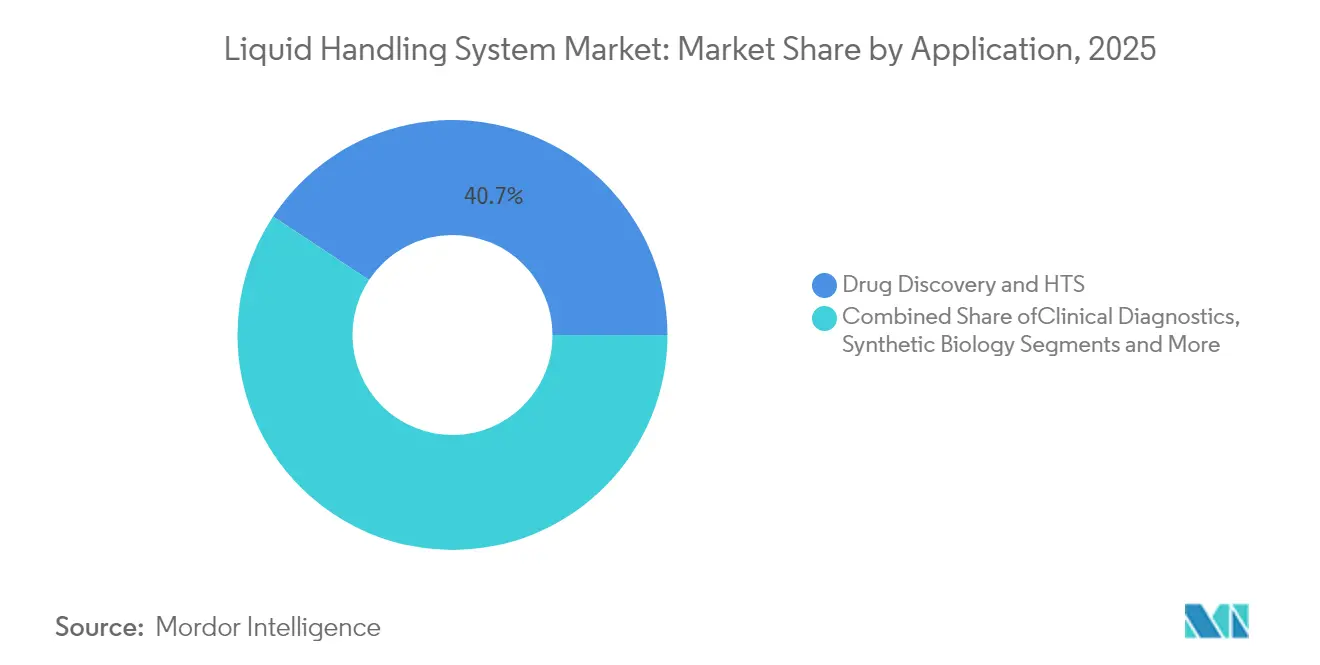
- By application, drug discovery and high-throughput screening commanded 40.72% share of the liquid handling system market size in 2025, while cell and gene therapy manufacturing rises at a 11.88% CAGR to 2031.
- By end user, pharmaceutical and biotechnology companies accounted for 43.88% of revenue in 2025, and contract research and manufacturing organizations expand fastest at 11.12% CAGR through 2031.
- By geography, North America dominated with 39.30% share in 2025; Asia-Pacific is the fastest-growing region, advancing at a 10.47% CAGR to 2031.
Note: Market size and forecast figures in this report are generated using Mordor Intelligence’s proprietary estimation framework, updated with the latest available data and insights as of 2026.
Global Liquid Handling System Market Trends and Insights
Drivers Impact Analysis*
| Driver | (~) % Impact on CAGR Forecast | Geographic Relevance | Impact Timeline |
|---|---|---|---|
| Rising Investment In Drug Development & Research | +1.8% | Global, with concentration in North America & Europe | Long term (≥ 4 years) |
| Growing Demand For High-Throughput Screening (HTS) | +1.5% | North America & APAC core, spill-over to Europe | Medium term (2-4 years) |
| Rapid Advances In Robotic & Acoustic Liquid Handling | +1.2% | Global, led by North America & Europe | Medium term (2-4 years) |
| Adoption Of Micro-Fluidic Nano-Dispensing Platforms | +0.9% | APAC core, North America & Europe | Long term (≥ 4 years) |
| Expansion Of Synthetic-Biology & Lab-On-Chip Start-Ups | +0.7% | North America & Europe, emerging in APAC | Long term (≥ 4 years) |
| Stringent IVD & LDT Regulations Mandate Traceable, Automated Workflows | +1.1% | North America, spill-over to Europe & APAC | Short term (≤ 2 years) |
| Source: Mordor Intelligence | |||
Rising Investment in Drug Development & Research
Pharmaceutical R&D spending has surpassed USD 200 billion annually, and a growing share of that outlay supports automated liquid handling to screen complex compound libraries. Oncology and rare-disease programs demand sub-microliter accuracy that manual pipetting cannot match, prompting labs to adopt robotic workstations that combine AI-guided scheduling with real-time volume verification. Agilent Technologies’ USD 925 million purchase of BIOVECTRA in 2024 highlights industry moves to secure integrated biologics production assets that depend on automated dispensing. As drug developers pursue compressed timelines, automated platforms that capture sample-level metadata now serve as compliance anchors for regulatory submissions. Investment momentum is therefore expected to sustain the liquid handling system market as firms race to shorten the traditional 10-15-year discovery-to-approval cycle.
Growing Demand for High-Throughput Screening (HTS)
Modern HTS platforms process more than 100,000 wells per day while maintaining nanoliter precision, a capability essential for data-hungry AI discovery engines. Acoustic ejection coupled with mass spectrometry has reduced peptide biomarker read times to 1.5 seconds, allowing epidemiology teams to analyze population-scale samples within days.[1]Bradshaw, David, “Acoustic Ejection Mass Spectrometry Empowers Ultra-Fast Protein Biomarker Quantification,” Nature Communications, nature.com Corning and similar suppliers are rolling out microplate formats optimized for contactless droplet handling so medium-sized labs can join large-scale programs without extensive infrastructure investments. Adoption of organoid and 3D cell models intensifies demand for sterile, automated media exchanges over multi-day protocols. As a result, the liquid handling system market is witnessing recurrent replacement cycles from conventional pipetting heads to acoustic nanospray modules across pharmaceutical and academic sites.
Rapid Advances in Robotic & Acoustic Liquid Handling
Collaborative arms paired with cloud-based schedulers now orchestrate pipetting, vial capping and barcode verification without operator intervention. Hamilton’s ZEUS X1 air-displacement technology self-adjusts for viscosity shifts, keeping CVs below 2% even with high-density reagents. Simultaneously, propriety acoustic devices guide nanoliter droplets through sound-wave modulation, eliminating cross-contamination while enabling miniaturized parallel assays. The University of North Carolina at Chapel Hill frames five levels of automation maturity, with AI-driven optimization marking the transition to fully autonomous labs—a trajectory underscored by ABB Robotics’ 2025 partnership with Agilent that merges analytical instruments with robotic sample prep.
Adoption of Micro-Fluidic Nano-Dispensing Platforms
3D-printed microchannels now deliver tens of thousands of uniform droplets per second, bringing single-cell omics within reach of routine workflows. In cell-therapy manufacturing, MEMS-based acoustic streaming embeds 60% of doxorubicin into lipid vesicles versus sub-30% yields via bulk loading, reducing material waste. Precision nano-dispensing also alleviates contamination concerns by curbing consumable exchanges, a critical benefit for decentralized diagnostic units. Surface acoustic wave mixers, acknowledged for biocompatibility, underpin on-chip PCR and nanoparticle synthesis, enabling cost-effective point-of-care diagnostics across resource-constrained regions.[2]Li, Qiang, “Multi-Scale Acoustic Streaming-Enabled Drug Loading in Lipid Vesicles,” MDPI, mdpi.com
Restraints Impact Analysis*
| Restraint | (~) % Impact on CAGR Forecast | Geographic Relevance | Impact Timeline |
|---|---|---|---|
| Shortage Of Skilled Automation Engineers | -1.3% | Global, acute in North America & Europe | Medium term (2-4 years) |
| High Capital Cost & Workflow Complexity | -1.1% | Global, particularly affecting smaller labs | Short term (≤ 2 years) |
| Cross-Contamination Risk In Acoustic Systems | -0.6% | Global, critical in clinical applications | Medium term (2-4 years) |
| Long Lead-Times For Precision Consumables | -0.8% | Global, supply chain concentration in APAC | Short term (≤ 2 years) |
| Source: Mordor Intelligence | |||
Shortage of Skilled Automation Engineers
Clinical and bioprocess labs report deficits in scientists trained to program, calibrate and maintain integrated robotic pipelines. The California Department of Public Health notes persistent vacancies for public-health microbiologists, a trend mirrored in European GMP facilities. Expertise now spans Python, supervisory control software and GMP documentation, stretching traditional curricula. Managers therefore invest in multi-year career development tracks and flexible scheduling, yet those incentives only partially staunch attrition, leaving expensive equipment under-utilized.[3]California Department of Public Health, “Laboratory Workforce Shortages in California,” cdph.ca.gov
High Capital Cost & Workflow Complexity
Fully integrated workstations often exceed USD 500,000 before validation, straining academic budgets and small biotech cash flows. Integration across arms, liquid handlers and informatics platforms mandates extensive workflow redesign and operator retraining, extending payback periods. Validation in regulated environments doubles both cost and timeline. Leasing and subscription models are emerging, but uptake remains tentative outside North America and Western Europe, tempering the liquid handling technology industry’s near-term growth.
*Our forecasts treat driver/restraint impacts as directional, not additive. The impact forecasts reflect baseline growth, mix effects, and variable interactions.
Segment Analysis
By Type: Automation Drives Market Evolution
Semi-automated systems captured 32.85% of 2025 revenue as laboratories balanced throughput with cost flexibility. Manual pipetting still anchors niche protocols demanding hands-on control, yet staff shortages and compliance pressures are accelerating transitions to fully automated rigs growing at 10.79% CAGR. Automated rigs integrate scheduling, deck analytics and remote diagnostics, delivering walk-away operation that mitigates ergonomic risk. The pivot supports laboratories striving to align with emerging LDT mandates and to optimize limited square footage. Robotic clusters that chain incubators, centrifuges and liquid handlers through unified control software illustrate how the liquid handling system market is recalibrating operating models. Acoustic nano-dispensers further elevate sterility standards, minimizing consumable swaps and reducing total assay cost in cell-therapy workflows. BD and Hamilton’s single-cell reagent collaboration exemplifies the push toward robotics-ready kits that shorten validation cycles and support laboratories modernizing under stricter regulations.
Fully automated workstations double as data hubs, capturing every aspirate and dispense in real time for audit-ready provenance. AI-enhanced error detection flags mis-calibrated channels before batch failure, preventing downstream rework. Progressive facilities now assign liquid handler scheduling to cloud services that balance resource loads across departments. As these capabilities proliferate, the liquid handling system market size for automated platforms is projected to widen its lead, while semi-automated lines migrate to teaching labs and low-volume specialty assays.


By Product: Workstations Lead Innovation Wave
Automated workstations dominated 2025 revenue at 29.10%, reflecting their role as backbone infrastructure for multi-step assays. Feature convergence—pipetting, gripper handling and real-time QC cameras—lowers the integration burden and accelerates protocol transfer from R&D to QC labs. Acoustic ejectors, climbing at 10.21% CAGR, answer growing calls for contactless, nanoliter dispensing that aligns with miniaturized omics. Over the same period, pipettes remain indispensable for quick turn tasks; Hamilton’s CO-RE II mechanism raises repeatability, which helps maintain a 92% recycling rate for tips in validated workflows.
Software modules have become decisive purchase criteria. Hamilton’s VENUS and Tecan’s Veya translate graph-based workflow design into machine code, enabling technicians without coding backgrounds to iterate assay designs. Modular stacks such as Formulatrix’s upcoming STACK line let customers add incubators or plate readers incrementally, easing budget approvals. These shifts underscore that the liquid handling system market size for software and integration components could outpace hardware within the forecast horizon as laboratories standardize on licensing and subscription models.
By Application: Therapeutics Drive Transformation
Drug discovery and HTS retained 40.72% share in 2025 thanks to escalating small-molecule and biologics pipelines that rely on nanoliter accuracy for hit confirmation. As multi-omics screens proliferate, HTS platforms now incorporate automated reagent preparation plumbing that adjusts buffers by algorithmic demand forecasts. Cell and gene therapy manufacturing, expanding at 11.88% CAGR, demands closed-system liquid handlers certified for GMP class A operations to maintain sterility across viral-vector transfections. The liquid handling system market share for cell-therapy-specific modules is thus rising rapidly alongside regulatory scrutiny over traceability.
Genomics and proteomics laboratories capitalize on miniaturized parallel bioreactors that complete RNA-Seq prep in sub-microliter volumes, cutting reagent spend 70%. Clinical diagnostics is modernizing into “dark labs” where robotics manage around-the-clock workflows, contributing to lower turnaround times amid staffing shortages. Synthetic biology teams use integrated robots to print DNA coding variants overnight, compressing design-build-test cycles. Collectively, these dynamics reinforce the liquid handling technology industry’s diversification across therapeutic and analytical functions.
By End User: Outsourcing Reshapes Dynamics
Pharmaceutical and biotechnology enterprises contributed 43.88% of 2025 revenue, drawn by regulatory compliance needs and the pursuit of multi-year R&D efficiencies. Running parallel high-throughput screens demands continuous uptime that manual processes cannot sustain. Contract research and manufacturing organizations, expanding at 11.12% CAGR, absorb outsourced discovery and clinical trial prep loads, pushing them to scale automated capacity quickly.
Academic institutes accelerate adoption via core facilities that split capital load across departments, while diagnostic labs migrate to traceable automation in anticipation of global LDT frameworks. Shared-use automation hubs enable small start-ups to rent hourly access, spreading the liquid handling system market across a wider user base. Waters’ Global Capability Center in Bangalore typifies vendor-backed competency clusters that pair training with support, mitigating the skills gap restraint.
Geography Analysis
North America commanded 39.30% of 2025 sales underpinned by extensive pharma pipelines, early automation uptake and FDA policies that favor traceable workflows. Venture financing for synthetic biology plus corporate consolidation—such as Thermo Fisher’s USD 4.1 billion filtration deal—fuels ongoing platform upgrades. Europe follows closely, leveraging public-private funding for automation to offset skilled-labor shortages and to align with forthcoming IVDR adjustments. Sustainability targets also steer European buyers toward workstations that minimize plastic consumption and energy draw.
Asia-Pacific posts the fastest trajectory at 10.47% CAGR through 2031. China’s biomanufacturing build-out and India’s growing CDMO footprint lift baseline demand, while Japanese labs implement acoustic systems to automate organoid assays. Government grants and foreign joint ventures, such as SPT Labtech’s structural-biology collaboration in China, accelerate knowledge transfer.
Middle East & Africa and South America remains nascent yet promising as national health programs expand diagnostics capacity. Modular, cloud-managed liquid handlers appeal where budgets limit turnkey deployments. Vendors that bundle remote support with subscription pricing are positioned to cultivate long-term footholds across these emerging zones.

Regulatory Landscape
Regulation for liquid handling systems spans medical-device and laboratory-quality frameworks, with requirements shaped by intended use (research versus clinical). In the United States, many clinical-use pipetting and diluting systems are classified under FDA 21 CFR 862.2750 and are commonly Class I, often exempt from 510(k), while still falling under general controls and postmarket expectations related to safety and contamination control. A key compliance anchor for manufacturers is FDA's Quality Management System Regulation (QMSR), which incorporates ISO 13485:2016 by reference and is effective in early 2026, increasing the emphasis on design controls, software validation, and traceable quality documentation for regulated deployments.
Internationally, performance and metrology expectations increasingly cite ISO 23783 (Parts 1-3) for vocabulary, general requirements, and volumetric performance measurement of automated liquid handling systems, supporting more standardized performance reporting across markets. In Europe, classification and conformity pathways depend on intended purpose and risk under the EU Medical Device Regulation (MDR) and In Vitro Diagnostic Regulation (IVDR), with guidance such as MDCG 2021-24 informing borderline and classification interpretations. This raises the need for audit-ready traceability in clinical and diagnostic labs, and laboratory safety requirements also influence equipment design. For example, UK Health and Safety Executive guidance on safe working in clinical laboratories reinforces controls such as splash protection and infection-control features for automated workflows.
Value Chain Analysis
The value chain starts with precision components and raw materials, including polymers for tips and reservoirs, machined metals, sensors, and embedded electronics, then moves through instrument design, software development, assembly, and validation. After that, the chain extends into distribution, integration, and lifecycle services such as qualification, calibration, preventive maintenance, and workflow updates. Consumables and validated methods support recurring revenue and user lock-in, while software and integration modules increasingly function as the control plane that connects liquid handlers with upstream sample tracking and downstream analytics. Recent ecosystem moves reflect this bundling direction, including MilliporeSigma (Merck KGaA) partnering with Opentrons in January 2025 to automate assay kits on Opentrons Flex workstations (with ordering beginning mid-2025), and Copia Scientific signing a strategic distribution agreement with Opentrons in March 2025 to expand access to automation plus integration services.
Manufacturing scale-up and logistics resiliency remain key for supply assurance, particularly for precision consumables where lead-time volatility is a recurring issue. Thermo Fisher Scientific opened a 375,000-square-foot carbon-neutral pipette-tip manufacturing site in Mebane, North Carolina in August 2025, citing capacity of 40 million tips per week (supported by a 2021 federal contract). This localization is aimed at reducing reliance on overseas supply and responding faster to demand swings. Bottlenecks persist around polymer feedstock and metals, and 2025 cost volatility tied to tariffs, notably steel and aluminum adjustments, is pressuring margins and delivery consistency. On the compliance services layer, partnerships such as Hamilton with Platomics (PlatoX) connect instrument platforms to regulatory documentation workflows, helping EU clinical users address IVDR documentation and traceability requirements.
Competitive Landscape
Industry concentration is moderate as diversified giants buy specialist assets while start-ups introduce disruptive models. Thermo Fisher’s USD 4.1 billion filtration acquisition extends its bioproduction reach and cross-sells consumables into installed bases. ABB Robotics’ tie-up with Agilent showcases hardware-software synergy aimed at next-generation autonomous labs. Market incumbents race to embed AI for predictive maintenance; Revvity’s error-state detection patent illustrates data-centric differentiation.
Synthetic-biology entrants like Opentrons and Trilobio lower entry thresholds via open-source or plug-and-play rigs, applying downward price pressure. Vendors that pre-bundle regulatory documentation secure preference among clinical adopters facing LDT deadlines. Portfolio breadth, integration simplicity and compliance-ready software emerge as differentiators in the liquid handling system market, shaping a landscape where scale alone no longer assures dominance.
Liquid Handling System Industry Leaders
Agilent Technologies
Thermo Fisher Scientific Inc.
Danaher
Hamilton Company
Waters
- *Disclaimer: Major Players sorted in no particular order

Market Opportunities and Future Outlook
Opportunities are strongest where labs are modernizing workflows for higher throughput, stronger data integrity, and reduced operator dependency. That shift is pushing demand beyond stand-alone liquid handlers toward software-orchestrated automation and compliant digital execution. Agilent's May 2026 introduction of OpenLab Sync, positioned to streamline instrument integration and regulated workflow execution, underscores the move toward unified platforms that support traceable, audit-ready operations across multi-instrument environments. For vendors, this creates room to package liquid handling hardware with validated methods, electronic records support, and integration into broader lab informatics stacks, particularly for pharmaceutical QC and clinical labs managing tighter traceability expectations.
There is also room for specialized, workflow-specific automation and ultra-low-volume dispensing that reduces reagent spend and supports miniaturized assays in discovery, genomics, and emerging modalities. Analytik Jena launched the PULSEspencer Series in April 2026 as a digital, contact-free dispenser series for ultra-low volume dispensing and automated sample preparation, and Unchained Labs launched Lil' Tuna in July 2026 as a fully automated, plate-based buffer exchange system designed to integrate with its Stuntman automation platform, extending automation into preparation steps that often remain manual. On the supply side, capacity additions in adjacent inputs that feed automated workflows improve end-to-end readiness. Cytiva completed a Logan, Utah expansion in June 2026 that doubles liquid media production capacity and supports batch sizes up to 13,000 liters, reinforcing availability of critical reagents commonly paired with automated liquid handling in bioprocess and translational lab settings.
Recent Industry Developments
- May 2026: Agilent Technologies introduced OpenLab Sync, an AI-enabled software platform aimed at streamlining instrument integration, workflow configuration, and digital execution for regulated laboratory environments. The launch strengthens Agilent's position in software-led lab automation, where liquid handling workstations operate as part of connected, compliance-driven workflows rather than standalone assets.
- December 2025: Beckman Coulter Life Sciences (Danaher) released the Biomek i3 Benchtop Liquid Handler to broaden access to automated liquid handling in smaller-footprint lab settings. Expanding the benchtop automation tier supports wider adoption across mid-size labs and core facilities that need standardized protocols without the cost and complexity of larger integrated systems.
- June 2024: Thermo Fisher Scientific introduced the KingFisher PlasmidPro Maxi Processor, positioned as a fully automated maxi-scale plasmid DNA purification system that eliminates manual column preparation. By automating a high-workload sample preparation step, the system supports faster, more reproducible plasmid workflows aligned with rising throughput needs in genomics and therapy development pipelines.


Research Methodology Framework and Report Scope
Market Definition and Coverage
This market covers instruments and systems used to aspirate, dispense, and transfer liquids in controlled volumes (typically microliters to milliliters) across lab workflows, from sample prep to assay setup, in research and clinical settings.
Scope exclusions: Stand-alone detection instruments without integrated liquid dispensing or transfer capability are not counted in this market sizing.
Segmentation Overview
- By Type
- Manual Liquid Handling
- Air-displacement pipettes
- Positive-displacement pipettes
- Semi-Automated Liquid Handling
- Automated Liquid Handling
- Robotic workstations
- Acoustic droplet ejectors
- Contactless nano-dispensers
- Manual Liquid Handling
- By Product
- Automated Workstations
- Pipettes
- Single-channel
- Multi-channel
- Dispensers
- Burettes & Dilutors
- Consumables (tips, plates, reservoirs)
- Software & Integration Modules
- By Application
- Drug Discovery & HTS
- Genomics & Proteomics
- Clinical Diagnostics
- Cell & Gene Therapy Manufacturing
- Synthetic Biology
- Other Applications
- By End User
- Pharmaceutical & Biotechnology Companies
- Contract Research & Manufacturing Organizations
- Academic & Research Institutes
- Clinical & Diagnostic Laboratories
- Core Facilities & Service Providers
- By Geography
- North America
- United States
- Canada
- Mexico
- Europe
- Germany
- United Kingdom
- France
- Italy
- Spain
- Rest of Europe
- Asia-Pacific
- China
- Japan
- India
- Australia
- South Korea
- Rest of Asia-Pacific
- Middle East and Africa
- GCC
- South Africa
- Rest of Middle East and Africa
- South America
- Brazil
- Argentina
- Rest of South America
- North America
Data Sources, Market Sizing, and Validation
Desk Research
Desk research was used to set the fact base for demand drivers, lab activity levels, and spending context that influence liquid handling purchases. We referred to public sources such as the US Food and Drug Administration (device and lab compliance references), the US Patent and Trademark Office (innovation and filing activity), the World Bank and OECD (R&D and macro indicators), and WHO and CDC publications (testing and lab workload signals).
On the supply side, annual reports, investor presentations, and product documentation helped map what is sold as a liquid handling system versus what sits in adjacent equipment categories. In addition, a paid subscription for company financials and a patent database was used selectively to standardize company revenue splits and cross-check technology trends. The sources listed here are illustrative, and we reviewed many other public and paid references to support data collection, cross-verification, and clarification.
Primary Interviews and Surveys
Primary work focused on validating adoption patterns for manual versus automated liquid handling, typical replacement cycles, and where buyers draw the line between liquid handling systems and broader lab automation. We spoke with manufacturers, channel participants, and end users across pharma and biotech labs, clinical diagnostics laboratories, and academic or research institutes, and then used that input to pressure-test assumptions for each region before finalizing the model.
Distribution of primary research fieldwork respondents
| Company type | Respondent position | Region |
|---|---|---|
| Top tier: 37% | CXOs: 14% | APAC: 40% |
| Mid tier: 42% | Functional/Unit leaders: 42% | EMEA: 33% |
| Smaller Players: 21% | Managers: 44% | Americas: 27% |
Market-Sizing & Forecasting
The core model uses a top-down approach: R&D intensity and lab testing activity are translated into an addressable equipment demand pool, then reconstructed by region and converted into annual spending using typical system pricing bands. To keep totals practical, we corroborate the outputs with selective bottom-up approximations, including sampled supplier revenue splits, channel checks, and volume times ASP sanity checks for major end-user groups.
Key inputs used in the sizing include R&D spending trends, growth in biopharma and biotech lab throughput, automation penetration in routine workflows, replacement and service life assumptions for key instruments, and observed mix shifts between manual, electronic, semi-automated, and fully automated setups. Where bottom-up signals were incomplete, we filled gaps using region-specific adoption ratios from interviews and then adjusted for the local lab footprint.
For forecasting, we run scenario analysis so differences in funding climate, lab automation uptake, and clinical testing volumes can be reflected without forcing a single straight-line outcome. Short-term swings are reviewed with experts and applied as directional adjustments to the input variables, which then feed into the final market values.
Data Validation & Update Cycle
Validation is done through multiple checks so the final number aligns with real-world signals. We compare modeled results with independent indicators such as R&D spend direction, regional lab expansion signals, and observed procurement behavior, then rework assumptions if variances are large until the drivers remain explainable.
Before sign-off, the work goes through internal peer review where drivers, unit logic, and currency treatment are challenged. If outliers appear, we trigger a re-contact with selected interviewees. The report is refreshed annually, with interim updates when a material event changes demand or pricing assumptions. A final pass is completed right before delivery so clients receive the latest updated view.
Mordor Intelligence's Liquid Handling System Market Size Versus Other Published Estimates
Published market sizes for liquid handling systems can vary even when the topic name looks identical, because the included equipment list and the year used as the starting point are not always aligned. Differences also come from how manual and electronic tools are treated versus automation platforms, and from whether pricing is assumed to move with mix or with inflation.
In this study, the main spread is usually explained by whether adjacent lab automation items are counted, and whether stand-alone detection tools are treated as part of liquid handling, a scope choice that is kept tight here and applied consistently through the model before the estimate is finalized by Mordor Intelligence.
Benchmark comparison
| Source | Market Size | Gaps in Research Methodology |
|---|---|---|
| Mordor Intelligence | USD 5.90 B (2026) | |
| Global Consultancy A | USD 4.91 B (2025) | Uses an earlier base year and may apply a broader product framing tied mainly to pharma and biotech research, which can change the implied adoption rates and price mix versus a workflow-wide lab view. |
| Industry Publisher B | USD 5.14 B (2025) | Starts from a 2025 base and appears to include a wider bundle (including consumables and multiple handling methods), which can lift the total when bundled revenue is counted alongside instrument systems. |
Looking across the three figures, most of the difference can be traced to base-year choice and to whether the market is defined as instruments only or as a broader bundle that can include adjacent items. By keeping the scope rules explicit and then checking the outputs against adoption and pricing signals from primary feedback, the final number stays traceable to simple drivers and repeatable steps that buyers can audit.


Key Questions Answered in the Report
What is the current size of the liquid handling system market?
The liquid handling system market is valued at USD 5.9 billion in 2026, with projections placing it at USD 8.68 billion by 2031.
Which system type is growing fastest within the liquid handling system market?
Fully automated liquid handling systems register the fastest growth at an 10.79% CAGR through 2031 as labs seek walk-away workflows.
Why is Asia-Pacific the fastest-growing region?
Large-scale pharmaceutical manufacturing expansions, rising R&D investment and supportive government initiatives propel Asia-Pacific to a 10.47% CAGR.
How are regulations shaping market demand?
The FDA’s Laboratory Developed Tests Final Rule mandates traceable automated workflows, prompting U.S. and global labs to accelerate purchases of compliant liquid handling platforms.
Which product segment commands the largest share?
Automated workstations hold the leading 29.10% share, reflecting their ability to consolidate pipetting, handling and QC functions on a single deck.
Page last updated on:


