Market Overview
| Study Period | 2020 - 2031 |
|---|---|
| Forecast Data Period | 2026 - 2031 |
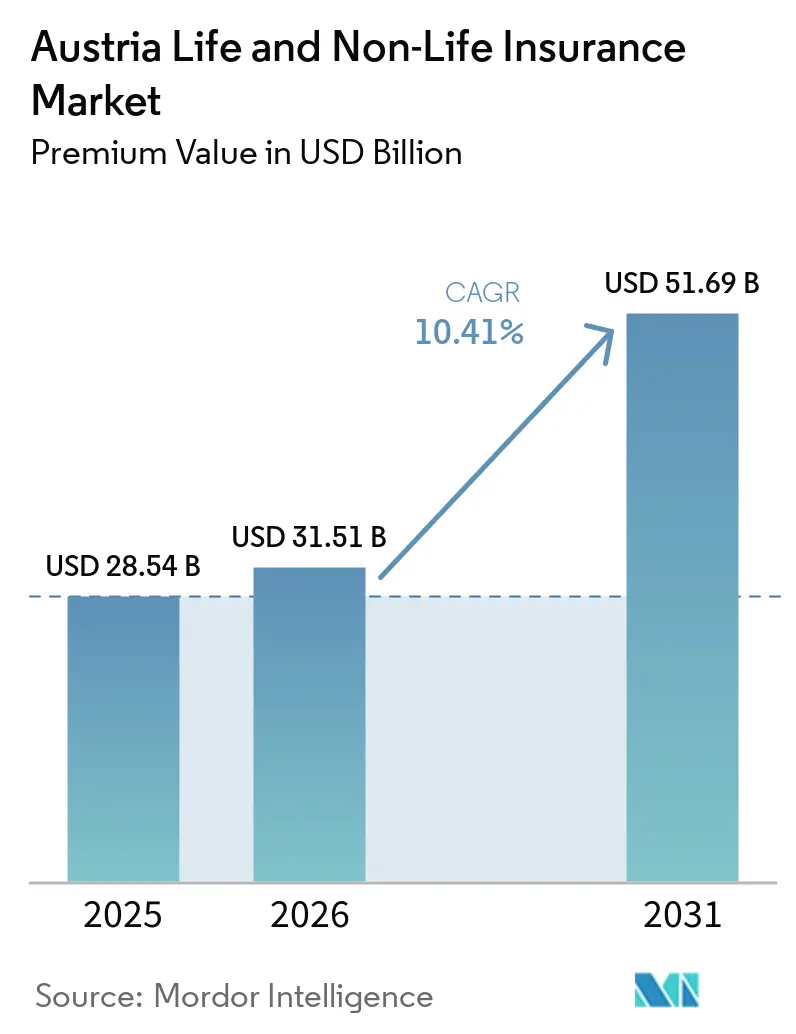
| Base Year Market Size (2025) | USD 28.54 Billion |
| Market Size (2026) | USD 31.51 Billion |
| Market Size (2031) | USD 51.69 Billion |
| Growth Rate (2026 - 2031) | 10.41% CAGR |
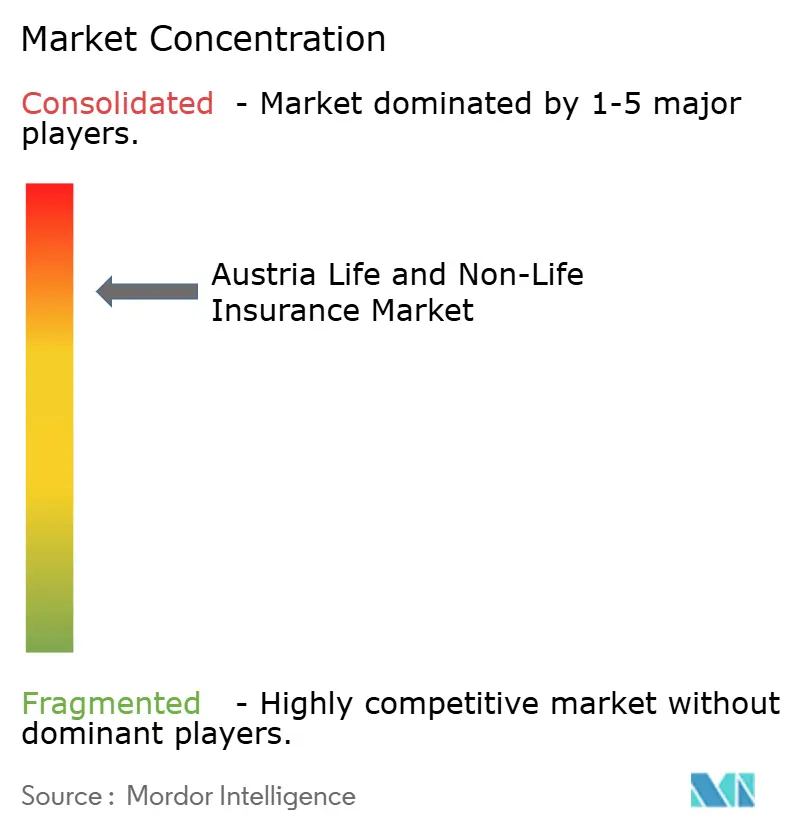
| Market Concentration | High |
Major Players *Disclaimer: Major Players sorted in no particular order Image © Mordor Intelligence. Reuse requires attribution under CC BY 4.0. | |
Austria Life and Non-Life Insurance Market Analysis by Mordor Intelligence
The Austria Life And Non-Life Insurance Market size in terms of premium value is expected to increase from USD 28.54 billion in 2025 to USD 31.51 billion in 2026 and reach USD 51.69 billion by 2031, growing at a CAGR of 10.41% over 2026-2031.
Austria's life and non-life insurance market is on a steady growth trajectory. This growth is fueled by a heightened awareness of cyber threats, increasing climate-related property losses, and rising concerns over retirement income gaps. The Financial Market Authority (FMA) exercises stringent solvency oversight, ensuring the sector boasts a robust average solvency ratio of 261%. This not only bolsters investor trust but also strengthens underwriting capabilities. The market enjoys a symbiotic relationship between banks and insurers, bolstered by the widespread adoption of digital banking and tax incentives for unit-linked life products. These factors collectively broaden access and amplify uptake. Concurrently, as climate stress-testing mandates become more prevalent, there's a surge in demand for sophisticated risk pricing tools. While insurers grapple with profitability pressures from persistently low yields and climate-induced claim fluctuations, many are turning to AI for claims processing and refining their climate-risk analytics to maintain a competitive edge.
Key Report Takeaways
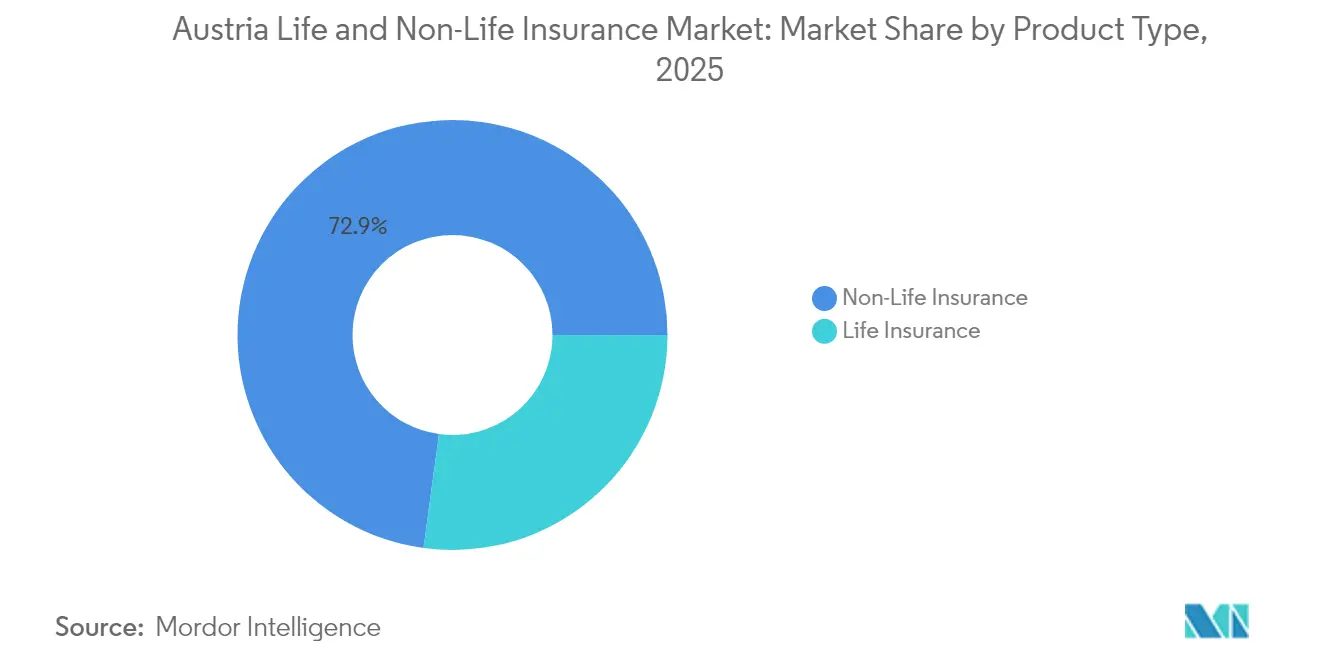
- By product type, non-life insurance led with 72.85% of the Austria insurance market share in 2025, while annuities and pension products are forecast to expand at a 5.72% CAGR through 2031.
- By distribution channel, independent brokers held 36.65% share of the Austria insurance market size in 2025; direct online channels are advancing at 9.22% CAGR to 2031.
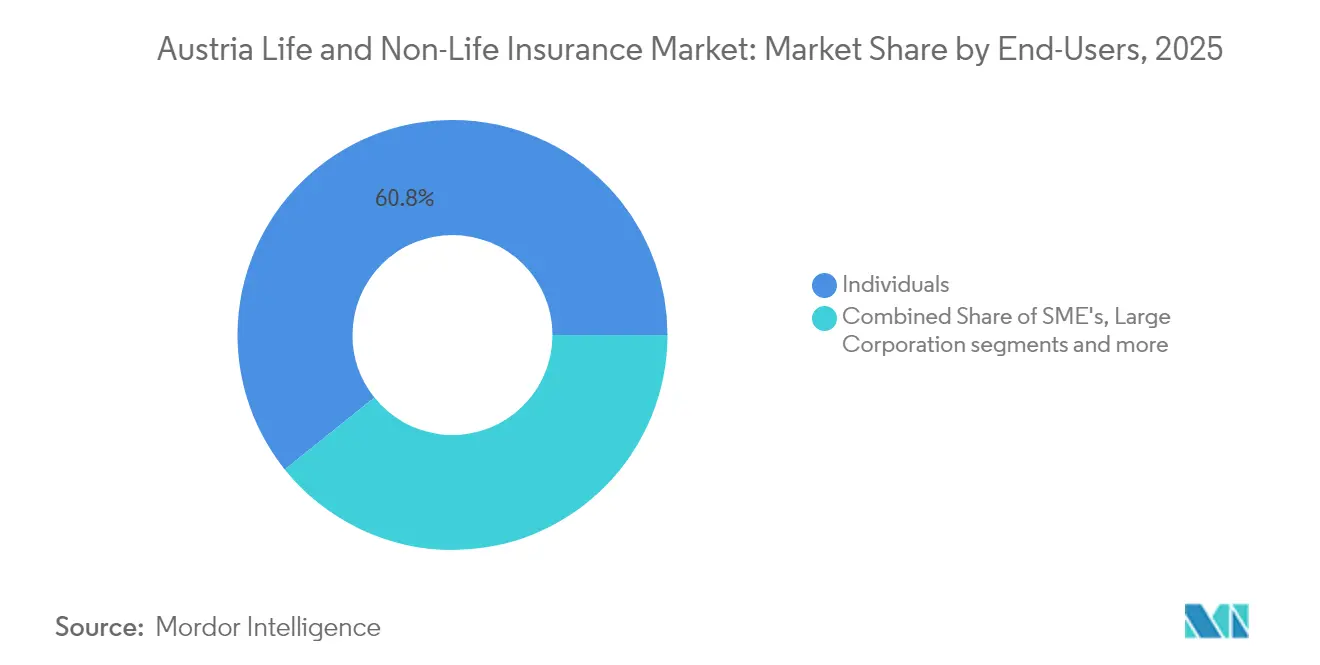
- By end-user, individuals accounted for 60.75% of premiums in 2025, whereas SMEs posted the fastest CAGR of 7.11% to 2031.
- By premium type, regular premiums dominated with an 79.85% share in 2025; single-premium contracts are set to grow at a 4.07% CAGR.
- By geography, Vienna commanded a 33.12% share in 2025; Tyrol is the fastest-growing province at 5.93% CAGR.
Note: Market size and forecast figures in this report are generated using Mordor Intelligence’s proprietary estimation framework, updated with the latest available data and insights as of 2026.
Austria Life and Non-Life Insurance Market Trends and Insights
Drivers Impact Analysis*
| Driver | (~) % Impact on CAGR Forecast | Geographic Relevance | Impact Timeline |
|---|---|---|---|
| Rising pension gap from rapid population ageing | +2.1% | National, concentrated in Vienna and Lower Austria | Long term (≥ 4 years) |
| Surge in Alpine hail, flood & avalanche events | +1.8% | Alpine regions: Tyrol, Salzburg, Vorarlberg, Styria | Medium term (2-4 years) |
| EU-wide GDPR enforcement & SME cyber-risk awareness | +1.6% | National, concentrated in business centers | Short term (≤ 2 years) |
| Government tax incentives for unit-linked & index-linked policies | +1.4% | National, higher uptake in Vienna and Upper Austria | Short term (≤ 2 years) |
| High digital-banking penetration | +1.2% | Urban centers: Vienna, Graz, Linz, Salzburg | Medium term (2-4 years) |
| Expansion of e-mobility fleet driving motor third-party & hull premiums | +0.9% | National, early adoption in Vienna and western provinces | Medium term (2-4 years) |
| Source: Mordor Intelligence | |||
Rising pension gap from population ageing
In 2022, 34.7% of Austria's population was aged 55 and older, a figure projected to climb to 41.2% by 2050. This demographic shift is widening the chasm between statutory pensions and what constitutes an adequate retirement income. As a result, there's a burgeoning demand for private life and annuity products. Starting January 2024, policy reforms such as enhanced deferral incentives and lowered payroll taxes on partial retirement income are nudging households to bolster public benefits with private savings. While public pension spending accounts for 13% of GDP, it only covers 48% of the average net income. This shortfall has propelled annuities to become the fastest-growing segment in life insurance, driving long-term premium growth in Austria's insurance market.
Alpine hail, flood & avalanche events elevating household & agricultural cover
In Austria, household, property, and agricultural insurance demand is surging, spurred by increasingly severe Alpine weather events. Notably, the 2024 supercell storms caused damages ranging from USD 22 to 25 million over an expanse of 66,000 hectares. In response to these climate-related challenges, insurers are not only raising policy prices but also turning to parametric solutions for quicker claims settlements. Additionally, regulatory climate stress tests, mandated by the Financial Market Authority (FMA), have unveiled coverage gaps. This revelation has led to a heightened uptake of policies and increased insured sums. As a result of these climate-driven changes, non-life premium growth is on the rise, bolstering the overall expansion of Austria's insurance market.
Government tax incentives for unit-linked & index-linked policies
In Austria, government tax incentives are making unit-linked and index-linked insurance products more appealing than direct investments, spurring growth in both life and non-life insurance markets. In 2023, unit-linked policies rebounded with a median net return of 9%, restoring losses from the prior year and bolstering consumer confidence[1]European Insurance and Occupational Pensions Authority, “Consumer Trends Report 2024,” eiopa.europa.eu. A pivotal ruling from the European Court of Justice on withholding-tax refunds now empowers foreign insurers to lower product costs, enhancing their pricing competitiveness. Furthermore, Austria's unprecedented national R&D spending is catalyzing the rise of fintech-based advisory tools, simplifying the transition of household savings into life insurance. Collectively, these dynamics are broadening the market and solidifying long-term premium growth.
High digital-banking penetration accelerating direct & bancassurance sale
Austria's robust digital banking landscape is not only propelling the growth of direct insurance sales but also bolstering the bancassurance sector, leading to a surge in both life and non-life insurance markets. Daily spending sees card transactions at 39% and online payments at 21%, prompting banks and insurers to harness these digital avenues for integrated coverage offerings[2]European Central Bank, “Study on the Payment Attitudes of Consumers in the Euro Area (SPACE) 2024,” ecb.europa.eu. In 2023, banks achieved a notable 15.7% return on equity, with many embedding insurance products directly into their mobile applications. At the same time, insurers are tapping into AI-driven chatbots and real-time quote engines, resulting in a significant uptick in online premium growth. This digital synergy is not just enhancing customer interactions but also amplifying premium density and fortifying the market's overall momentum.
Restraints Impact Analysis*
| Restraint | (~) % Impact on CAGR Forecast | Geographic Relevance | Impact Timeline |
|---|---|---|---|
| Eurozone low-yield environment undermining guaranteed life-product profitability | −1.9% | National, affecting all life insurers | Long term (≥ 4 years) |
| High market saturation & price competition | −1.3% | National, intensified in Vienna and urban centers | Medium term (2-4 years) |
| Solvency II capital & reporting burden raising compliance costs for mid-sized insurers | −0.8% | National, disproportionately affecting smaller insurers | Long term (≥ 4 years) |
| Inflation-driven consumer shift toward higher deductibles and self-insurance for minor risks | −0.6% | National, more pronounced in rural areas | Short term (≤ 2 years) |
| Source: Mordor Intelligence | |||
Eurozone low-yield environment undermining guaranteed life products profitability
Austria's life and non-life insurance market grapples with challenges stemming from the Eurozone's enduring low-yield climate. This environment has been steadily diminishing the profitability of guaranteed life products. Despite recent hikes in policy rates, returns from fixed-income investments still lag behind the legacy guarantee levels found in numerous life contracts. This shortfall is limiting potential investment income. Responding to these challenges, the IMF has advocated for stricter asset-liability matching[3]International Monetary Fund, “Austria Article IV Consultation Report 2024,” imf.org. This recommendation has not only escalated hedging costs but also led insurers to curtail the issuance of new guaranteed policies. Consequently, there's a noticeable dip in demand for traditional endowment products, and growth in the life insurance sector is experiencing a slowdown.
High market saturation and price competition compressing non-life margins
Austria's life and non-life insurance market grapples with saturation and fierce price competition, especially in the non-life segment. Five major players dominate, accounting for around 80% of non-life premiums. This concentration fosters an oligopolistic environment where aggressive pricing erodes margins. In 2024, leading insurers like VIG and UNIQA faced weather-driven claims, pushing their combined ratios above 93% and highlighting the financial strain. Despite firms pouring investments into automation and predictive analytics for efficiency gains, persistently low pricing in key areas, notably motor and household insurance, continues to dampen overall market profitability.
*Our forecasts treat driver/restraint impacts as directional, not additive. The impact forecasts reflect baseline growth, mix effects, and variable interactions.
Segment Analysis
By Product Type: Non-life primacy underpins premium pool
Non-life lines generated 72.85% of total premiums in 2025, affirming the Austria insurance market’s reliance on mandatory motor covers and climate-exposed property risks. Motor’s 31.8% slice benefits from vehicle-registration enforcement and growing e-mobility fleets. Alpine hail and flood losses push property-rate hardening and expand insured sums, while liability, accident, and travel segments keep steady contributions. The annuity and pension sub-line, at a 5.72% CAGR, is the life-segment pacesetter as ageing accelerates. Whole-life and endowment contracts lag because guaranteed-rate drag erodes relative returns. New unit-linked products leverage tax benefits and digital advisory tools to win savers switching from bank deposits.
Looking forward, the Austria insurance market size for non-life is expected to widen in absolute terms even as life growth accelerates, sustaining a diversified premium mix. Increasing climate-linked payouts fuel parametric and micro-coverage innovation. Meanwhile, ESG-aligned investment guidelines shift insurer portfolios toward green bonds, nudging product design toward sustainability-linked features that resonate with younger policyholders.


By Distribution Channel: Advisory strength meets digital speed
Brokers controlled 36.65% of gross written premiums in 2025, retaining the trust of complex commercial and high-net-worth clients who demand tailored coverage. Despite their lead, bank partners exploit high digital-banking adoption to embed insurance offers, lifting bancassurance revenues. Direct online channels, the fastest-growing at 9.22% CAGR, capitalise on price transparency and instant-policy issuance, penetrating standardized lines such as motor, travel and gadget cover. Aggregators and embedded-insurance APIs widen reach into e-commerce and mobility apps.
Intensive digital investment by incumbents supports omnichannel strategies that blend broker advice with self-service portals. As a result, the Austria insurance market size for direct channels will likely double over the forecast window, capturing incremental growth especially among digitally native consumers. Traditional brokers respond by deploying robo-advisor tools and data-driven renewal alerts to preserve retention.
By End-User: Household dominance with SME white-space
Individuals contributed 60.75% of premiums in 2025, reflecting high personal-line penetration and pension-gap awareness. Mandatory motor and widely held homeowners policies sustain base revenue, while demographic ageing propels demand for annuities and long-term care covers. Cyber and identity-theft products gain traction among digitally active households.
SMEs, although smaller, are the fastest-expanding cohort at 7.11% CAGR. Only one-third carry cyber-risk protection despite a surge in data-breach incidents, signaling untapped potential. EU recovery funds earmarked for SME digitalization funnel resources into risk-mitigation spending, enlarging opportunity for insurers. Large corporates preserve stable share through complex programs and captive structures, but incremental growth lies in closing SME protection gaps across the Austria insurance market.
By Premium Type: Recurring cash-flow stability vs lump-sum opportunity
Regular-pay contracts accounted for 79.85% of premiums in 2025, providing insurers with predictable cash flows and supporting solvency ratio resilience. Automated payroll deductions and subscription-style billing curb lapse rates. Single-premium contracts, though holding just a 20.15% share, are gaining at 4.07% CAGR as retirees convert severance pay and savings into lump-sum annuities.
Higher interest rates, albeit still low, increase the attractiveness of immediate annuity payouts, and wealth-transfer planning fuels single-premium life demand among affluent households. For insurers, growing lump-sum volumes improve new-business margins and enlarge investible assets, balancing cash-flow profiles within the Austria insurance market.
Geography Analysis
Vienna owned 33.12% of Austria insurance market premiums in 2025 and remains the sector’s anchor thanks to its concentration of multinational headquarters, embassies, and high-net-worth residents. Dense commercial property values and elevated per-capita incomes underpin sizeable motor, homeowners, cyber, and financial lines books. The city’s leading role in Central and Eastern Europe (CEE) finance channels cross-border insurance placements through Vienna-based captives and fronting arrangements. Public-sector digital-health initiatives showcase Vienna’s capacity to pilot tech-enabled insurance solutions and inspire policy innovation nationwide.
Tyrol is forecast to post the fastest provincial expansion at 5.93% CAGR to 2031. Tourism-centric infrastructure, avalanche and flood exposures, and the climate-risk repricing of ski-area assets translate into rising property and business-interruption premiums. The province also benefits from eco-mobility investments that create new motor-fleet and liability covers. Neighboring Salzburg mirrors Tyrol’s tourism mixes but combines it with cultural heritage insurance demand that protects high-value historic sites.
Lower Austria and Upper Austria combine industrial clout with agriculture and automotive supply chains. Upper Austria houses large manufacturing plants whose supply-chain insurance needs contribute to steady commercial-line growth. Styria’s automotive cluster and research universities foster advanced-manufacturing risks requiring bespoke insurance solutions, while Vorarlberg and Carinthia face heightened storm-loss volatility that lifts property-cover take-up. Burgenland’s wind-power boom spawns' specialist renewable energy insurance segments. Collectively, regional diversity ensures that the Austria insurance market maintains a balanced mix of urban corporate risks and Alpine climate exposures, spreading growth catalysts beyond the capital.
Competitive Landscape
The Austria insurance market is concentrated around five groups. Vienna Insurance Group (VIG) heads the pack in both life and non-life insurance segments, sustaining a 261% solvency ratio and operating across 30 CEE markets. UNIQA ranks second with a 265% solvency coverage, focusing on omnichannel digital sales and selective CEE expansion. Generali Austria, leveraging group-wide data analytics to sharpen risk selection. Allianz and ERGO round out the top five, each modernizing claims handling through machine-learning tools.
Strategic moves illustrate an arms race in technology and sustainability. VIG scaled its in-house AI fraud detection engine in 2024, cutting average claims handling time by 18%. UNIQA’s “3.0 Growing Impact” roadmap earmarks USD 650 million through 2028 for digital core-system renewal and green-bond investments. ERGO Austria shifted toward direct digital recruitment to lessen bancassurance dependence and launched modular micro-covers embedded in e-commerce check-outs. Allianz introduced climate-resilience endorsements for property policies in high-risk Alpine zones, pairing premium incentives with mitigation-advice apps.
Cyber insurance is the chief whitespace. Only one-third of companies carry coverage, yet cyber incidents surpassed 60,000 in 2022. VIG partnered with a European cyber-MGA to accelerate underwriting expertise, while UNIQA invested in a Vienna-based cyber-security start-up to bundle risk-prevention services with policies. All major groups comply with FMA’s ESG and climate-risk guidelines, integrating scenario analysis into reserving and capital-allocation decisions that shape competitive differentiation in the Austria insurance market.
Austria Life and Non-Life Insurance Industry Leaders
Vienna insurance Group
UNIQA Insurance Group AG
Allianz Österreich
Generali Versicherung AG
Grazer Wechselseitige Versicherung (GRAWE)
- *Disclaimer: Major Players sorted in no particular order

Recent Industry Developments
- April 2025: Government ended MVSt tax exemption on electric vehicles, introducing annual power-output-linked taxes that may temper e-mobility-driven motor-premium growth.
- January 2025: Financial Market Authority implemented updated EU insurance-consumer-protection rules, tightening product governance and disclosure requirements.
- December 2024: UNIQA released a strategic plan, “UNIQA 3.0 Growing Impact 2025-2028,” emphasizing digital and ESG investment.
- August 2024: National Research & Technology Report confirmed record USD 17.6 billion R&D spend (3.34% of GDP), fueling insurtech innovation.


Research Methodology Framework and Report Scope
Market Definitions and Key Coverage
According to Mordor Intelligence, the Austrian life & non-life insurance market comprises all written premiums for life policies (term, whole, unit-linked, annuity and group contracts) and non-life lines (motor, property, liability, accident/health riders, marine, aviation, transit, credit, cyber and travel) collected by licensed insurers operating in Austria, regardless of distribution channel. Policies issued by foreign branches but booked onshore are included, while purely reinsurance transactions are excluded.
Scope exclusion: reinsurance premiums are not in scope.
Segmentation Overview
- By Product Type
- Life Insurance
- Term Life Insurance
- Whole / Endowment Life Insurance
- Unit-Linked & Index-Linked Insurance
- Annuities & Pension Products
- Group Life & Employee Benefits
- Non-life Insurance
- Motor (Third-Party & Hull)
- Property (Household, Commercial, Engineering)
- General Liability
- Accident & Supplemental Health
- Travel Insurance
- Marine, Aviation & Transit (MAT)
- Credit & Surety
- Cyber Insurance
- Life Insurance
- By Distribution Channel
- Tied Agents
- Independent Brokers
- Bancassurance
- Direct (Online & Call-Centers)
- Aggregators & Comparison Portals
- Insurtech / Embedded Partnerships
- By End-User
- Individuals
- Small & Medium-Sized Enterprises (SMEs)
- Large Corporates & Public Entities
- By Premium Type
- Single Premium
- Regular Premium
- By Geography (Federal Provinces)
- Vienna
- Lower Austria
- Upper Austria
- Styria
- Tyrol
- Salzburg
- Carinthia
- Vorarlberg
- Burgenland
Detailed Research Methodology and Data Validation
Primary Research
Several guided interviews with underwriting heads, broker federations, insurtech founders, and VVO statisticians across Vienna, Graz, and Innsbruck helped us validate premium splits, average selling prices, and digital channel uptake assumptions. Follow-up e-surveys with SME finance managers filled gaps on emerging cyber and fleet demand.
Desk Research
Our analysts started with official, freely available sources such as the Austrian Insurance Association (VVO), Eurostat, EIOPA Solvency II statistics, and OECD pension tables, which provide premium flows, penetration ratios, and solvency markers. Public filings from leading Austrian insurers, FMA regulatory releases, and parliamentary bills on tax incentives for unit-linked savings supplied forward-looking regulatory signals. To enrich company-level intelligence, we accessed paid datasets like D&B Hoovers (balance-sheet trends) and Dow Jones Factiva (deal and product launches). These illustrative sources, among several others consulted, set the factual bedrock.
Market-Sizing & Forecasting
A top-down build began with 2024 gross written premiums published by VVO, converted to USD, and then disaggregated by line, distribution, and end-user using penetration rates, claims ratios, and demographic filters. Select bottom-up checks, sampled agent roll-ups and bancassurance fee pools, were overlaid to reconcile totals. Key variables driving the model include disposable income growth, new-car registrations, housing starts, aging population index, and catastrophe loss frequency. Forecasts to 2030 employ multivariate regression linked to those drivers, with scenario overlays informed by expert sentiment. Data gaps in smaller provinces were bridged using three-year moving averages anchored to FMA quarterly disclosures.
Data Validation & Update Cycle
Outputs pass a three-layer review: variance checks against historical VVO series, peer-model comparisons, and senior analyst sign-off. Reports refresh annually, with mid-cycle updates triggered by material regulatory or macro events, ensuring clients receive our most current view.
Why Mordor's Austria Life & Non-Life Insurance Baseline Commands Reliability
Published estimates often diverge because firms pick different premium definitions, forecast windows, and currency bases.
Key gap drivers include: (1) some studies quote nine-month GWP only or exclude health riders; (2) others adjust premiums to constant euros yet apply static FX rates; (3) refresh cadences vary, so rapid 2024 hail-loss surges are either fully captured or entirely missed.
Benchmark comparison
| Market Size | Anonymized source | Primary gap driver |
|---|---|---|
| USD 28.54 B (2025) | Mordor Intelligence | - |
| USD 8.93 B (2024) | Regional Consultancy A | Treats life single-premium top-ups as savings deposits and omits cyber and travel lines |
| USD 20.10 B (2023) | Trade Journal B | Uses historic average FX, excludes broker commissions, nine-month VVO sample only |
In sum, by selecting full-year onshore premiums, live FX updates, and a blended top-down and bottom-up cross-check, Mordor Intelligence delivers a balanced, transparent baseline that decision-makers can trace to clear variables and repeat with confidence.


Key Questions Answered in the Report
What is the projected CAGR for the Austria insurance market between 2026 and 2031?
The market is forecast to expand at a 10.41% CAGR, climbing from USD 31.51 billion in 2026 to USD 51.69 billion in 2031.
Which product line currently dominates premiums in the Austria insurance market?
Non-life insurance leads with 72.85% share, driven mainly by motor and property covers.
How significant is cyber insurance growth in Austria?
Cyber premiums are rising at an 18.42% CAGR as SME awareness of data-breach liability and GDPR fines increases.
Why are annuities gaining momentum in Austria?
Demographic ageing and pension-reform incentives widen the retirement-income gap, steering households toward private annuity products.
Page last updated on:


