
Market Overview
| Study Period | 2020 - 2031 |
|---|---|
| Forecast Data Period | 2026 - 2031 |
| Base Year Market Size (2025) | USD 420 Million |
| Market Size (2026) | USD 454.90 Million |
| Market Size (2031) | USD 678.80 Million |
| Growth Rate (2026 - 2031) | 8.31 % |
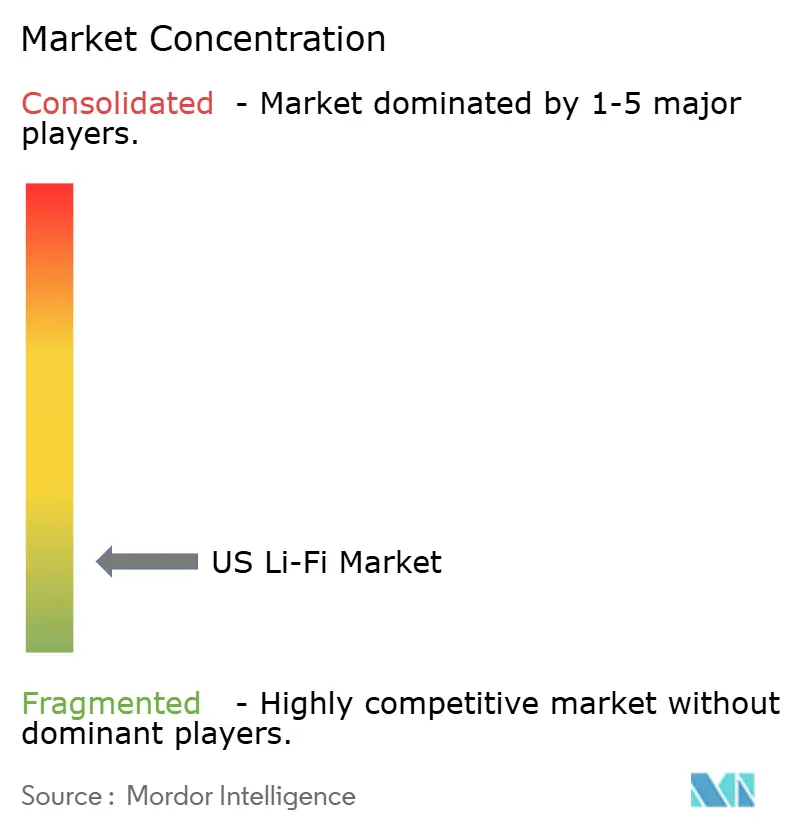
| Market Concentration | Low |
Major Players *Disclaimer: Major Players sorted in no particular order Image © Mordor Intelligence. Reuse requires attribution under CC BY 4.0. | |
US Li-Fi Market Analysis by Mordor Intelligence
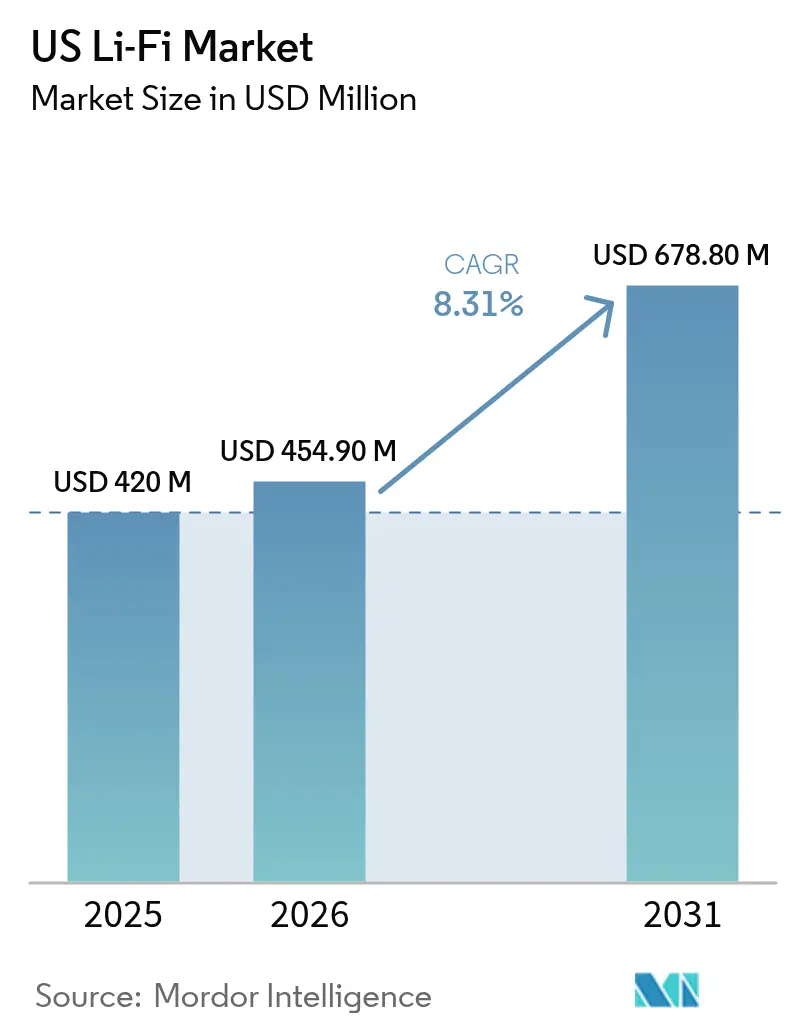
The US Li-Fi Market size is projected to be USD 420 million in 2025, USD 454.90 million in 2026, and reach USD 678.80 million by 2031, growing at a CAGR of 8.31% from 2026 to 2031.
Growth rests on three pillars: accelerated LED retrofits that turn lighting fixtures into data networks, federal incentives that expand domestic optical-component supply, and mounting RF congestion inside enterprise campuses that position Li-Fi as a complementary channel. Military spending, smart-building mandates, and Industry 4.0 automation each funnel fresh demand toward optical wireless links that handle high throughput without electromagnetic interference. Competitive activity concentrates on interoperability with Wi-Fi, smaller transceivers for consumer devices, and tight integration with power-over-Ethernet lighting so that deployment friction stays low.
Key Report Takeaways
- By component, LED light sources captured 49.12% of the US Li-Fi market share in 2025, while software and firmware record the fastest 10.08% CAGR to 2031.
- By technology, LED-based Li-Fi (VLC) systems held 65.10% of the US Li-Fi market size in 2025; hybrid Li-Fi/RF systems expand at an 10.78% CAGR through 2031.
- By end-user industry, retail and hospitality led with 26.25% revenue share in 2025, whereas military and defense is projected to post the highest 11.64% CAGR to 2031.
Note: Market size and forecast figures in this report are generated using Mordor Intelligence’s proprietary estimation framework, updated with the latest available data and insights as of 2026.
US Li-Fi Market Trends and Insights
Drivers Impact Analysis*
| Driver | (~) % Impact on CAGR Forecast | Geographic Relevance | Impact Timeline |
|---|---|---|---|
| Accelerated LED retrofit mandates in US commercial buildings | +1.8% | California, New York, Texas | Medium term (2-4 years) |
| RF spectrum congestion and secure indoor-wireless demand | +2.1% | US metro enterprise districts | Short term (≤ 2 years) |
| Federal funding for military/defense Li-Fi pilots | +1.2% | Defense installations | Medium term (2-4 years) |
| Industry 4.0 demand for deterministic low-latency links | +1.5% | Midwest and Southeast factories | Long term (≥ 4 years) |
| PoE-enabled smart-lighting backhaul economics | +0.9% | Commercial real estate clusters | Short term (≤ 2 years) |
| CHIPS-Act incentives for domestic optical-receiver supply | +0.8% | Arizona, Ohio, New Mexico | Long term (≥ 4 years) |
| Source: Mordor Intelligence | |||
Accelerated LED Retrofit Mandates Drive Infrastructure Foundation
California’s Title 24 codes and the IECC 2021 model elevate LED adoption, inadvertently wiring ceilings with transmitters that double as Li-Fi access points [1]David Manners, “Li-Fi Standard Released – IEEE 802.11bb,” Electronics Weekly, electronicsweekly.com. ASHRAE 90.1 pushes connected-lighting controls, letting building owners recover both energy savings and gigabit connectivity in a single investment. Power-over-Ethernet backhaul trims installation labor because low-voltage cable and data share the same run. Facility managers discover that every luminaire becomes a managed network node, so Li-Fi slips naturally into smart-building dashboards rather than standing alone. The outcome is a lower total cost per square foot compared with overlay Wi-Fi densification.
RF Spectrum Congestion Catalyzes Enterprise Adoption
Urban campuses already saturate 6 GHz Wi-Fi channels; Li-Fi escapes that bottleneck by moving up to the 400-800 THz band that offers 10,000 times the available spectrum. Light cannot leak through walls or ceilings, so floor-by-floor reuse multiplies throughput without coordination overhead. Banks and law firms appreciate the room-contained signal that curbs eavesdropping risk. Factories record cleaner machine telemetry because Li-Fi ignores electromagnetic interference that cripples RF near welders. Fraunhofer’s GigaDock demo hit 12.5 Gbps with sub-millisecond latency, proving deterministic links for Industry 4.0 workloads [2]Fraunhofer IPMS, “Real-Time Li-Fi for Industry 4.0,” Optics.org, optics.org .
Federal Defense Funding Accelerates Military Applications
In January 2025, Intelligent Waves and Signify formed a defense-focused joint venture that places optical wireless on the DoD’s modernization roadmap [3]OpenSystems Media, “Communication Pact for DoD,” Military Embedded Systems, militaryembedded.com. Field exercises indicate that adversaries cannot jam or intercept line-of-sight light unless they penetrate the secure perimeter. Contract dollars underwrite ruggedized transceivers that tolerate temperature swings, vibration, and battlefield dust. Lessons migrate back to civilian gear, leading to smaller photodiodes and adaptive beam steering that strengthen retail and healthcare use cases. As defense procurement absorbs initial non-recurring engineering costs, vendors gain scale economies that spill into commercial price lists.
Industry 4.0 Demands Deterministic Connectivity
Automated lines synchronize robots to tolerances measured in milliseconds; Li-Fi guarantees timetable integrity because light pulses do not fade under electromagnetic noise from motors. Each fixture can also triangulate asset location within centimeters, so a single network handles control and positioning. Automotive plants report faster tool-change routines when handheld scanners stay latency-free. Warehouses mount Li-Fi beacons on high-bay luminaires, guiding autonomous vehicles along dynamic paths while keeping Wi-Fi free for handheld terminals. The deterministic nature of light-based links appeals to safety auditors who insist on predictable packet delivery.
Restraints Impact Analysis*
| Restraint | (~) % Impact on CAGR Forecast | Geographic Relevance | Impact Timeline |
|---|---|---|---|
| Limited line-of-sight coverage range | -1.4% | Open office interiors | Short term (≤ 2 years) |
| Lack of native Li-Fi chipsets in mass-market devices | -1.8% | Consumer electronics channel | Medium term (2-4 years) |
| Fragmented local flicker and building-code compliance hurdles | -0.6% | Municipal jurisdictions | Short term (≤ 2 years) |
| Competitive threat from Wi-Fi 7 and 5G enterprise DAS | -1.1% | Enterprise campuses | Medium term (2-4 years) |
| Source: Mordor Intelligence | |||
Line-of-Sight Limitations Constrain Coverage Economics
Every cubicle wall and moving body can sever an optical path, forcing denser access-point grids than Wi-Fi needs. Reflective ceilings extend reach but cut throughput, so planners must balance redundancy with budget. Retailers find that seasonal aisle resets break line-of-sight maps, adding maintenance overhead. Although beam-steered lasers promise wider cones, the gear costs more than commodity LED lamps. Until automated coverage-mapping software matures, facilities weigh mobility risk against Li-Fi’s security upside.
Device Integration Barriers Limit Market Expansion
Smartphones, tablets, and laptops still ship without embedded Li-Fi transceivers, so users carry USB dongles that drain batteries and add bulk. System-on-chip vendors hesitate to redesign silicon before demand proves sustainable. As Wi-Fi 7 landlords provide gigabit speeds through existing antennas, purchasing teams question a second wireless stack that requires new inventory. The IEEE 802.11bb standard lets Li-Fi appear as another Wi-Fi band, but chipset integration remains in the pilot stage. Lack of native support pushes back consumer adoption timelines and slows economies of scale for component suppliers.
*Our forecasts treat driver/restraint impacts as directional, not additive. The impact forecasts reflect baseline growth, mix effects, and variable interactions.
Segment Analysis
By Component: LED Sources Anchor the Transmission Layer
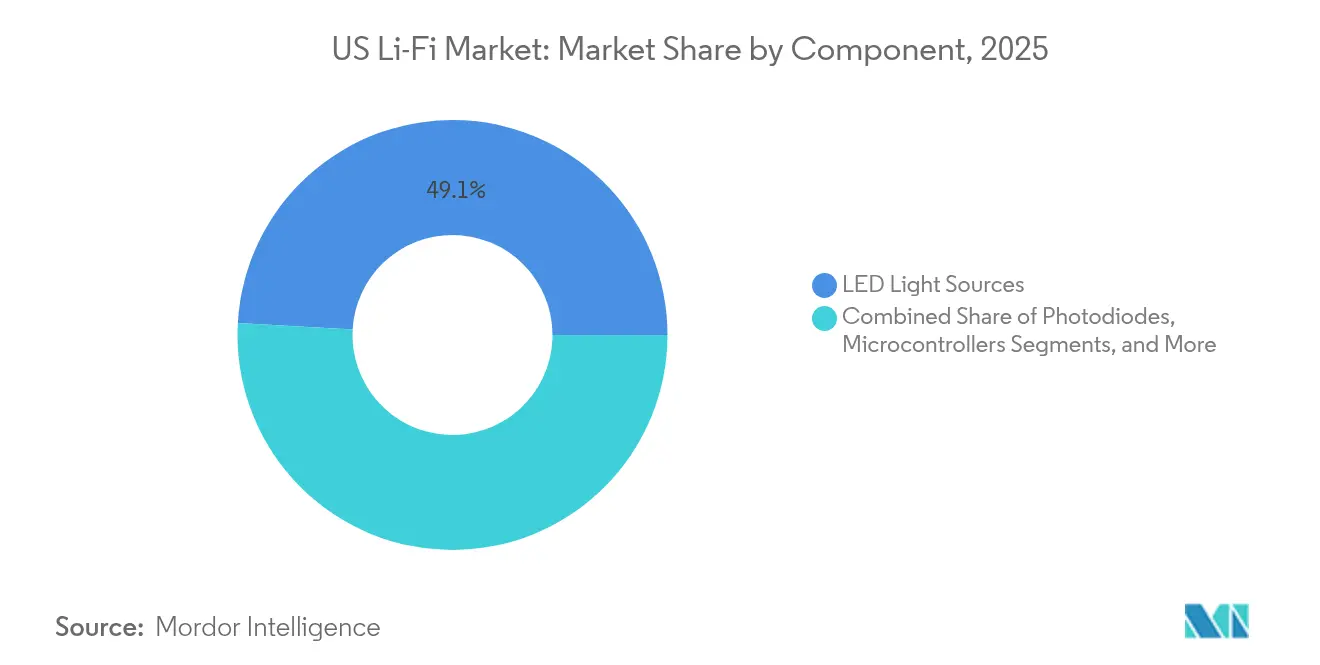
LED light sources held 49.12% of the Li-Fi market share in 2025, demonstrating how illumination assets double as broadband gateways. Each lamp already draws power and occupies ceiling real estate, so incremental cost covers only modulation drivers and photodetectors. That synergy compresses payback periods for building owners who planned LED conversions to meet energy codes. Photodiodes follow as the next-largest hardware slice because every link needs a receive channel, and bidirectional traffic doubles diode counts in duplex installations. Microcontrollers oversee pulse-width modulation that exceeds 50 MHz yet stays flicker-free under IEEE PAR1789 guidance.
Software and firmware post a 10.08% CAGR, the fastest across component lines, because hybrid Li-Fi/Wi-Fi orchestration demands algorithms that decide which band carries which session. Network-management consoles now resemble lighting dashboards, merging lux level, occupancy sensing, and throughput graphs on a common pane. Modulator ASICs integrate signal conditioning that once lived on plug-in cards, trimming enclosure volume so transceivers fit inside desk lamps. System-integration services grow in lockstep, bundling photometrics with RF planning tools so architects can validate coverage and code compliance in one model. The Li-Fi market size allocation for services, therefore, rises faster than hardware outlays as early adopters seek guaranteed performance.



By Technology: VLC Dominance Faces a Hybrid Surge
LED-driven visible-light communication captured 65.10% of the Li-Fi market size in 2025 because commodity LEDs already sit in global supply chains. Safety regulators accept visible wavelengths for occupied spaces, so approvals flow smoothly. Laser-based near-infrared systems carve out specialist niches in warehouses and flight decks where users can wear protective goggles and justify higher costs for extended throw distances.
Hybrid Li-Fi/RF systems register the highest 10.78% CAGR by resolving mobility gaps. A worker can stream to a laptop under the desk lamp and then roam to the hallway as the session hands over to Wi-Fi without packet loss. The IEEE 802.11bb protocol treats optical channels as one more Wi-Fi band, so access-point controllers schedule traffic across light and radio in real time. Vendors now sell ceiling tiles that host both LED emitters and tri-band Wi-Fi antennas in a single enclosure. The convergence lets facilities upgrade on normal refresh cycles instead of running two separate projects.
By End-User Industry: Defense Growth Challenges Retail Leadership
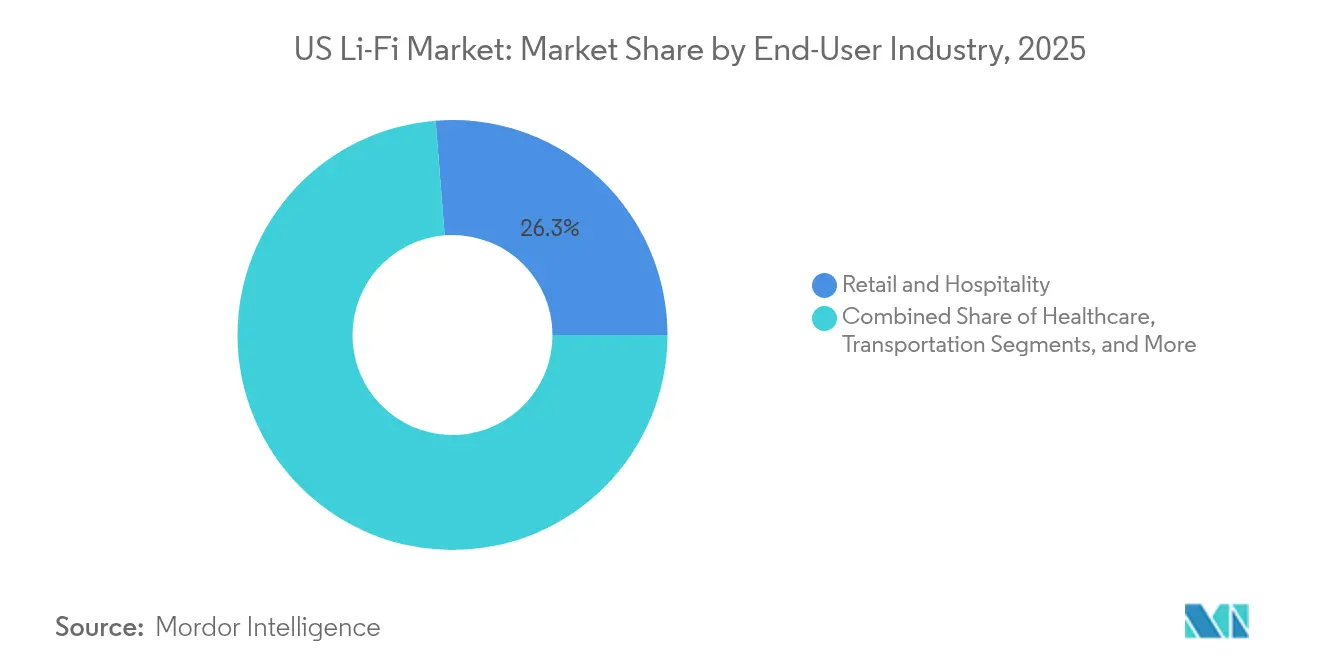
Retail and hospitality claimed 26.25% of 2025 revenue because location-based services monetize shopper analytics while LED upgrades coincide with brand image renovations. Luxury hotels install Li-Fi desk lamps in executive suites so guests enjoy encrypted connectivity without sharing public Wi-Fi passwords. Grocery chains mount aisle-wide LED strips that push coupon data to handheld apps, reinforcing customer loyalty programs.
Military and defense, however, accelerate at a 11.64% CAGR as secure mission communications secure budget priority. The DoD partnership between Intelligent Waves and Signify validates Li-Fi for contested environments where RF jamming or detection jeopardizes operations. Command posts equip briefing rooms with ceiling nodes that isolate traffic to cleared personnel while avoiding electromagnetic leakage. Healthcare, transportation, education, and industrial automation follow with lower but steady adoption curves, each exploiting immunity to EMI or precise indoor positioning for their own workflows.
Geography Analysis
California leads Li-Fi rollouts because state energy codes mandate connected lighting, positioning the U.S. as one of the most advanced regions within the global Li-Fi market. and Silicon Valley firms pilot optical networking on new campuses. High-rise retrofits in Los Angeles adopt Li-Fi to offset Wi-Fi shadow zones created by Low-E window coatings. New York skyscrapers join the wave as landlords chase Title 24-style standards for their own sustainability pledges. Texas gains momentum in corporate campuses around Austin, where semiconductor fabs align with CHIPS Act grants for domestic optical receiver production.
Defense installations distribute Li-Fi nodes across more than a dozen states, clustering near major Air Force bases and shipyards. These projects seed local contractor ecosystems that then market the same skill sets to hospitals and universities. Midwest automotive plants in Michigan and Ohio add optical links alongside robot lines to dodge RF noise, while Southeast logistics hubs in Georgia and Tennessee equip distribution centers for centimeter-grade asset tracking.
Regional code variance slows uniform adoption. Cities like Seattle and Boston align lighting rules with IECC 2021, whereas smaller municipalities lag, forcing national retailers to juggle multiple compliance frameworks. For vendors, this patchwork inflates certification budgets and lengthens sales cycles. Yet once a jurisdiction upgrades electrical codes, the Li-Fi market responds swiftly because the cost of adding light-based networking is marginal against the mandatory LED switch. Thus, the Li-Fi market size in progressive states outpaces laggards by double-digit percentages within two years of code harmonization.
Regulatory Landscape
US Li-Fi deployments sit at the intersection of building and lighting compliance and the broader indoor connectivity policy environment. IEEE Std 802.11bb-2023 provides the core framework that lets light communications reuse Wi-Fi MAC layers, which reduces interoperability risk for enterprise rollouts and procurement. In parallel, guidance around flicker-safe modulation and connected-lighting requirements in major code regimes (for example, California Title 24 referenced in the report context) shapes luminaire designs used as Li-Fi access points.
Although Li-Fi itself is optical, the regulatory environment for in-building wireless also depends on unlicensed spectrum decisions that drive hybrid Li-Fi/RF architectures. FCC actions expanding unlicensed operations in the 6 GHz band include the finalized very low power (VLP) rules effective May 5, 2025, and geofenced variable power (GVP) rules effective April 27, 2026. These geofenced requirements mandate geolocation capability for GVP access points, supporting coordinated hybrid systems where Li-Fi provides secure, room-contained links while Wi-Fi supplies mobility and wider indoor coverage.
Value Chain Analysis
The US Li-Fi value chain starts with upstream LED and optical components (LED light sources and drivers/modulators, photodiodes, microcontrollers, and signal-processing ASICs), then moves into Li-Fi transceiver modules and luminaires, network controllers and software, and finally system integration and services. Within this report scope, the lighting layer remains central, with LED light sources holding 49.12% share in 2025, reflecting how Li-Fi is often embedded into retrofit or new-build connected-lighting projects rather than deployed as standalone IT gear.
Midstream players include specialist Li-Fi vendors and lighting OEMs that package optical front-ends with software and firmware for hybrid Li-Fi/Wi-Fi orchestration, along with integrators that design coverage, verify flicker-safe operation, and commission PoE-enabled backhaul. Standardization is a key enabler across the chain. IEEE 802.11bb-2023 anchors current interoperability, and the IEEE 11 Working Group approved a Project Authorization Request for IEEE P802.11br (Enhanced Light Communications) in March 2025, signaling continued evolution of the ecosystem. Downstream demand is led by enterprise and government environments that value EMI immunity and contained propagation, with procurement commonly bundling lighting upgrades, network management, and security requirements into a single project scope.
Competitive Landscape
The studied market's concentration remains fragmented. Signify leverages its lighting portfolio but faces nimble rivals pureLiFi, VLNComm, and SaNoor that specialize in optical modulation. Each firm races to shrink receiver size so that laptop bezels host integrated photodiodes rather than USB dongles. Patent filings cluster around beam-steering micro-mirror arrays, adaptive dimming that maintains lux output while pushing higher data rates, and multi-band access-point algorithms.
Companies able to embed Li-Fi into conventional Wi-Fi chipsets gain cost leverage and instant user-base access. Lighting giants bundle optical access points with power-over-Ethernet luminaires, pitching a single invoice that covers energy savings and network upgrades. Startups counter with modular kits aimed at defense and heavy-industry buyers who value performance over volume pricing.
Mergers and joint ventures intensify as firms seek scale. Signify’s JV with Intelligent Waves attacks defense budgets, while component houses align with PCB assemblers in Ohio to meet CHIPS-Act domestic-content rules. Service integrators spring up to audit ceiling layouts, run photometric simulations, and guarantee both flicker compliance and throughput. Venture funding follows, yet investors scrutinize chipset roadmaps because native smartphone support is the final unlock for mass adoption. The Li-Fi industry, therefore, displays dynamic but disciplined capital flows.
US Li-Fi Industry Leaders
Signify Holding (Trulifi)
VLNComm Inc.
Qualcomm Technologies, Inc.
Panasonic Holdings Corporation
pureLiFi Ltd.
- *Disclaimer: Major Players sorted in no particular order

Market Opportunities and Future Outlook
Near-term whitespace centers on security-accredited Li-Fi for government, defense, and regulated enterprise networks, where encryption validation and contained propagation affect purchasing decisions. NIST-anchored security validation is a tangible procurement lever. In June 2025, Signify announced that its Trulifi 6004 became the first LiFi technology to receive FIPS 140-3 validation, aligning with requirements referenced in US federal and other sensitive commercial deployments. Testing programs for optical wireless in restricted or RF-challenged environments also create a deployment pipeline, including the US Department of Energy-backed Li-Fi feasibility work at the Nevada National Security Site focused on secure, non-RF-susceptible connectivity.
A second opportunity area is IP-led consolidation and licensing that can accelerate multi-vendor productization and module integration. In March 2026, Ravinia Capital initiated a competitive sale process for a 68-patent Li-Fi/VLC portfolio with protection extending into the mid-2030s, pointing to monetizable core IP that can support broader device and infrastructure roadmaps. In parallel, continued IEEE work beyond 802.11bb, including the active P802.11br effort, supports procurement confidence by extending standardized light-communications capabilities, helping integrators and facility owners treat Li-Fi as a networking option that fits with Wi-Fi tooling and lifecycle refresh cycles rather than a bespoke pilot.
Recent Industry Developments
- July 2026: Signify Trulifi 6002 was highlighted in business media as a secure Li-Fi system positioned for busy US office environments. The emphasis on office-grade secure optical links reinforces Li-Fi as a complementary indoor channel where contained coverage and reduced RF exposure are valued. It also supports broader bundling of Li-Fi with connected-lighting refresh cycles in commercial buildings.
- June 2025: Signify announced its Trulifi 6004 system received FIPS 140-3 validation from NIST for secure data transmission. This security milestone supports eligibility for US government and other compliance-driven buyers that reference validated cryptographic modules. The validation also raises the bar for competing Li-Fi vendors targeting regulated deployments.
- February 2024: Signify and EDZCOM announced a strategic partnership to introduce Trulifi for industrial connectivity use cases. The partnership links Li-Fi with private industrial networks and on-premise deployment models, where EMI immunity and deterministic links are valued. It also broadens the integration ecosystem by pairing a lighting-led Li-Fi portfolio with industrial connectivity and deployment capabilities.


Research Methodology Framework and Report Scope
Market Definition and Coverage
For this methodology, the US Li-Fi market covers revenue generated from Li-Fi communication systems used to transmit data using light in the United States. This includes the core optical hardware and related system elements needed to deploy and run Li-Fi links.
Scope exclusions: We exclude broader optical wireless categories that are not Li-Fi, such as free-space optics links built mainly for long-range point-to-point backhaul.
Segmentation Overview
- By Component
- LED Light Sources
- Photodiodes
- Microcontrollers
- Modulators/Signal-Processing ASICs
- Software and Firmware
- System Integration and Services
- By Technology
- LED-based Li-Fi (VLC)
- Laser-based Li-Fi (NIR)
- Hybrid Li-Fi/RF Systems
- By End-user Industry
- Healthcare
- Transportation
- Education
- Military and Defense
- Retail and Hospitality
- Other End-user Industries (Aerospace, Industrial Automation,and others)
Data Sources, Market Sizing, and Validation
Desk Research
Desk research was used to set the market context and to anchor the model with observable signals that are publicly traceable. We reviewed standards and technical adoption cues, including IEEE 802.11 working group publications, along with FCC materials that help interpret spectrum constraints that can steer optical alternatives in specific indoor settings.
To keep assumptions grounded, we also pulled indicators from sources such as the US Census Bureau (industry output and establishment counts), Bureau of Labor Statistics (employment and wage trends in relevant electronics and installation roles), USITC trade statistics (import and export movement for key lighting and optoelectronic categories), and peer-reviewed journals for performance ranges that affect practical deployment. Company filings, investor presentations, trade association updates, and reputable press were used to cross-check timing of deployments and solution readiness. A paid subscription for company financials and news intelligence was referenced selectively to clarify revenue mix and business focus. The sources listed here are illustrative only, and many other public references were also used for data collection, validation, and research clarification.
Primary Interviews and Surveys
Primary work focused on validating what is actually being deployed in the US, and what gets budgeted as Li-Fi versus adjacent connectivity or lighting upgrades. We spoke with a mix of solution providers, component suppliers, system integrators, and end users across common adoption settings like enterprises, education, healthcare, and defense-related environments. The goal was to confirm pricing logic, attachment rates, and near-term roll-out constraints used in the model.
Distribution of primary research fieldwork respondents
| Company type | Respondent position |
|---|---|
| Top tier: 33% | CXOs: 16% |
| Mid tier: 49% | Functional/Unit leaders: 33% |
| Smaller Players: 18% | Managers: 51% |
Market-Sizing & Forecasting
Sizing starts with a top-down build that reconstructs the US demand pool from Li-Fi-addressable deployment spaces and expected penetration. We then translate that into value using typical system configurations and pricing bands.
The demand pool is informed by practical usage settings, so we focused on indicators like indoor connectivity density needs, security-driven connectivity choices, the share of sites with LED lighting suitable for Li-Fi integration, typical refresh cycles for lighting and IT infrastructure, and the readiness of Li-Fi standards and interoperability.
Once the initial total is produced, selective bottom-up approximations are used as a check to ensure the totals do not drift away from market reality. This includes supplier and channel checks on sampled average selling prices for key elements (such as luminaires and receivers), sanity checks using shipment and installation activity where it can be observed, and revenue reasonableness tests against known commercialization footprints in the country. For gaps where hard volumes are not visible, assumptions are filled using ranges confirmed in interviews, and the model is recalculated so each assumption has a visible impact.
Forecasting uses scenario analysis supported by a small set of drivers that interviewees consistently pointed to. These include rollout pace in sensitive environments, procurement cycles, lighting retrofit momentum, and expected pricing progression as deployments scale. A base case is created first, and then upside and downside cases are run to reflect differences in adoption speed across end-user settings.
Data Validation & Update Cycle
Outputs are checked through triangulation across independent signals, and any large variance is investigated before results are finalized. We compare implied adoption levels against observable activity in Li-Fi deployments, standardization progress, and pricing bands that integrators and buyers report. Outliers are reviewed in a second analyst pass so the logic stays consistent from input to output.
The report is refreshed annually, and interim updates are made when material events can change near-term sizing assumptions, such as standards shifts or major procurement announcements. Before delivery, a final review re-checks recent public information and re-contact sources if a key input moved meaningfully.
Mordor Intelligence's USA Li Fi Market Size Compared With Other Published Estimates
Published market values for US Li-Fi can differ substantially because the scope line is drawn differently, and the same technology can be grouped into larger optical connectivity buckets. Variations also come from how firms treat pricing declines, the speed at which they assume deployments scale, and whether they align currency timing and base-year inputs the same way.
Some external estimates fold Li-Fi into broader FSO and visible light communication totals, or they use aggressive adoption curves that treat early pilots as full commercial rollouts. For Mordor Intelligence, revenue is counted only when it is tied to Li-Fi system deployments within the United States. Broader FSO backhaul and mixed optical categories are kept outside the total, so the model stays aligned to a repeatable demand pool and realistic pricing.
Benchmark comparison
| Source | Market Size | Gaps in Research Methodology |
|---|---|---|
| Mordor Intelligence | USD 420.00 M (2025) | |
| Industry Publisher A | USD 21.89 B (2023) | Uses a much larger value base that likely captures a wider set of products and revenue streams labeled as Li-Fi, with growth assumptions that scale to triple-digit billions within a short horizon, which can overstate near-term commercial penetration. |
| Research Platform B | USD 1850.00 M (2024) | Combines Li-Fi with FSO and VLC in one US total and extends the forecast window far out, which inflates the present-year size compared with a Li-Fi-only deployment and pricing model. |
The spread across published values mainly traces back to category mixing and to how quickly adoption and pricing are assumed to evolve. By keeping the inputs tied to US deployment settings, realistic penetration, and checkable price bands, the approach produces a practical number that can be re-run as conditions change.


Key Questions Answered in the Report
How big is the US Li-Fi market in 2026?
The Li-Fi market stands at USD 454.9 million in 2026.
What is the forecast CAGR for Li-Fi through 2031?
The market is projected to grow at an 8.31% CAGR between 2026 and 2031.
Which component holds the largest share?
LED light sources captured 49.12% of Li-Fi market share in 2025.
Which technology segment is growing fastest?
Hybrid Li-Fi/RF systems post an 10.78% CAGR through 2031.
Why is defense spending important to Li-Fi adoption?
Military and defense applications drive secure, jam-resistant communication funding, accelerating innovation and growth at a 11.64% CAGR.
What limits consumer uptake today?
Lack of native Li-Fi chipsets in mass-market devices forces external dongles, slowing mainstream penetration.
Page last updated on:


 Your data is secure and never sold or shared.


