Lithium Tantalate Crystal Market Size and Share
Market Overview
| Study Period | 2019 - 2030 |
|---|---|
| Market Size (2025) | USD 572.64 Million |
| Market Size (2030) | USD 738.89 Million |
| Growth Rate (2025 - 2030) | 5.23% CAGR |
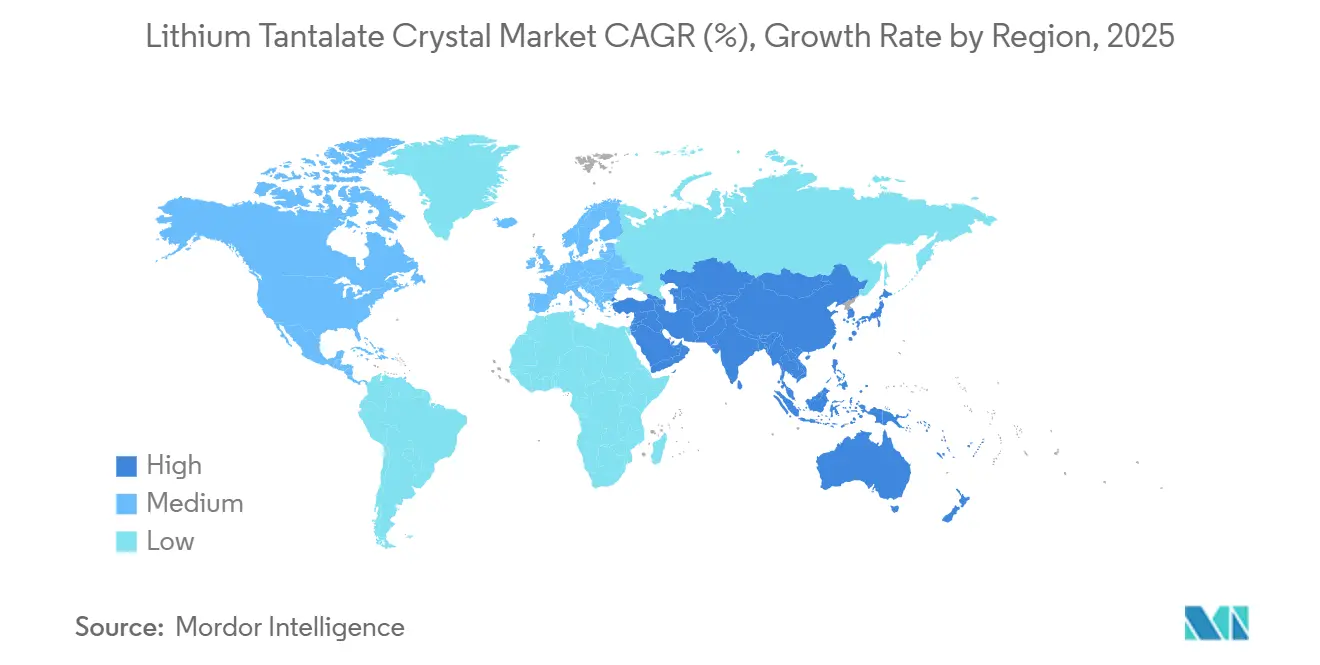
| Fastest Growing Market | Asia Pacific |
| Largest Market | Asia Pacific |
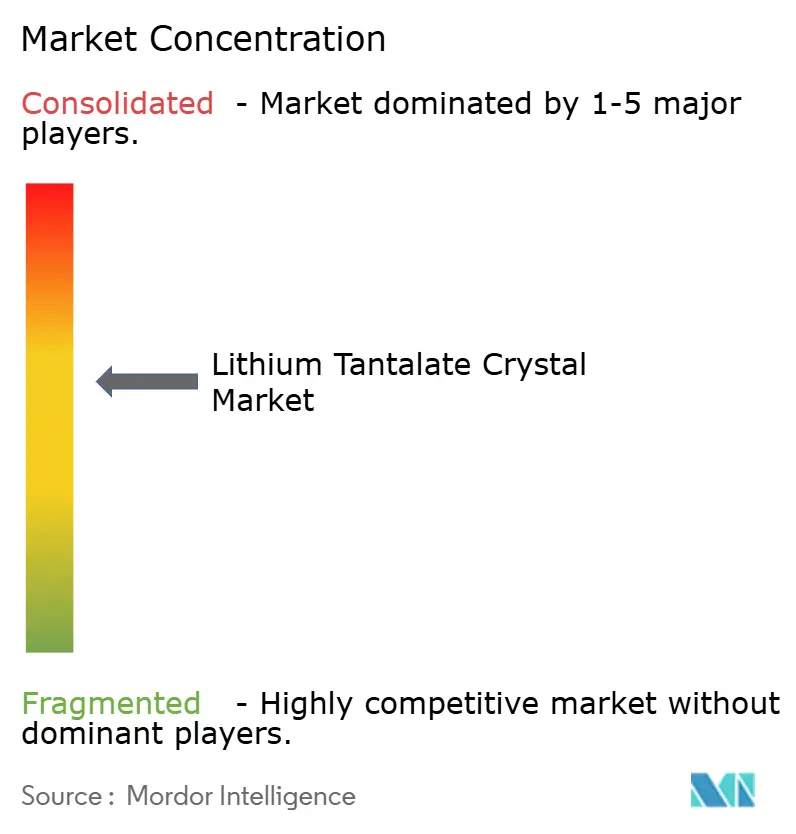
| Market Concentration | Medium |
Major Players *Disclaimer: Major Players sorted in no particular order Image © Mordor Intelligence. Reuse requires attribution under CC BY 4.0. | |
Lithium Tantalate Crystal Market Analysis by Mordor Intelligence
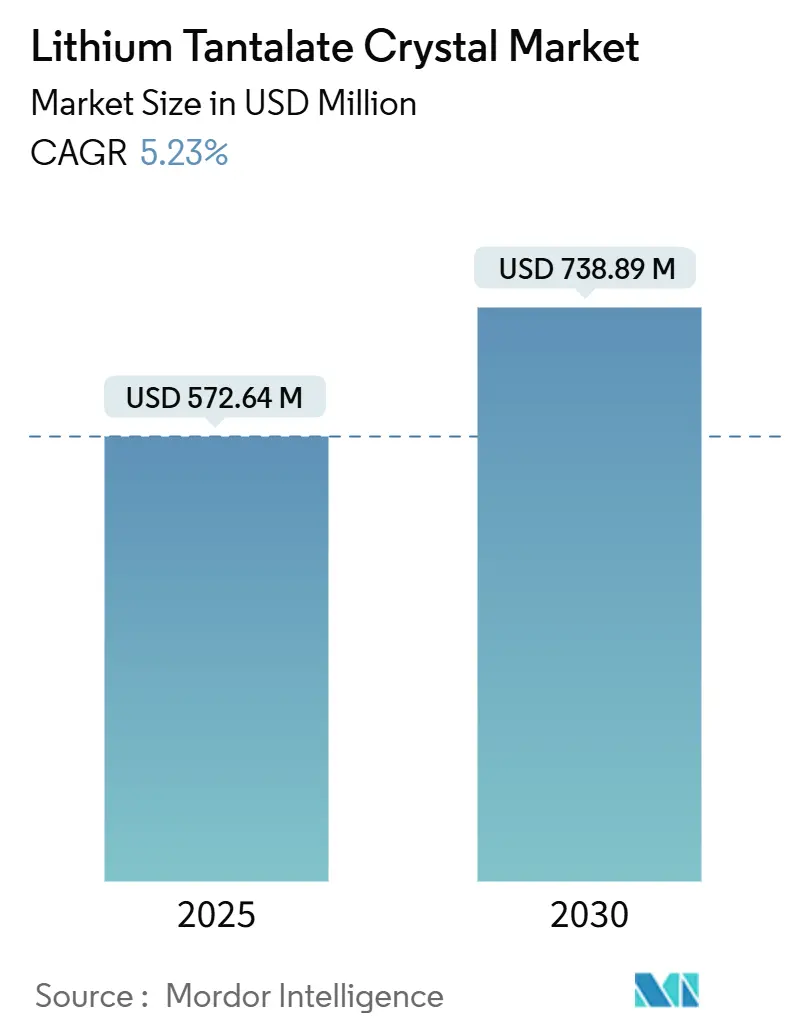
The lithium tantalate crystal market size reached USD 572.64 million in 2025 and is projected to achieve USD 738.89 million by 2030, advancing at a 5.23% CAGR. Strong momentum comes from 5G small-cell rollouts that need temperature-stable surface-acoustic-wave (SAW) filters, photonic integrated circuits adopting lithium tantalate-on-insulator (LTOI) wafers, and the migration away from quartz in wide-band radio-frequency (RF) filters. Vertically integrated Japanese vendors maintain quality leadership, while Chinese fabs scale high-volume slice processing for telecom front-end modules. Downstream, electro-optic modulators and ultraviolet nonlinear-optics open premium niches, and near-stoichiometric crystal grades are expanding fastest as they enable higher laser-damage thresholds. Headwinds stem from raw-material volatility in tantalum supply chains and yield loss from crystal twinning during Czochralski growth, yet ongoing process innovations keep production economics competitive.
Key Report Takeaways
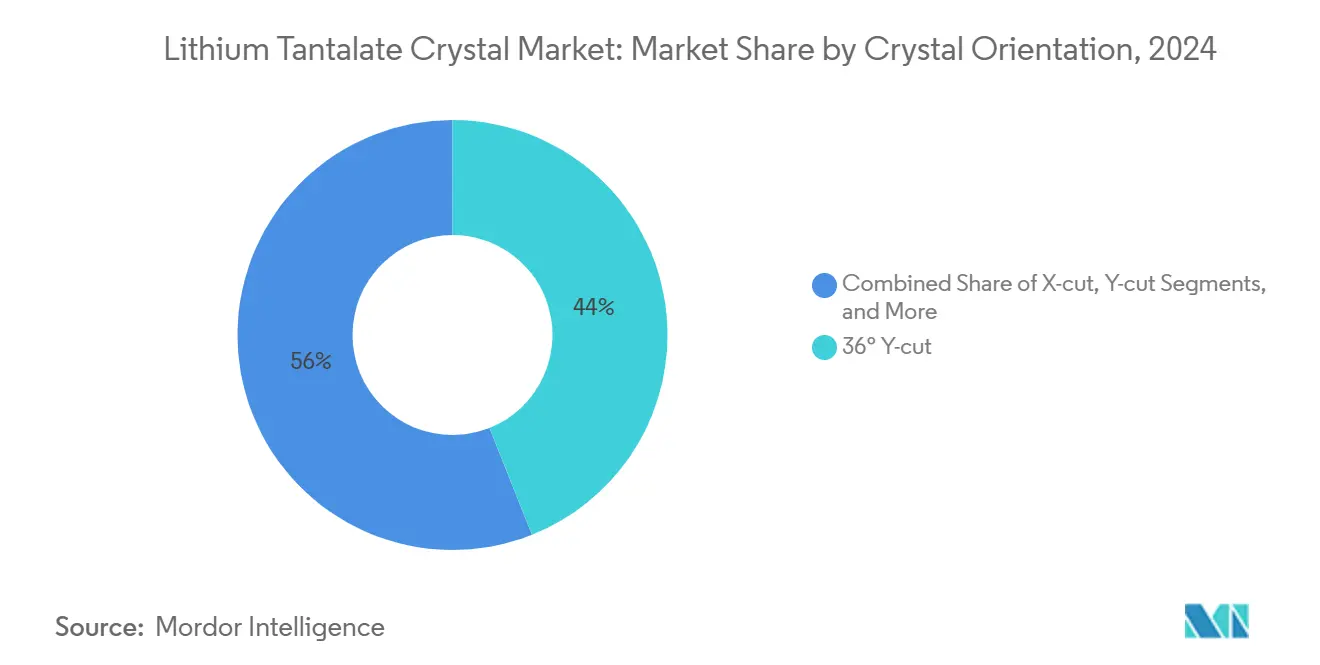
- By crystal orientation, 36° Y-cut captured 43.97% of the lithium tantalate crystal market share in 2024, and 42° Y-cut is forecast to post a 6.43% CAGR through 2030.
- By application, SAW devices held 57.14% of the lithium tantalate crystal market size in 2024; electro-optic modulators are advancing at a 6.82% CAGR to 2030.
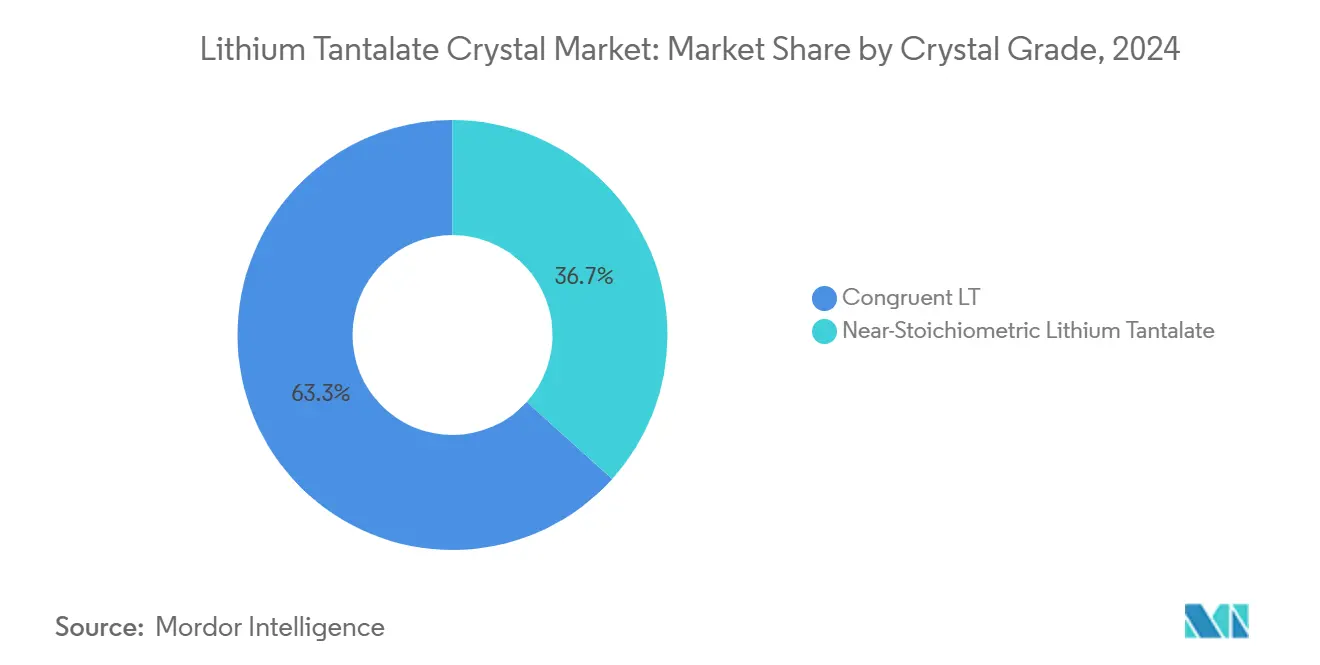
- By crystal grade, congruent material led with 63.32% share in 2024; near-stoichiometric variants are set to grow at an 8.31% CAGR to 2030.
- By end-use, telecommunications commanded 47.93% revenue in 2024, while medical imaging is projected to expand at a 6.33% CAGR through 2030.
- By geography, Asia-Pacific dominated with 36.74% contribution in 2024 and is expected to grow at 5.19% CAGR to 2030.
Global Lithium Tantalate Crystal Market Trends and Insights
Drivers Impact Analysis*
| Driver | (~) % Impact on CAGR Forecast | Geographic Relevance | Impact Timeline |
|---|---|---|---|
| 36° and 42° Y-cut adoption in 5G SAW filters | +1.8% | Asia-Pacific core; spillover to North America and Europe | Short term (≤ 2 years) |
| Temperature-stable substrates for IoT sensors | +1.2% | Global; early gains in Asia-Pacific fabs | Medium term (2–4 years) |
| Quartz-to-LiTaO₃ shift for wide-band RF filters | +0.9% | North America and Europe telecom upgrades | Medium term (2–4 years) |
| LTOI wafers for photonic integrated circuits | +0.7% | Global advanced-node foundries | Long term (≥ 4 years) |
| Near-stoichiometric LiTaO₃ in ultraviolet nonlinear optics | +0.4% | North America and Europe research hubs | Long term (≥ 4 years) |
| Electro-caloric cooling chips for wearables | +0.3% | Consumer-electronics value chain | Long term (≥ 4 years) |
| Source: Mordor Intelligence | |||
36° and 42° Y-cut adoption in 5G SAW filters
Telecom equipment makers pivot to 36° and 42° Y-cut wafers because their electromechanical coupling exceeds 8%, meeting the tight insertion-loss budgets of n77 and n79 bands. [1]Yutaka Ohno, “Twinning in Czochralski-Grown 36°-RY LiTaO₃,” Crystals, mdpi.comEuropean regulators have already allocated 3.6 GHz spectrum, triggering immediate substrate orders from Japanese and Taiwanese filter houses. Supply concentration in Asia-Pacific keeps logistics lean, yet fab utilization is pressing upper limits, prompting capacity expansion announcements for 150 mm slices. Compliance with IEC TC 49 standards standardizes resonator performance, shortening customer qualification times. As carriers accelerate small-cell densification, demand pressure is set to remain elevated through 2026.
Temperature-stable substrates for IoT sensors
Industrial IoT nodes deployed in factories and smart grids require frequency stability across –40 °C to 150 °C ranges. Congruent lithium tantalate sustains resonance drift within ±100 ppm even after 350 h at 700 °C, outperforming quartz alternatives. Foundries in China and Malaysia integrate these wafers into pressure and vibration sensors without major tooling changes, cutting bill-of-materials complexity. Medium-term growth aligns with 2-year automotive design cycles; Tier-1 auto suppliers already sample prototypes for exhaust-gas monitoring. Government incentives for domestic chip ecosystems further accelerate regional uptake.
Quartz-to-LiTaO₃ shift for wide-band RF filters
Wide-band filters must handle contiguous sub-GHz allocations plus carrier aggregation; quartz cannot deliver required bandwidth. Lithium tantalate SAW structures demonstrate 24% fractional bandwidth versus 2% for quartz, enabling handset makers to reduce filter count. [2]Zengtian Lu, “24% Bandwidth SAW Filters,” Micromachines, mdpi.comNetwork operators see lower insertion loss translating into smaller power amplifiers, cutting radio unit energy use. Component swaps proceed gradually because telecom OEM qualification lasts 18–30 months, but early adopters cite 15% bill-of-materials savings from circuit simplification.
LTOI wafers for photonic integrated circuits
Lithium tantalate-on-insulator delivers electro-optic coefficients nearly 10× silicon photonics while remaining CMOS-fab compatible. Pilot lines in Europe and the United States demonstrated 750,000 wafer annual capacity with sub-0.5 dB/cm propagation loss. [3]Chengli Wang, “Lithium Tantalate PICs for Volume Manufacturing,” Nature, nature.com Data-center switch vendors target co-packaged optics beyond 800 Gb/s, and HPC system integrators plan discrete modulators that halve drive voltage. Long-term growth depends on capex for 200/300 mm thin-film tools and sustained foundry utilization, but multiyear supply agreements with cloud providers de-risk investments.
Restraints Impact Analysis*
| Restraint | (~) % Impact on CAGR Forecast | Geographic Relevance | Impact Timeline |
|---|---|---|---|
| High wafer cost versus LiNbO₃ and quartz | −1.4% | Global cost-sensitive segments | Short term (≤ 2 years) |
| Supply volatility of tantalum raw material | −0.8% | Global; intensified in Asia-Pacific fabs | Short term (≤ 2 years) |
| Yield loss from crystal twinning and defects | −0.6% | Asia-Pacific crystal-growth centers | Medium term (2–4 years) |
| SiC and BAW substrates in millimeter-wave | −0.4% | North America and Europe advanced RF | Medium term (2–4 years) |
| Source: Mordor Intelligence | |||
High wafer cost versus LiNbO₃ and quartz
Lithium tantalate slices cost 15–25% more than lithium niobate and up to 60% more than quartz because tantalite ore trades near USD 5,190 per kg. Smartphone OEMs operating on razor-thin margins resist adoption for low-to-mid tiers, delaying volume ramp. Fabs respond by moving to 6-inch ingots and reclaiming kerf losses, but raw-material premiums remain structural. Short-term design-in decisions hinge on whether performance gains outweigh sticker-price penalties.
Supply volatility of tantalum raw material
Conflict in the Democratic Republic of Congo and sanctions on Russian feedstock pushed spot tantalite to two-year highs, triggering procurement risks. Asia-Pacific polishers depend on African ore shipped through constrained logistics corridors, so even brief port closures ripple through wafer output. Buffer stockpiles lift working-capital needs, and forward-purchase contracts embed price escalation clauses, pressuring downstream device margins. OEMs increasingly request dual-sourced crystals, raising qualification workload across the chain.
*Our forecasts treat driver/restraint impacts as directional, not additive. The impact forecasts reflect baseline growth, mix effects, and variable interactions.
Segment Analysis
By Crystal Orientation: Telecom-grade cuts anchor demand
The 36° Y-cut held 43.97% of lithium tantalate crystal market share in 2024 thanks to 5G radio units needing coupling coefficients over 8%. Orientation dictates electromechanical behavior, so filter designers specify slices tightly within ±0.1° angular tolerance. The 42° Y-cut is forecast to outpace peers at 6.43% CAGR, enabling n77/n79 multi-stack filters with reduced spurious modes. Twinning propensity remains a yield limiter in 36°-RY ingots, but growth-parameter optimization has lifted usable boule length above 60%. X-cut and Z-cut serve niche gyroscope and acoustic delay-line applications, preserving a small but stable revenue base.
Process engineers adopt real-time optical interferometry to monitor crystallographic alignment, trimming post-sawing wastage. Adoption of 200 mm diameter targets emerges for volume SAW production, though most lines still run 150 mm because legacy dicing tools require minimal re-fit. Orientation dispersion below 20 arcsec ensures filter matching across front-end modules, reducing RF calibration steps at handset assembly stations.


By Application: SAW devices dominate, modulators accelerate
SAW components captured 57.14% of the lithium tantalate crystal market size in 2024 on the back of handset duplexers and base-station filters. Line capacity expansions in Japan, Taiwan, and China keep lead times under 16 weeks. Electro-optic modulators are set to post 6.82% CAGR, fueled by thin-film lithium tantalate platforms offering less than 1 dB bias drift over 46 h, outperforming lithium niobate comparables. Pyroelectric infrared detectors maintain double-digit growth in medical thermography, while nonlinear-optics and THz generation niches benefit from near-stoichiometric material advances.
On-wafer SAW filter test yields now exceed 95% for mid-band devices after wafer-level packaging became mainstream. Modulator design wins with cloud providers specify half-wave voltages under 4 V, cutting driver-IC power. Wafer-level hermetic sealing techniques slash cavity height, allowing denser optical-engine packaging.
By Crystal Grade: Near-stoichiometric gains premium share
Congruent melts kept 63.32% share in 2024 thanks to cost-efficient boule pulling. Yet near-stoichiometric crystals will grow at 8.31% CAGR to 2030 as ultraviolet laser systems and high-speed modulators require reduced photorefractive damage. Double-crucible Czochralski furnaces with automatic powder feed now routinely achieve Li/Ta ratios within 48.6–48.8 mol%, elevating yield. Stoichiometric slices command 25–30% price premiums but can halve device failure rates in high-power optics, justifying adoption.
Research shows stoichiometric LiTaO₃ lowers coercive field by 35%, easing domain-engineering in MEMS mirror arrays. Vapor-transport equilibration remains slow, yet ongoing scale-up trials target weekly 4-inch boule output, aligning with specialty-laser order rhythms.
By End-use Industry: Telecoms retain lead, healthcare rising
Telecommunications accounted for 47.93% revenue in 2024 because radio-access-network densification absorbs SAW filters in every small cell. Medical imaging is tracking highest growth at 6.33% CAGR on wider thermal imager deployment in point-of-care diagnostics. Consumer-electronics demand remains steady, dragged by smartwatch temperature sensors and haptic actuators. Aerospace and defense procure radar pulse-compression filters and high-G inertial sensors, paying premiums for radiation-hard crystals. Industrial instrumentation leverages LiTaO₃ piezoelectric stability for down-hole energy exploration tools, broadening volume beyond telecom.
Regulatory frameworks such as IEC 60601-1 push medical OEMs to document material traceability, favoring suppliers with ISO 13485 plants. Telecom infrastructure bills in India and Southeast Asia earmark subsidies for locally sourced front-end modules, creating regional pull for wafer finishing services.
Geography Analysis
Asia-Pacific led with 36.74% share in 2024, owing to integrated supply chains from Japanese ingot growth to Chinese module assembly. Regional CAGR of 5.19% through 2030 stems from continued 5G densification and expanding sensor fabs. Domestic Chinese crystal growers are piloting 150 mm boules, aided by provincial grants covering up to 20% of capex. North America shows renewed interest as defense contractors seek secure domestic sources; a U.S. fab retrofit scheduled for 2026 will process 100 k wafers annually. Europe focuses on photonic integrated circuits, leveraging Horizon funding to scale LTOI volume production.
Middle East and Africa telecom operators deploy 5G standalone core networks, yet wafer imports dominate consumption due to limited local processing. South America’s demand rises in medical infrared cameras and industrial inspection, but market penetration stays below 5% because of currency volatility and smaller equipment budgets.

Competitive Landscape
The field is moderately concentrated: the top five suppliers hold roughly 55% combined revenue, led by Shin-Etsu Chemical and Sumitomo Metal Mining. These incumbents integrate feedstock refining, boule growth, and slice polishing, delivering tight lot-to-lot uniformity. Tokyo Denpa, Korth Kristalle, and MSE Supplies specialize in custom orientations and prototype quantities. Murata leverages internal capacity mainly for captive SAW filters, occasionally selling surplus wafers to third parties. Recent strategies center on boosting usable boule length via thermal-gradient management and automating defect inspection with deep-learning vision. Patent filings covering thin-film transfer and plasma-activated wafer bonding indicate a pivot toward heterogeneous integration with silicon photonics.
Joint ventures emerge to localize finishing steps; for instance, Murata and QuantumScape examine ceramic-film co-production to share sintering expertise. IEC standardization lowers qualification barriers for smaller entrants, yet capex intensity preserves incumbents’ cost leadership.
Lithium Tantalate Crystal Industry Leaders
Shin-Etsu Chemical Co., Ltd.
Sumitomo Metal Mining Co., Ltd.
Tokyo Denpa Co., Ltd.
Korth Kristalle GmbH
Crystalwise Technology Inc.
- *Disclaimer: Major Players sorted in no particular order

Recent Industry Developments
- May 2025: Nature detailed lithium tantalate photonic integrated circuits achieving 750,000 LTOI wafers yearly, confirming scalable manufacturing.
- April 2025: Murata and QuantumScape began exploring joint ceramic-film production for solid-state batteries.
- January 2025: arXiv reported a heterogeneous lithium tantalate-silicon photonics platform supporting >70 GHz modulation.
- August 2024: Nature highlighted LTOI photonics achieving silicon-competitive loss at lower cost.


Global Lithium Tantalate Crystal Market Report Scope
| X-cut |
| Y-cut |
| Z-cut |
| 36° Y-cut |
| 42° Y-cut |
| Surface Acoustic Wave (SAW) Devices |
| Electro-optic Modulators |
| Pyroelectric/IR Detectors |
| Non-linear Optics and THz Generation |
| Congruent Lithium Tantalate |
| Near-Stoichiometric Lithium Tantalate |
| Telecommunications |
| Consumer Electronics |
| Aerospace and Defense |
| Industrial and Instrumentation |
| Medical Imaging and Diagnostics |
| North America |
| Europe |
| Asia-Pacific |
| Middle East and Africa |
| By Crystal Orientation | X-cut |
| Y-cut | |
| Z-cut | |
| 36° Y-cut | |
| 42° Y-cut | |
| By Application | Surface Acoustic Wave (SAW) Devices |
| Electro-optic Modulators | |
| Pyroelectric/IR Detectors | |
| Non-linear Optics and THz Generation | |
| By Crystal Grade | Congruent Lithium Tantalate |
| Near-Stoichiometric Lithium Tantalate | |
| By End-use Industry | Telecommunications |
| Consumer Electronics | |
| Aerospace and Defense | |
| Industrial and Instrumentation | |
| Medical Imaging and Diagnostics | |
| By Geography | North America |
| Europe | |
| Asia-Pacific | |
| Middle East and Africa |


Key Questions Answered in the Report
How fast is the lithium tantalate crystal market expected to grow to 2030?
Revenue is projected to move from USD 572.64 million in 2025 to USD 738.89 million by 2030, representing a 5.23% CAGR.
Which application uses the most lithium tantalate today?
SAW devices account for 57.14% of 2024 demand, driven by 5G radio-frequency filters.
Why are near-stoichiometric crystals attracting attention?
They show higher laser-damage thresholds and are forecast to grow at 8.31% CAGR, appealing to ultraviolet nonlinear-optics and high-speed modulators.
What regions dominate crystal production?
Asia-Pacific holds 36.74% share thanks to integrated supply chains spanning Japan, China, and South Korea.
What is the main supply-chain risk?
Volatile tantalum ore supply from conflict-affected regions can disrupt wafer procurement and pricing.
How concentrated is supplier power?
The top five vendors control roughly 55% revenue, indicating moderate concentration with ongoing technology-driven competition.
Page last updated on:


