Lenalidomide Market Size and Share
Market Overview
| Study Period | 2020 - 2031 |
|---|---|
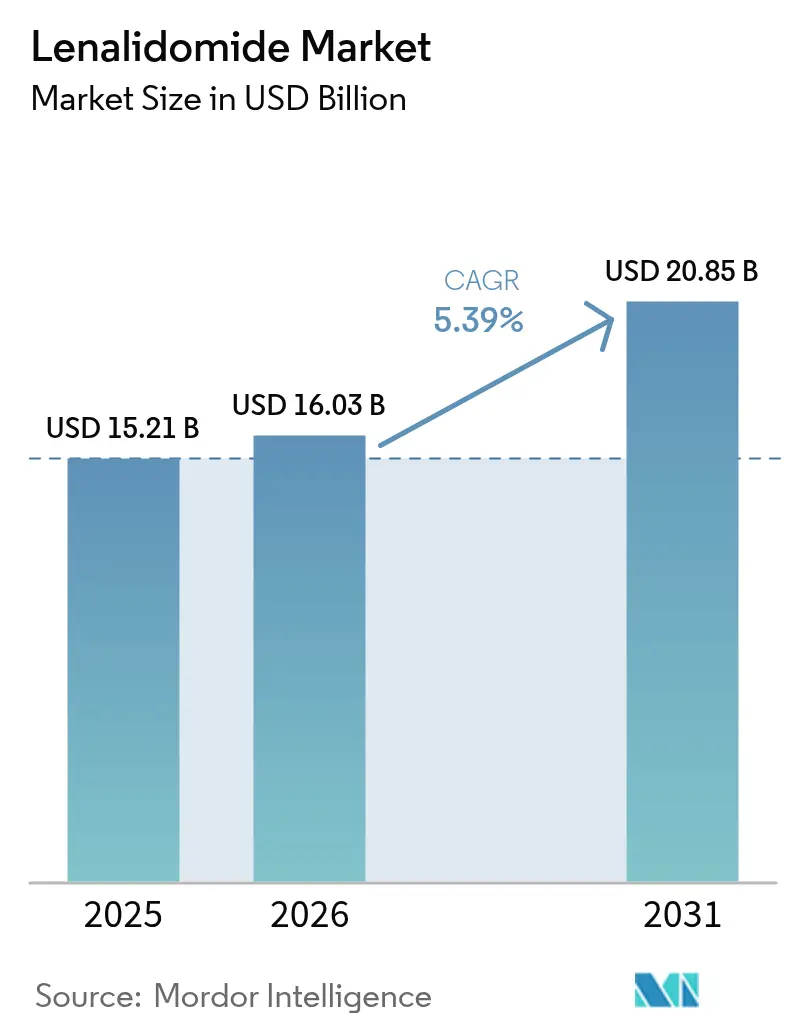
| Market Size (2026) | USD 16.03 Billion |
| Market Size (2031) | USD 20.85 Billion |
| Growth Rate (2026 - 2031) | 5.39% CAGR |
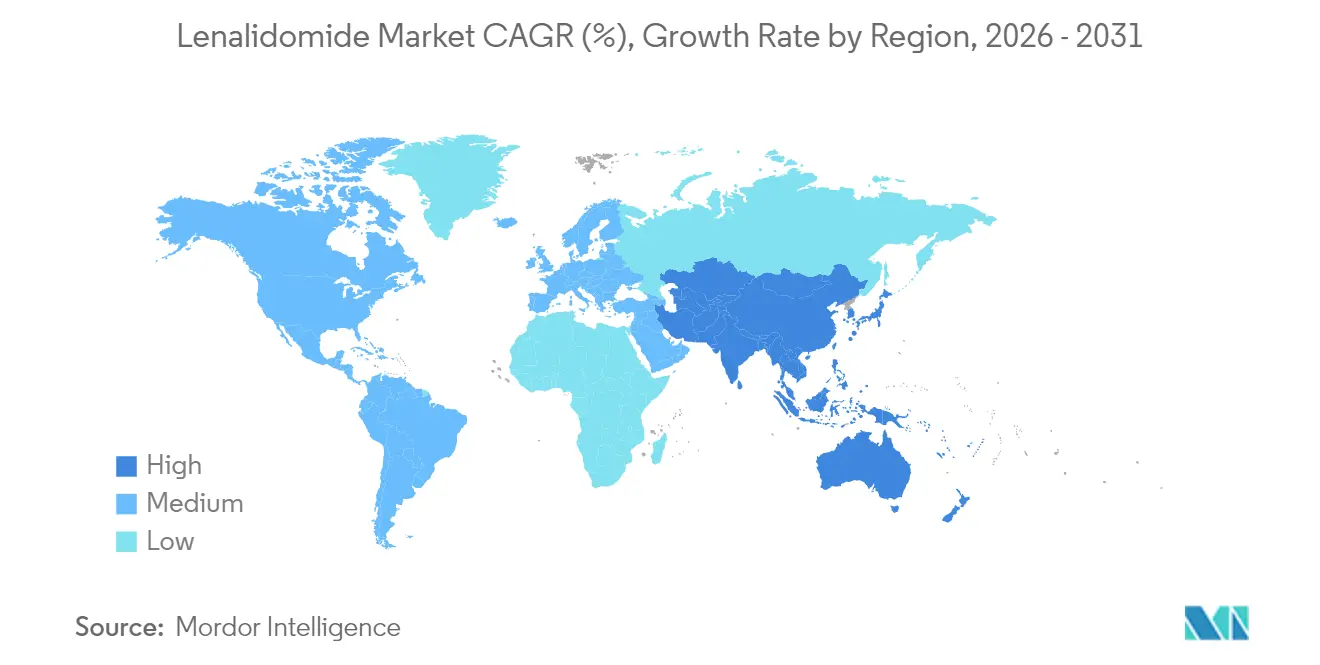
| Fastest Growing Market | Asia-Pacific |
| Largest Market | North America |
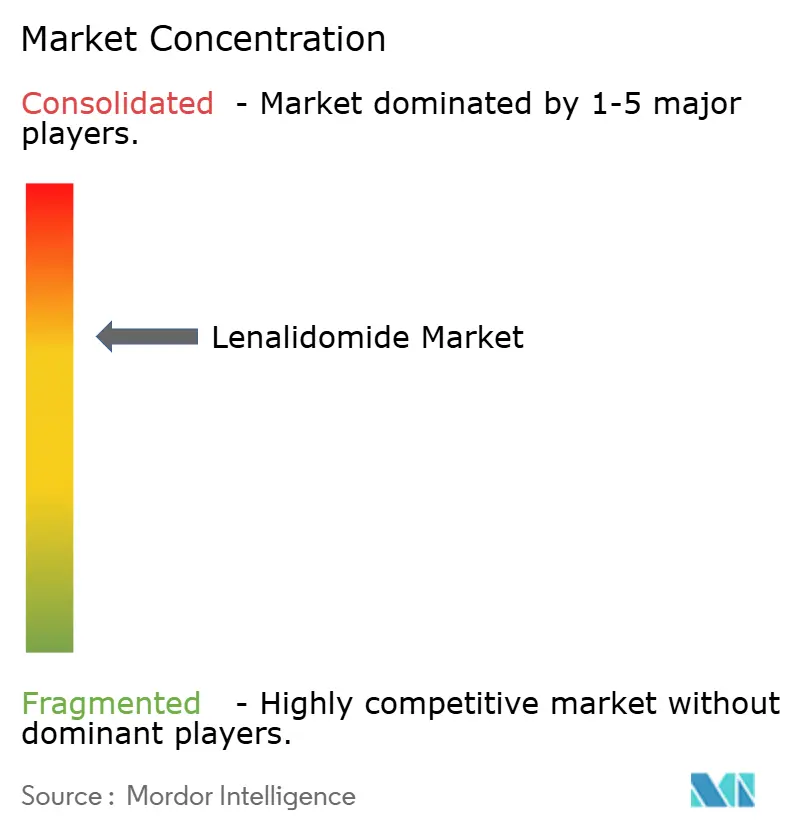
| Market Concentration | Medium |
Major Players
*Disclaimer: Major Players sorted in no particular order Image © Mordor Intelligence. Reuse requires attribution under CC BY 4.0. |
|
Lenalidomide Market Analysis by Mordor Intelligence
Lenalidomide market size in 2026 is estimated at USD 16.03 billion, growing from 2025 value of USD 15.21 billion with 2031 projections showing USD 20.85 billion, growing at 5.39% CAGR over 2026-2031. Multiple myeloma remains the primary driver of revenue, yet the therapeutic footprint now extends to mantle cell lymphoma, chronic lymphocytic leukemia, and selected myelodysplastic syndromes. Generic entry after the 2022 patent cliff introduces price pressure, but broader affordability is widening geographic access and treatment duration. Quadruplet induction regimens that embed lenalidomide alongside monoclonal antibodies, proteasome inhibitors, and corticosteroids reinforce demand, while emerging bispecific antibodies and CELMoDs signal future substitution risk. Hospital‐based distribution still dominates, although e-pharmacy platforms that satisfy REMS monitoring see double-digit growth in prescription volumes.
Key Report Takeaways
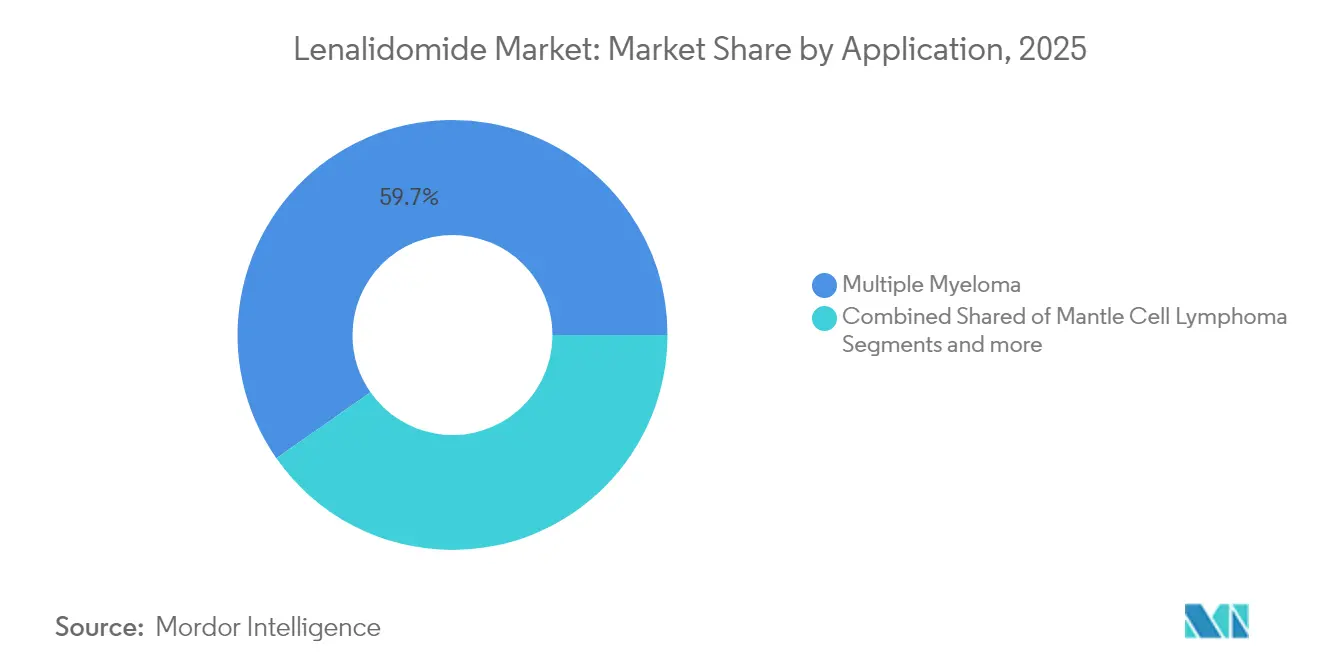
- By application, multiple myeloma led with 59.72% revenue share in 2025; mantle cell lymphoma is projected to expand at a 5.93% CAGR through 2031.
- By dosage strength, 25 mg captured 34.83% of the lenalidomide market share in 2025, whereas the 2.5 mg strength is forecast to grow at 6.12% CAGR to 2031.
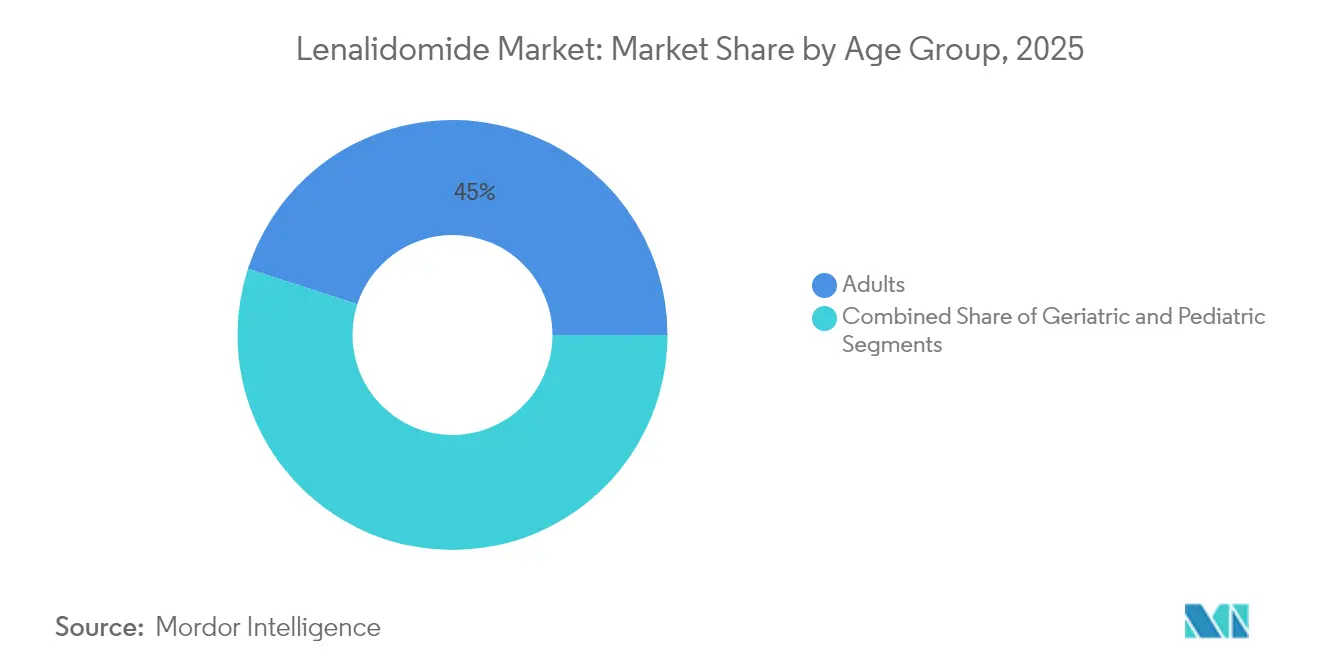
- By age group, the adult cohort accounted for a 45.02% share of the lenalidomide market size in 2025, and the geriatric cohort is advancing at a 6.3% CAGR through 2031.
- By distribution channel, hospital pharmacies held 56.78% of 2025 revenue; online pharmacies register the highest CAGR at 6.42% through 2031.
- By geography, North America commanded 40.35% of 2025 revenue, while Asia-Pacific is set to rise at a 6.28% CAGR to 2031.
Note: Market size and forecast figures in this report are generated using Mordor Intelligence’s proprietary estimation framework, updated with the latest available data and insights as of 2026.
Global Lenalidomide Market Trends and Insights
Drivers Impact Analysis*
| Driver | (~) % Impact on CAGR Forecast | Geographic Relevance | Impact Timeline |
|---|---|---|---|
| Rising global incidence of multiple myeloma and related cancers | +1.2% | Highest influence in North America and Europe | Long term (≥ 4 years) |
| Expanding label indications, including lymphomas and maintenance therapy | +0.9% | Early uptake in developed markets | Medium term (2-4 years) |
| Generics driving affordability and wider access | +1.1% | Core impact in Asia-Pacific; spill-over to Latin America and MEA | Short term (≤ 2 years) |
| Integration into standard triplet and quadruplet treatment regimens | +0.8% | North America and EU first; spreading to Asia-Pacific | Medium term (2-4 years) |
| Tele-oncology and e-pharmacy channels broadening REMS-drug reach | +0.4% | Global, with fastest growth in post-COVID markets | Short term (≤ 2 years) |
| Patient-assistance and donation programs in LMICs accelerating uptake | +0.6% | Asia-Pacific, Latin America, MEA | Long term (≥ 4 years) |
| Source: Mordor Intelligence | |||
Rising Global Incidence of Multiple Myeloma & Related Blood Cancers
Incidence rates for plasma-cell malignancies continue to climb in aging populations, anchoring sustained demand for lenalidomide-based therapy. In North America and Europe, guideline updates position continuous maintenance as a cornerstone of early-line management, leading to prolonged treatment durations. Epidemiologic expansion aligns with rising geriatric cohorts, many of whom remain on therapy beyond 24 months when tolerated. This demographic pattern supports consistent volume growth across mature reimbursement systems and heightens the strategic importance of dose optimization for frail patients [1]Brian Durie, “How I Treat Multiple Myeloma in Geriatric Patients,” Blood, ashpublications.org.
Expanding Label Indications, Including Lymphomas and Maintenance Therapy
Regulatory authorities have broadened lenalidomide use into mantle cell lymphoma and certain lymphomas that relapse after anti-CD20 therapy. The United States Food and Drug Administration cleared isatuximab with lenalidomide for transplant-ineligible multiple myeloma in 2024, reaffirming its versatility in combination protocols. Such approvals diversify revenue streams and reduce reliance on a single disease state.
Availability of Generics Driving Affordability and Wider Access
Following patent expiry, tier-one manufacturers in India, Israel, and the United States launched volume-limited generics that preserve price integrity in the short term while establishing future supply chains. In Asia-Pacific, where payer budgets remain constrained, early generic penetration is widening patient reach, and once volume caps lapse in 2026, deeper discounts are expected to catalyze uptake in public oncology programs.
Integration into Standard Triplet/Quadruplet Treatment Regimens
The PERSEUS trial confirmed the superiority of daratumumab-lenalidomide-bortezomib-dexamethasone over triplet therapy, with 48-month progression-free survival of 84.3% versus 67.7%. Guideline bodies in the United States and Europe now recommend quadruplet induction, ensuring recurrent use of lenalidomide during induction and maintenance, which locks in volume even amid price erosion.
Restraints Impact Analysis*
| Restraint | (~) % Impact on CAGR Forecast | Geographic Relevance | Impact Timeline |
|---|---|---|---|
| Severe side-effects and REMS burden | -0.7% | Global, highest administrative burden in USA | Medium term (2-4 years) |
| Price erosion after patent expiry | -0.9% | North America and Europe first | Short term (≤ 2 years) |
| API supply-chain bottlenecks | -0.5% | Global, greatest exposure in Asia-Pacific | Short term (≤ 2 years) |
| Next-generation CELMoDs and bispecifics | -1.1% | Developed markets before global diffusion | Long term (≥ 4 years) |
| Source: Mordor Intelligence | |||
Severe Side-Effects and Stringent REMS Compliance Burden
Lenalidomide carries teratogenic risk that mandates a Risk Evaluation and Mitigation Strategy. Oncologists must coordinate pregnancy testing, counseling, and restricted dispensing, which adds workflow complexity. Peer-reviewed data show that 31.9% of maintenance patients discontinue within the first year owing to toxicities such as cytopenias and fatigue. Community clinics with limited staffing experience the greatest administrative strain, tempering uptake despite proven efficacy.
Next-Generation CELMoDs and Bispecifics Cannibalising Demand
Bispecific antibodies targeting BCMA reach overall response rates above 60% in lenalidomide-exposed or refractory patients, while CELMoDs such as mezigdomide exhibit synergistic effects when paired with these antibodies. As these modalities move earlier in the treatment sequence, they threaten to displace lenalidomide in frontline regimens over the long term [2]Anup Joseph Devasia, "Bispecific antibodies in the treatment of multiple myeloma," Blood Cancer Journal, nature.com.
*Our forecasts treat driver/restraint impacts as directional, not additive. The impact forecasts reflect baseline growth, mix effects, and variable interactions.
Segment Analysis
By Application: Multiple Myeloma Holds Lead as Lymphoma Uptake Accelerates
Multiple myeloma accounted for 59.72% of 2025 revenue and remains the anchor of the lenalidomide market. Regulatory endorsement of quadruplet induction ensures continued frontline use, while maintenance protocols secure extended dosing. Mantle cell lymphoma, though smaller in absolute dollars, posts a 5.93% CAGR through 2031 as combination studies with rituximab and ibrutinib advance into clinical guidelines. Continued trial activity in chronic lymphocytic leukemia could further diversify indications if safety remains acceptable.
Broader application drives incremental volume but also heightens competitive complexity, as biologic agents increasingly aim for the same patient pools. Even so, physicians favor lenalidomide for del(5q) myelodysplastic syndromes, reinforced by major hematologic response in real-world registries. These application trends underscore why the lenalidomide market size attached to oncology indications remains resilient, even while generics pressure average selling prices.


By Dosage Strength: Lower-Dose Regimens Gain Traction
The 25 mg capsule remained the most prescribed strength in 2025 with 34.83% of revenue. High-dose induction remains standard, yet real-world practice increasingly shifts to 15 mg, 10 mg, or 5 mg maintenance to balance efficacy and tolerability. The 2.5 mg format posts a 6.12% CAGR as clinicians adopt micro-dosing for frail or renal-impaired patients. Evidence from multinational trials supports modified dosing without compromising response, fueling demand for dose-diverse generics.
Manufacturers compete on capsule assortment breadth and packaging efficiencies. Once generic supply constraints ease, competitive bids for public tenders are expected to widen access to every dose tier. As a result, the lenalidomide market size tied to low-strength capsules should expand faster than the top-line market.
By Age Group: Geriatric Cohort Expands Patient Volume
Adults remain the single largest consumer bloc, generating 45.02% of the lenalidomide market size, but geriatric patients now generate the fastest unit growth at a 6.3% CAGR. Growing life expectancy and refined frailty scoring support lenalidomide use with attenuated dosing schedules. European consensus panels recommend simplified steroid backbones and oral-only regimens to sustain quality of life, advancing acceptance among geriatric oncologists.
The pediatric share is negligible and remains largely investigational because of limited safety data. Consequently, commercial focus gravitates toward formulation tweaks that assist swallowing and adherence in older patients. This demographic dynamic underpins nearly half of the lenalidomide market share, with long-term therapy duration magnifying cumulative volume.
By Distribution Channel: E-Pharmacy Ecosystem Gains Momentum
Hospital pharmacies controlled 56.78% of 2025 revenue thanks to mandatory REMS documentation and oncology center formularies. Yet online dispensaries that integrate electronic REMS checks with tele-oncology visits record 6.42% CAGR growth. Technology investments by specialty platforms now allow remote counseling, automated pregnancy test reminders, and temperature-controlled delivery, removing logistical bottlenecks.
Retail pharmacies hold a minor but stable role where national regulators permit community dispensing under pharmacist certification. As payer policies push chronic therapies into home settings, digital channels should capture incremental scripts, aligning with consumer preference for mail-order convenience. This shift will broaden the lenalidomide market as digital networks cut access time in underserved regions.
Geography Analysis
North America commanded 40.35% of 2025 revenue. Comprehensive insurance coverage and early adoption of quadruplet induction regimens underpin market leadership. However, 2025 Medicare Part D formulary exclusions for Revlimid create headwinds that may accelerate the switch to less expensive generics for eligible seniors. Price renegotiations after 2026 are expected to unlock stronger volume in value-based payment models.
Asia-Pacific delivers the highest growth at 6.28% CAGR to 2031. China’s 2024 approval of first-line lenalidomide regimens and provincial reimbursement will add thousands of new patients annually. In India, vertically integrated API production supports stable supply and competitive tender pricing in public hospitals. Japan’s super-aged society and adoption of oral proteasome inhibitor-lenalidomide combinations also bolster demand, offsetting sporadic supply constraints during global API shortages.
Europe remains a mid-single-digit growth territory. Generic launches across the region in 2022 triggered rapid conversion from branded to biosimilar-equivalent offerings GaBI. Centralized procurement in markets such as the United Kingdom accelerated savings by switching patients to generics while maintaining clinical outcomes. Nonetheless, pharmacists monitor potential API sourcing risks as new Chinese export controls tighten supply audits.

Competitive Landscape
The lenalidomide market shows moderate consolidation. Bristol Myers Squibb remains a weighted player through brand equity and combination-therapy development, yet its patent cliff opened gates for generics from Teva, Dr. Reddy’s, Cipla, and Amneal. Early generic launches feature volume-limited agreements that temper price declines but also secure footholds for future unrestricted entry.
Leading generics leverage cost leadership and backward-integrated API manufacturing to win supply contracts, while branded incumbents invest in new indication trials and novel delivery formats, including once-weekly dosing capsules. Strategic collaboration centers on value-based access in low- and middle-income economies. Bristol Myers Squibb’s ASPIRE program seeks to seed branded or hybrid products at differential pricing and local packaging to maintain presence BMS.
Disruptive pressure from BCMA-directed bispecifics grows. Companies such as Janssen and Pfizer obtained accelerated approvals for teclistamab and elranatamab, which show high response in lenalidomide-refractory populations. Meanwhile, innovators advance CELMoDs with higher cereblon affinity to surpass lenalidomide’s potency ceiling. Investment in digital supply-chain analytics also rises, as firms aim to predict demand and avoid shortages during fluctuating reimbursement cycles.
Lenalidomide Industry Leaders
-
Sandoz
-
Dr. Reddy’s Laboratories
-
Bristol-Myers Squibb Company
-
Teva Pharmaceutical Industries
-
Cipla Ltd
- *Disclaimer: Major Players sorted in no particular order

Recent Industry Developments
- May 2025: China’s National Medical Products Administration approved the use of tafasitamab (Minjuvi) plus lenalidomide, followed by tafasitamab on its own, for adults with relapsed or refractory diffuse large B-cell lymphoma who are not eligible for an autologous stem-cell transplant, according to developer InnoCare Pharma.
- February 2025: Amneal Pharmaceuticals received FDA approval for lenalidomide capsules across six strengths, with launch slated for Jan 2026.
- October 2024: Mexico’s health authority COFEPRIS authorised the same tafasitamab-lenalidomide combination, followed by tafasitamab maintenance, for adults with relapsed or refractory diffuse large B-cell lymphoma who cannot undergo an autologous stem-cell transplant.
- May 2024: Bristol Myers Squibb unveiled a 10-year ASPIRE plan to expand access to lenalidomide in low- and middle-income countries via direct import and local branding


Research Methodology Framework and Report Scope
Market Definitions and Key Coverage
Our study, according to Mordor Intelligence, defines the lenalidomide market as global prescription and generic sales of lenalidomide across all dosage strengths and labeled or guideline-backed hematological indications, tracked at ex-manufacturer prices flowing through hospital, retail, and specialty pharmacy channels.
Scope exclusion: Pipeline CELMoDs such as iberdomide and mezigdomide, plus any companion diagnostic revenues, are kept outside the numbers.
Segmentation Overview
-
By Application
- Multiple Myeloma
- Myelodysplastic Syndromes (MDS)
- Mantle Cell Lymphoma
- Follicular & Marginal-Zone Lymphoma
- Chronic Lymphocytic Leukemia
- Other Applications
-
By Dosage Strength
- 2.5 mg
- 5 mg
- 10 mg
- 15 mg
- 25 mg
- Others
-
By Age Group
- Adults
- Geriatric
- Pediatric
-
By Distribution Channel
- Hospital Pharmacies
- Retail Pharmacies
- Online Pharmacies
-
By Geography
-
North America
- United States
- Canada
- Mexico
-
Europe
- Germany
- United Kingdom
- France
- Italy
- Spain
- Russia
- Rest of Europe
-
Asia-Pacific
- China
- Japan
- India
- Australia
- South Korea
- Rest of Asia-Pacific
-
Middle East and Africa
- GCC
- South Africa
- Rest of Middle East and Africa
-
South America
- Brazil
- Argentina
- Rest of South America
-
North America
Detailed Research Methodology and Data Validation
Primary Research
Mordor analysts interviewed hematologists, oncology pharmacists, and generic-portfolio managers across North America, Europe, and key Asia-Pacific markets. These conversations clarified real-world line-of-therapy shares, discounting behavior after patent expiry, and expected generic uptake curves that desktop sources rarely capture in time.
Desk Research
We began with structured keyword pulls from tier-1 bodies such as the FDA Orange Book, EMA EPAR database, and WHO ATC consumption files, then layered usage statistics from cancer registries like SEER and Globocan. Industry-wide shipment trends were cross-checked in UN Comtrade, while health-expenditure baselines came from World Bank and OECD datasets.
To enrich commercial context, our team accessed company 10-Ks, investor decks, and prescribing-guideline updates, and pulled capsule ASP references from D&B Hoovers and Dow Jones Factiva price stories. The sources cited are illustrative only; many additional public and paid references informed data cleaning and validation.
Market-Sizing & Forecasting
One top-down build marries treated-patient pools (incidence × treatment penetration × average cycles) with country-level weighted ASPs, which are then sense-checked through selective bottom-up supplier roll-ups and channel checks. Core variables, generic penetration rate, average capsule price erosion, multiple myeloma prevalence, vial-to-cycle conversion, and therapy duration shifts anchor each annual datapoint. Forecasts rely on multivariate regression blended with scenario analysis to capture policy shocks and competitive launches. Gaps in granular bottom-up inputs are bridged by calibrated proxies from matched reference markets.
Data Validation & Update Cycle
Model outputs pass three-layer variance scans, peer review, and anomaly flags before sign-off. Reports refresh every twelve months, with interim revisions if sizable regulatory or pricing events occur. A final analyst sweep is done just before release.
Why Mordor's Lenalidomide Baseline Commands Reliability
Published figures often differ because firms pick unequal scopes, discount curves, and refresh cadences, and because not every player revalidates assumptions after generics land.
Key gap drivers include: some studies roll secondary CELMoDs into totals, others apply flat global ASPs without adjusting for tiered pricing, and a few rely on once-per-cycle dose counts that understate annualized spend when dose reductions occur. Mordor's model incorporates indication-specific dosing patterns, post-2022 generic entry erosion, and annual currency resets, which together narrow variance.
Benchmark comparison
| Market Size | Anonymized source | Primary gap driver |
|---|---|---|
| USD 15.21 B (2025) | Mordor Intelligence | - |
| USD 12.79 B (2025) | Global Consultancy A | Omits hospital mark-ups and uses single ASP for all regions |
| USD 14.08 B (2025) | Sector Specialist B | Includes pipeline CELMoDs within revenue pool |
| USD 19.58 B (2024) | Market Analytics C | Applies incidence-only growth without price-erosion factor |
Taken together, the comparison shows that our disciplined scope selection and annually refreshed variables deliver a balanced, transparent baseline that decision-makers can track and replicate with confidence.


Key Questions Answered in the Report
How large is the lenalidomide market today?
The lenalidomide market size is USD 16.03 billion in 2026 and is projected to reach USD 20.85 billion by 2031 at a 5.39% CAGR.
Which application segment drives the bulk of revenue?
Multiple myeloma accounts for 59.72% of 2025 revenue, well ahead of other hematologic malignancies.
Why are lower-dose capsules growing fastest?
Clinicians increasingly favor 2.5 mg to 10 mg maintenance dosing to balance efficacy and tolerability, which explains the 6.12% CAGR forecast for the 2.5 mg strength.
What region presents the strongest growth outlook?
Asia-Pacific is projected to expand at 6.28% CAGR through 2031, driven by regulatory approvals, generic affordability, and rising disease awareness.
How will generic competition affect pricing?
Volume-limited agreements keep early price erosion moderate, but once restrictions lapse in 2026, deeper discounts are expected, especially in public tenders.
Which emerging therapies pose the greatest threat to lenalidomide?
BCMA-targeted bispecific antibodies and next-generation CELMoDs show higher response rates in refractory patients and could take share as they move into earlier treatment lines.
Page last updated on:


