Land Survey Equipment Market Size and Share
Market Overview
| Study Period | 2020 - 2031 |
|---|---|
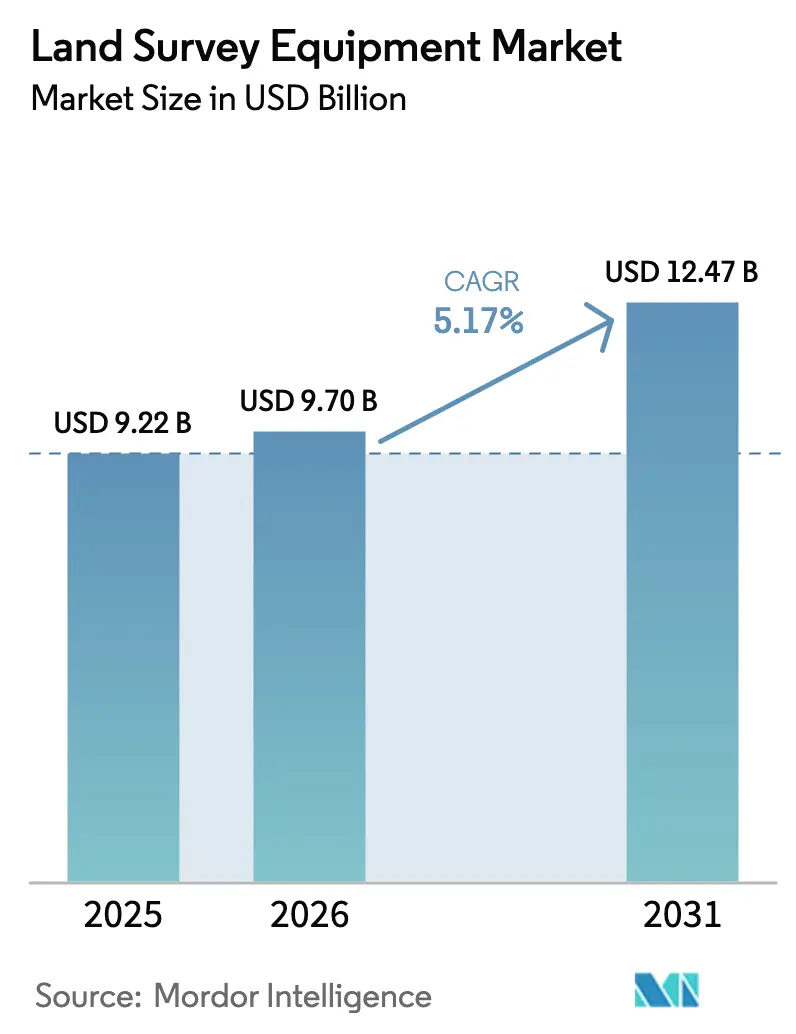
| Market Size (2026) | USD 9.7 Billion |
| Market Size (2031) | USD 12.47 Billion |
| Growth Rate (2026 - 2031) | 5.17% CAGR |
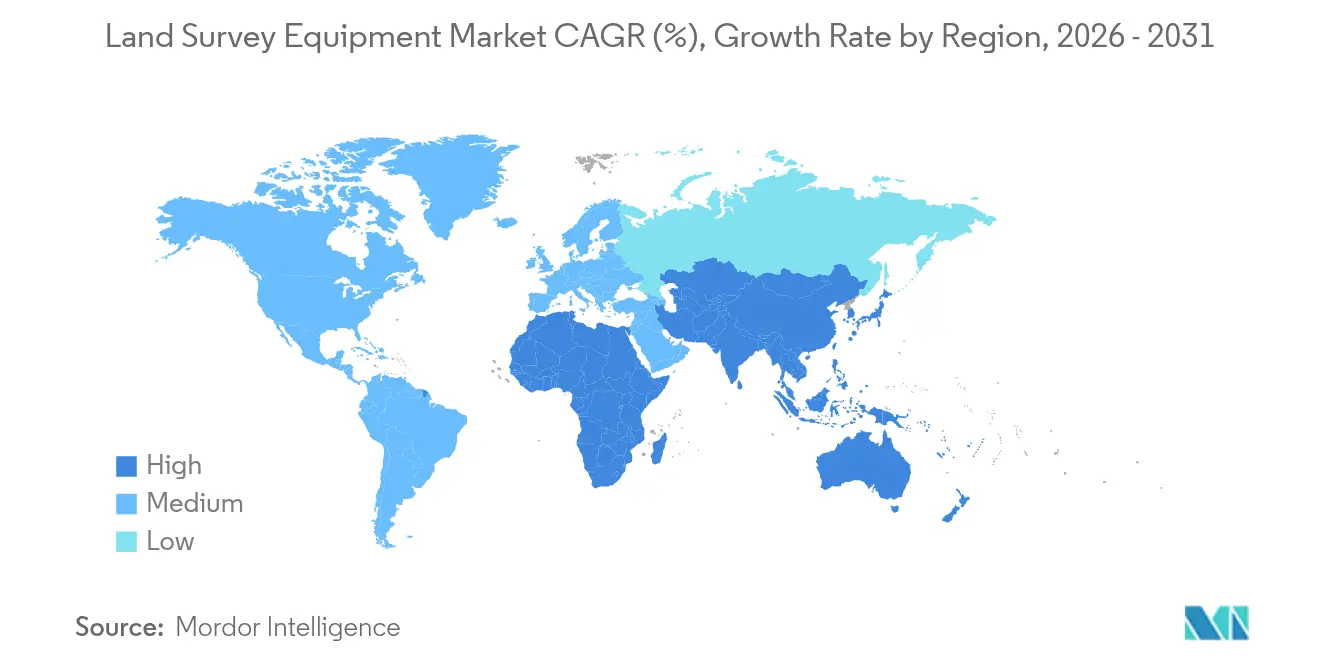
| Fastest Growing Market | Middle East and Africa |
| Largest Market | Asia Pacific |
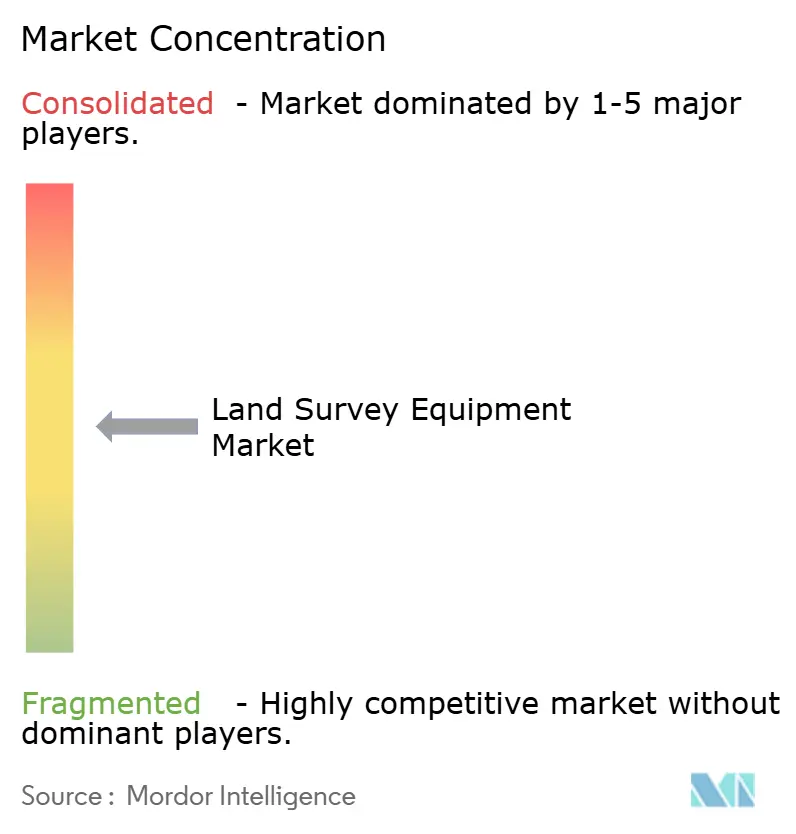
| Market Concentration | Medium |
Major Players *Disclaimer: Major Players sorted in no particular order Image © Mordor Intelligence. Reuse requires attribution under CC BY 4.0. | |
Land Survey Equipment Market Analysis by Mordor Intelligence
The land survey equipment market size is expected to grow from USD 9.22 billion in 2025 to USD 9.7 billion in 2026 and is forecast to reach USD 12.47 billion by 2031 at 5.17% CAGR over 2026-2031. Hardware retained a dominant 60.4% revenue share in 2024, yet services showed the sharpest momentum with a 10.8% CAGR outlook to 2030, signaling demand for subscription-based workflows and continuous data analytics. Total stations led technology demand with 34.2% share, but UAV/drone-LiDAR platforms recorded the fastest 22.1% CAGR, changing how large-area mapping and hazardous-site inspections are executed. Construction and infrastructure represented 42.3% of 2024 end-user spending, supported by public investments in smart transport corridors, while agriculture and forestry gained traction through precision-farming needs. Regionally, Asia-Pacific held a 38.5% share in 2024 on the back of China’s Belt and Road projects and Japan’s digital transformation agenda, whereas the Middle East and Africa promised the fastest 8.7% CAGR as Saudi Arabia’s Vision 2030 and UAE rail programs accelerated demand.
Key Report Takeaways
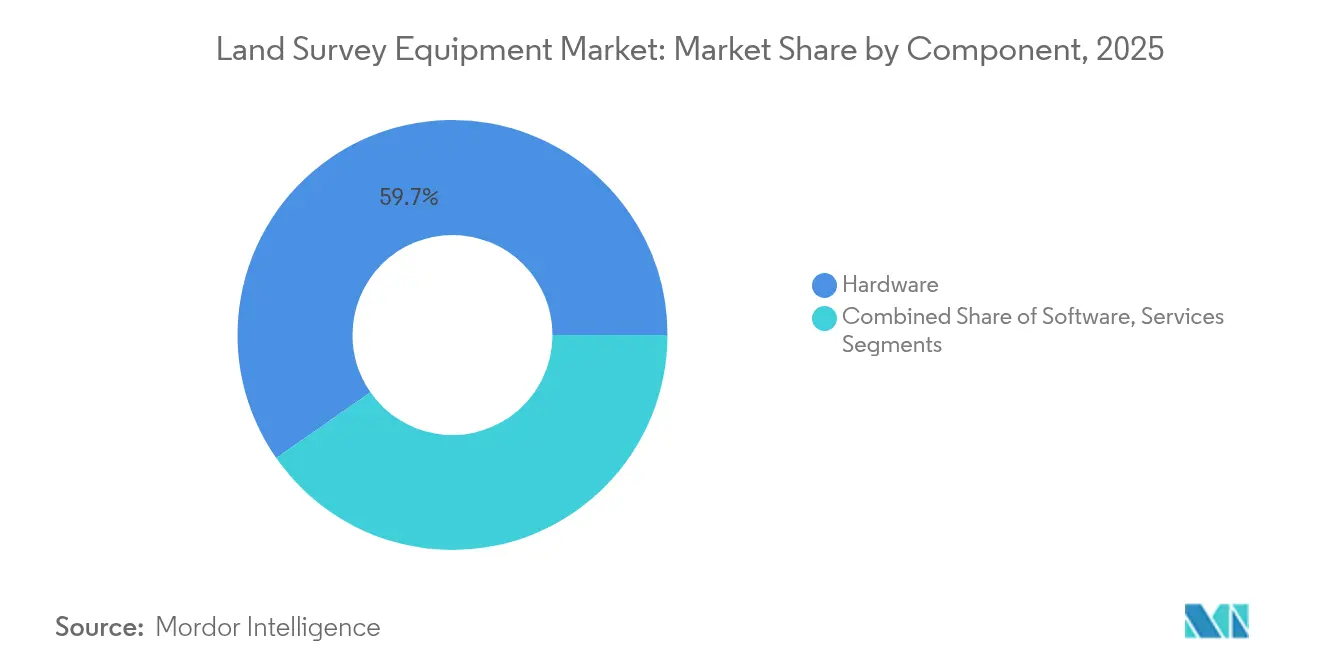
- By component, hardware led with 59.70% of 2025 revenue, while services are forecast to grow at 10.55% CAGR to 2031.
- By technology, total stations accounted for 33.80% of 2025 revenue; UAV/drone-LiDAR systems are projected to rise at a 21.2% CAGR through 2031.
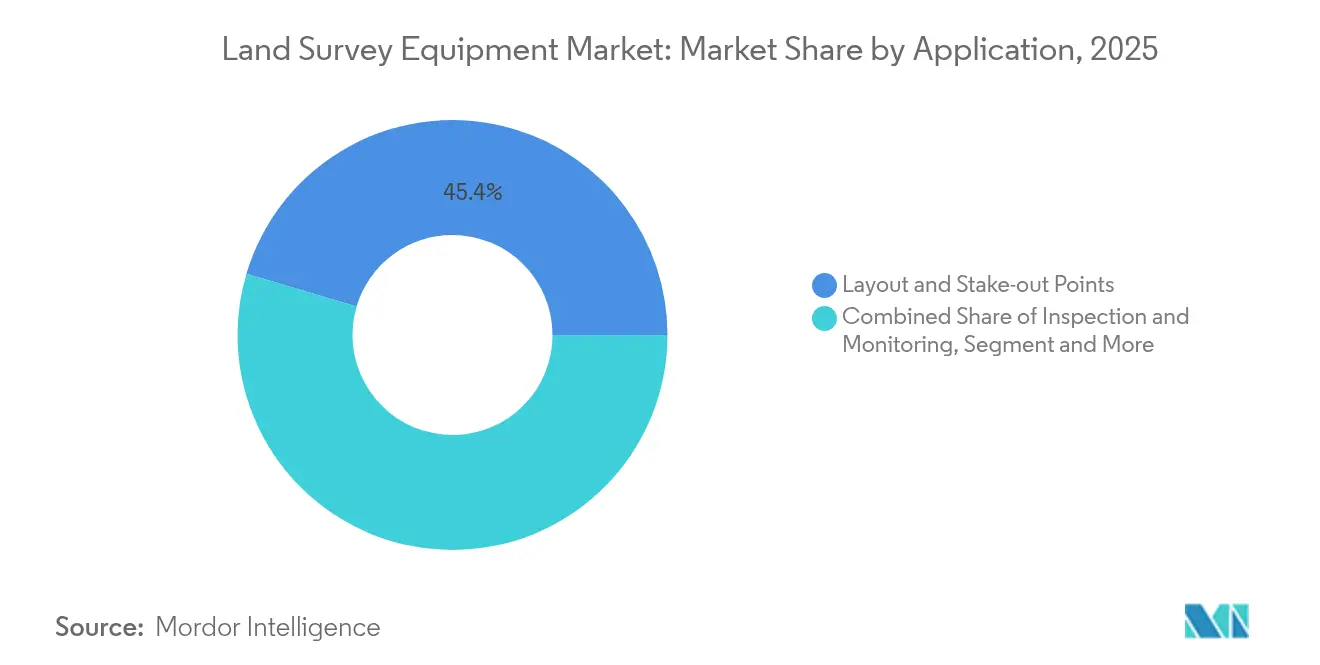
- By application, construction and infrastructure held 45.40% of 2025 demand; disaster and emergency mapping is anticipated to expand at 12.9% CAGR to 2031.
- By end-user industry, construction and infrastructure dominated 2025 with 41.65% share; agriculture and forestry are set for a 9.25% CAGR to 2031.
- By geography, Asia-Pacific captured 38.10% of 2025 revenue; the Middle East and Africa are expected to post the fastest 8.60% CAGR through 2031.
Note: Market size and forecast figures in this report are generated using Mordor Intelligence’s proprietary estimation framework, updated with the latest available data and insights as of 2026.
Global Land Survey Equipment Market Trends and Insights
Drivers Impact Analysis*
| Driver | (~) % Impact on CAGR Forecast | Geographic Relevance | Impact Timeline |
|---|---|---|---|
| Government investments in infrastructure modernization | +1.4% | Global; APAC core, spill-over to MEA | Medium term (2-4 years) |
| Rapid urbanization and industrial growth in developing nations | +1.1% | APAC, Middle East, Africa | Long term (≥ 4 years) |
| Growing adoption of UAV-enabled surveying workflows | +0.9% | Global; Early in US, Japan, China | Short term (≤ 2 years) |
| AI-driven cloud post-processing unlocks subscription revenues | +0.7% | North America, EU, Japan | Medium term (2-4 years) |
| Hardware-as-a-Service models reduce up-front capex | +0.4% | Global | Short term (≤ 2 years) |
| Demand for cm-level accuracy to enable autonomous construction robots | +0.3% | North America, Japan, Germany | Long term (≥ 4 years) |
| Source: Mordor Intelligence | |||
Government investments in infrastructure modernization
Public spending accelerated demand for advanced equipment as agencies required millimeter-level accuracy for rail, road, and utilities projects. Japan’s Ministry of Land, Infrastructure, Transport and Tourism embedded robotic total stations and GNSS receivers into the Tokyo Outer Ring Road expansion, setting a benchmark for digital delivery standards. [1]Ministry of Land, Infrastructure, Transport and Tourism, “Infrastructure DX Action Plan 2024,” mlit.go.jp Saudi Arabia’s Vision 2030 allocated USD 1.1 trillion to mega-projects such as NEOM, boosting orders for drone-LiDAR and real-time monitoring systems. Procurement cycles shortened as policymakers recognized that delayed survey data inflated project costs, favoring vendors offering integrated hardware-software bundles with predictable subscription pricing.
Rapid urbanization and industrial growth in developing nations
Cities in China, India, and Southeast Asia witnessed intensive construction that required precise layout and cadastral mapping. China’s construction machinery exports climbed 34% in 2024, supporting Belt and Road corridors and spurring downstream demand for GNSS-enabled workflows. Saudi Arabia’s NEOM blueprint for 9 million residents further illustrated how urban megaprojects rely on high-resolution terrain modeling. Municipalities increasingly skipped legacy transit surveys, moving directly to cloud-connected ecosystems, thereby unlocking opportunities for vendors targeting green-field markets.
Growing adoption of UAV-enabled surveying workflows
UAVs redefined field operations by collecting centimeter-level data over 2–3 km² per flight, cutting project timelines by up to 55%. The U.S. Geological Survey’s 2035 spatial-data plan prioritized drones for disaster response and land-use monitoring. DJI’s Mavic 3E and Matrice 350 RTK delivered RTK accuracy for cadastral mapping, increasing safety for mining firms surveying unstable slopes. Regulatory bodies eased beyond-visual-line-of-sight approvals, accelerating uptake across agriculture, infrastructure, and energy sectors.
AI-driven cloud post-processing unlocks subscription revenues
Vendors shifted value from hardware sales to recurring cloud analytics. Hexagon’s Reality Cloud Studio and Trimble’s Access v2024.00 enabled rapid visualization of terabyte-scale point clouds, raising Trimble’s recurring revenue by 17% in Q1 2025. Subscription models reduced capital outlays for small and medium contractors while providing vendors with predictable cash flows. Interoperability with BIM and IoT platforms became a purchase criterion, prompting alliances between equipment suppliers and software firms.
Restraints Impact Analysis*
| Restraint | (~) % Impact on CAGR Forecast | Geographic Relevance | Impact Timeline |
|---|---|---|---|
| Lack of skilled survey professionals and high initial costs | -1.2% | Global; most acute in US, EU, APAC | Medium term (2-4 years) |
| Stringent public-sector procurement cycles | -0.7% | North America, EU, Middle East | Long term (≥ 4 years) |
| High maintenance and calibration expenditure | -0.5% | Global | Short term (≤ 2 years) |
| 5G spectrum re-allocation causing GNSS interference risk | -0.4% | Global; urban centers | Medium term (2-4 years) |
| Source: Mordor Intelligence | |||
Lack of skilled survey professionals and high initial costs
In 2024, 94% of U.S. construction firms reported difficulty hiring qualified surveyors, which stretched project timelines and operational budgets. [2]Associated General Contractors of America, “New Survey Shows How Nation’s Failure to Invest in Construction Education & Training Programs Makes It Hard for Firms to Build,” agc.org Early retirements and limited training capacity deepened the talent gap, compelling firms to adopt automation and cloud workflows that reduce field crews. Up-front expenditure for robotic total stations or multi-frequency GNSS receivers remained significant, although hardware-as-a-service offerings lowered entry barriers for smaller contractors.
High maintenance and calibration expenditure
Annual maintenance for permanent GNSS stations exceeded USD 30,000, affecting total cost of ownership for infrastructure owners. Complex calibration schedules for laser-based instruments added downtime costs. Vendors responded with remote diagnostic features and extended-warranty bundles, yet the expense continued to deter cash-constrained municipalities and small enterprises.
*Our forecasts treat driver/restraint impacts as directional, not additive. The impact forecasts reflect baseline growth, mix effects, and variable interactions.
Segment Analysis
By Component: Hardware Sustained Dominance while Services Accelerate
Hardware commanded USD 5.51 billion in 2025, equivalent to 59.70% of the land survey equipment market, as operators required rugged total stations, GNSS receivers, and laser scanners for daily operations. This share remained stable due to replacement cycles and new installations across rail and energy corridors. The services segment, including calibration, data processing, and cloud-hosting, is projected to eclipse USD 3.06 billion by 2031 at 10.55% CAGR. The land survey equipment market size for services aligned with rising demand from firms seeking OPEX-friendly models. Vendors such as Trimble bundled hardware leasing with cloud analytics, reducing downtime and smoothing project cash flows.
In parallel, hardware-as-a-service subscriptions proliferated among regional contractors and agriculture cooperatives, shifting expenditure from capital budgets to operational accounts. Advanced self-diagnostic capabilities further bolstered service adoption, as remote firmware updates and predictive maintenance minimized field interruptions. The transition aligned with broader construction-tech trends where continuous data ingestion is more valuable than standalone instruments.


By Technology/Equipment Type: Drone-LiDAR Ascended
Total stations retained the largest slice of 2025 revenue at 33.80%, benefiting from automation features like robotic tracking and scanning. Their embedded imaging sensors shortened layout tasks and improved as-built verification. However, UAV/drone-LiDAR platforms were projected to expand at 21.2% CAGR, the fastest across all equipment types. The land survey equipment market share for UAV/drone-LiDAR solutions reached 12.80% in 2025, riding on demand for large-area mapping in mining and forestry.
GNSS receivers diversified with multi-constellation, multi-frequency capabilities, enhancing redundancy against urban multipath and atmospheric disturbances. 3-D laser scanners gained traction in underground utilities mapping, benefitting from integrated inertial measurement units. Vendors invested in miniaturization, which allowed mounting scanners on excavators and autonomous robots, establishing feedback loops between construction equipment and digital twins.
By Application: Disaster Mapping Gained Urgency
Construction layout and stake-out tasks generated 45.40% of 2025 spending given regulatory mandates for positional accuracy on built assets. Yet disaster and emergency mapping exhibited 12.9% CAGR potential to 2031 as climate-related incidents intensified. The land survey equipment market size for disaster management applications was valued at USD 1.04 billion in 2025 and is set to double by 2031. Public agencies adopted drone-LiDAR and GNSS rapid-response kits for post-event terrain modeling, improving relief logistics.
Volumetric calculations in mining and quarrying continued to rely on laser scanning and UAV photogrammetry, driving productivity gains and safety compliance. Cadastral mapping leveraged GNSS and photogrammetry to support land titling reforms in developing nations, while inspection workflows benefited from mobile mapping vehicles in highway asset management.
By End-User Industry: Precision Agriculture Rose
Construction and infrastructure stakeholders held 41.65% of revenue in 2025 due to mandates tied to public works. However, agriculture and forestry registered a 9.25% CAGR trajectory as farmers adopted RTK-based guidance to optimize seeding, spraying, and harvesting. The land survey equipment market size for agriculture and forestry was USD 1.01 billion in 2025, underpinned by subsidy programs promoting smart-farming technology.
Energy and power utilities expanded LiDAR scanning of transmission corridors for vegetation management, whereas mining operators embedded GNSS rovers on autonomous haul trucks. Oil and gas players invested in pipeline integrity surveys combining inertial and laser scanning to meet stricter environmental controls.
Geography Analysis
Asia-Pacific dominated in 2025 with 38.10% revenue share, translating into USD 3.51 billion of the land survey equipment market. The region benefited from China’s Belt and Road corridors and Japan’s infrastructure DX program, both of which demanded high-precision geospatial datasets. Government grants accelerated the deployment of permanent GNSS networks, improving RTK corrections across remote areas.
The Middle East and Africa recorded the fastest 8.60% CAGR outlook, with USD 1.43 billion revenue projected by 2031. Saudi Arabia’s NEOM, Diriyah Gate, and rail initiatives, paired with the UAE’s Etihad Rail Stage 2, fueled procurements of robotic total stations and UAV-LiDAR kits. African nations leveraged multilateral funding to map resource corridors and modernize cadastral systems.
North America and Europe remained technologically mature, focusing on interoperability and compliance. The U.S. Geological Survey’s National Spatial Data Infrastructure plan drove investments in open standards for point-cloud exchange, while the EU mandated BIM integration on public projects, creating pull-through demand for laser scanners and mobile mapping vans. These regions also faced acute labor shortages, stimulating automation and cloud adoption.

Competitive Landscape
The land survey equipment market featured moderate concentration, with Hexagon, Trimble, Topcon, and Leica Geosystems collectively controlling a significant but not dominant portion of global revenue. Hexagon allocated 10–12% of net sales to R&D and in January 2025 completed the acquisition of Septentrio, enhancing resilient positioning solutions. [4]Hexagon AB, “Year-End Report 1 January – 31 December 2024,” hexagon.com Trimble’s recurring-revenue model gained traction as contractors preferred bundled hardware, software, and cloud services.
Topcon heightened its lidar capabilities through a May 2025 alliance with FARO Technologies, integrating scanning workflows for construction verification. Leica Geosystems introduced the AP20 AutoPole in 2025, further automating field procedures.
Regional challengers surfaced in Asia-Pacific, capitalizing on government localization programs. Chinese firms promoted dual-band RTK receivers with embedded AI processors, targeting agriculture and forestry. Meanwhile, European startups focused on photogrammetry cloud engines optimized for 5G edge environments. Patent filings around real-time kinematic redundancy and AI-assisted point-cloud classification intensified, underlining the shift toward data-centric value propositions.
Land Survey Equipment Industry Leaders
Hexagon AB
Trimble Inc.
Topcon Corporation
CHC Navigation Technology Ltd.
Leica Geosystems AG
- *Disclaimer: Major Players sorted in no particular order

Recent Industry Developments
- June 2025: Topcon completed a management buyout backed by KKR and JIC Capital to accelerate growth in core geospatial segments.
- May 2025: Topcon and FARO Technologies agreed to co-develop integrated laser scanning solutions for construction and surveying.
- April 2025: Hexagon advanced the spin-off of its Asset Lifecycle Intelligence division, targeting a U.S. listing in 2026.
- March 2025: SingularXYZ rolled out the Sfaira One and X1 solution, bringing centimeter-level RTK to areas lacking CORS coverage.


Global Land Survey Equipment Market Report Scope
In the field of land surveying, the utilization of essential equipment guarantees precision and accuracy in mapping and delineating property boundaries. Surveying instruments are used to assist in measuring land, including vertical distance, horizontal distance, and volume of excavated material.
The land survey equipment market is segmented by component (hardware, software, service), by application (inspection and monitoring, volumetric calculations, layout points), by end-user (construction, energy and power, agriculture, disaster management, other end-users), by geography (North America, Europe, Asia-Pacific, Latin America, Middle East and Africa). The market sizes and forecasts are provided in terms of value (USD) for all the above segments.
| Hardware |
| Software |
| Services |
| Total Stations (Mechanical, Robotic, Scanning) |
| GNSS/GPS Receivers |
| 3-D Laser Scanners and LiDAR |
| UAV / Drone-based Systems |
| Levels, Theodolites and Accessories |
| Inspection and Monitoring |
| Volumetric Calculations |
| Layout and Stake-out Points |
| Topographic and Cadastral Mapping |
| Disaster Management and Emergency Response |
| Construction and Infrastructure |
| Energy and Power |
| Agriculture and Forestry |
| Mining and Quarrying |
| Oil and Gas |
| Others (Academia, Environmental, Defense) |
| North America | United States | |
| Canada | ||
| Mexico | ||
| South America | Brazil | |
| Argentina | ||
| Rest of South America | ||
| Europe | Germany | |
| France | ||
| Spain | ||
| Italy | ||
| Russia | ||
| Rest of Europe | ||
| Asia-Pacific | China | |
| India | ||
| Japan | ||
| Australia | ||
| Rest of Asia-Pacific | ||
| Middle East and Africa | Middle East | Saudi Arabia |
| United Arab Emirates | ||
| Turkey | ||
| Africa | South Africa | |
| Nigeria | ||
| Rest of Africa | ||
| By Component | Hardware | ||
| Software | |||
| Services | |||
| By Technology / Equipment Type | Total Stations (Mechanical, Robotic, Scanning) | ||
| GNSS/GPS Receivers | |||
| 3-D Laser Scanners and LiDAR | |||
| UAV / Drone-based Systems | |||
| Levels, Theodolites and Accessories | |||
| By Application | Inspection and Monitoring | ||
| Volumetric Calculations | |||
| Layout and Stake-out Points | |||
| Topographic and Cadastral Mapping | |||
| Disaster Management and Emergency Response | |||
| By End-user Industry | Construction and Infrastructure | ||
| Energy and Power | |||
| Agriculture and Forestry | |||
| Mining and Quarrying | |||
| Oil and Gas | |||
| Others (Academia, Environmental, Defense) | |||
| By Geography | North America | United States | |
| Canada | |||
| Mexico | |||
| South America | Brazil | ||
| Argentina | |||
| Rest of South America | |||
| Europe | Germany | ||
| France | |||
| Spain | |||
| Italy | |||
| Russia | |||
| Rest of Europe | |||
| Asia-Pacific | China | ||
| India | |||
| Japan | |||
| Australia | |||
| Rest of Asia-Pacific | |||
| Middle East and Africa | Middle East | Saudi Arabia | |
| United Arab Emirates | |||
| Turkey | |||
| Africa | South Africa | ||
| Nigeria | |||
| Rest of Africa | |||


Key Questions Answered in the Report
What is the current value of the land survey equipment market?
The land survey equipment market stood at USD 9.7 billion in 2026.
How fast is the land survey equipment market expected to grow?
It is projected to register a 5.17% CAGR, reaching USD 12.47 billion by 2031.
Which component segment is expanding the quickest?
Services are growing the fastest, with a 10.55% CAGR forecast through 2031.
Why are UAV/drone-LiDAR systems gaining prominence?
Their 21.2% CAGR reflects demand for rapid, large-area mapping and safer data collection in hazardous sites.
Which region offers the highest growth potential?
The Middle East and Africa are predicted to post the strongest 8.60% CAGR owing to mega-infrastructure programs linked to Saudi Arabia’s Vision 2030.
What is the biggest restraint on market expansion?
A shortage of skilled survey professionals, reported by 94% of U.S. construction firms, continues to slow project delivery and technology adoption.
Page last updated on:


