Electrophoresis Equipment And Supplies Market Size and Share
Market Overview
| Study Period | 2020 - 2031 |
|---|---|
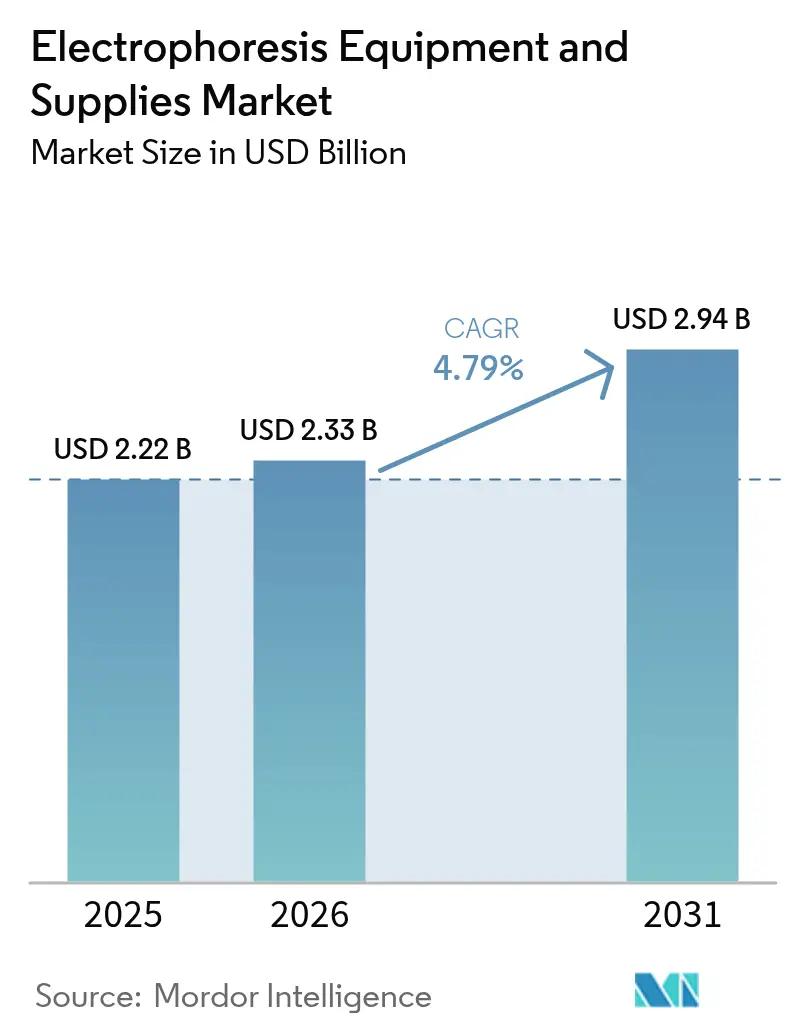
| Market Size (2026) | USD 2.33 Billion |
| Market Size (2031) | USD 2.94 Billion |
| Growth Rate (2026 - 2031) | 4.79% CAGR |
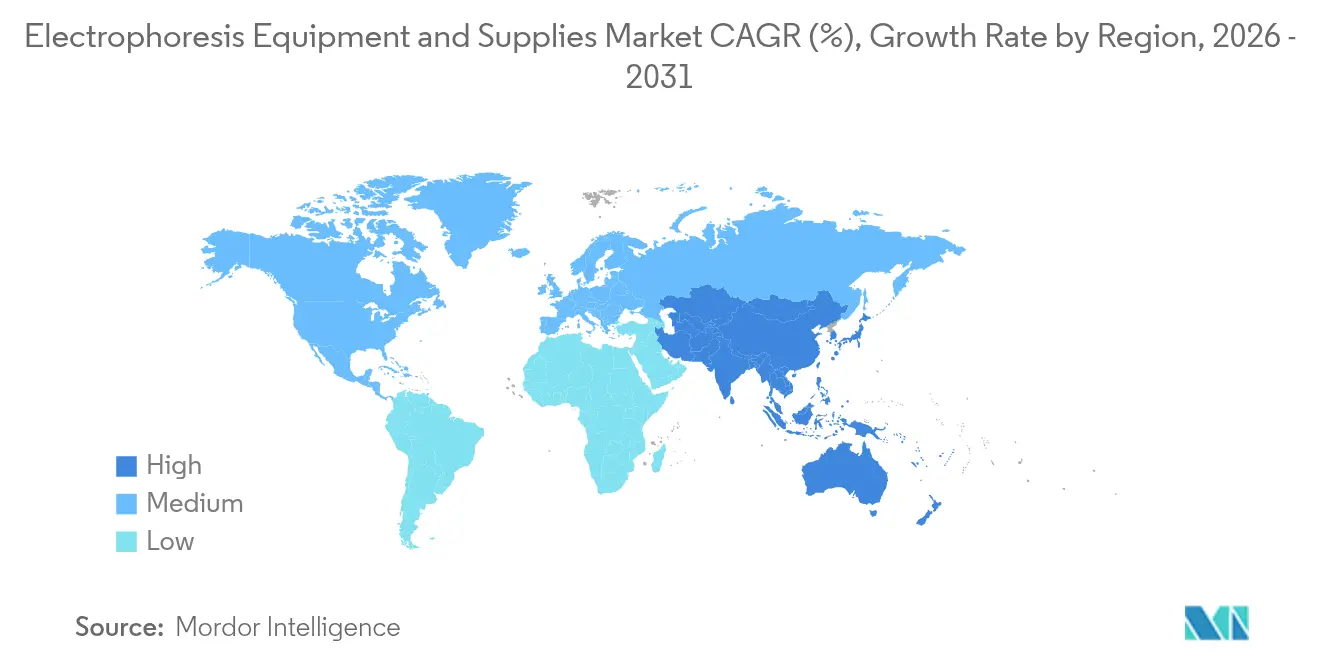
| Fastest Growing Market | Asia Pacific |
| Largest Market | North America |
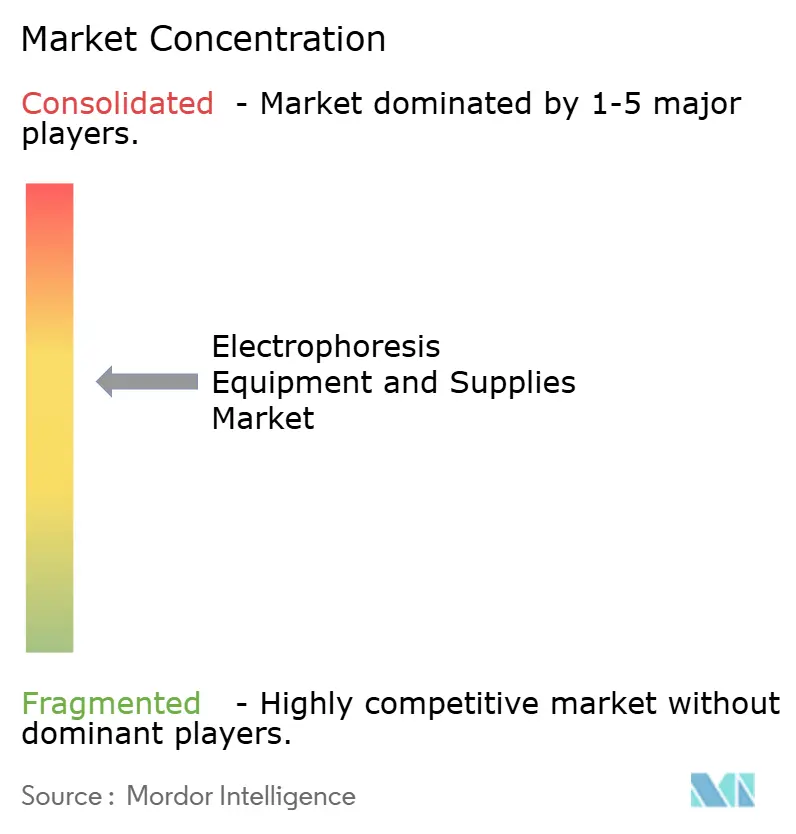
| Market Concentration | Medium |
Major Players *Disclaimer: Major Players sorted in no particular order Image © Mordor Intelligence. Reuse requires attribution under CC BY 4.0. | |
Electrophoresis Equipment And Supplies Market Analysis by Mordor Intelligence
The electrophoresis equipment and supplies market size is expected to grow from USD 2.22 billion in 2025 to USD 2.33 billion in 2026 and is forecast to reach USD 2.94 billion by 2031 at 4.79% CAGR over 2026-2031. This growth trajectory is steady rather than explosive, mirroring a maturing landscape in which biopharmaceutical R&D, clinical diagnostics, and regulated quality-control testing continue to rely on electrophoretic separation even as competing technologies proliferate. Personalized medicine programs now require high-throughput molecular characterization, which keeps capital equipment investments resilient and drives a robust consumables replacement cycle. At the same time, biologics manufacturing hubs are standardizing capillary systems for in-process and release testing of monoclonal antibodies, sustaining demand for integrated platforms that bundle hardware, reagents, and analysis software. Competitive pressure from liquid chromatography–mass spectrometry remains a real headwind, yet recurring reagent revenue, the installed base advantage of legacy suppliers, and the technology’s established regulatory pathway combine to support consistent expansion of the electrophoresis equipment and supplies market.
Key Report Takeaways
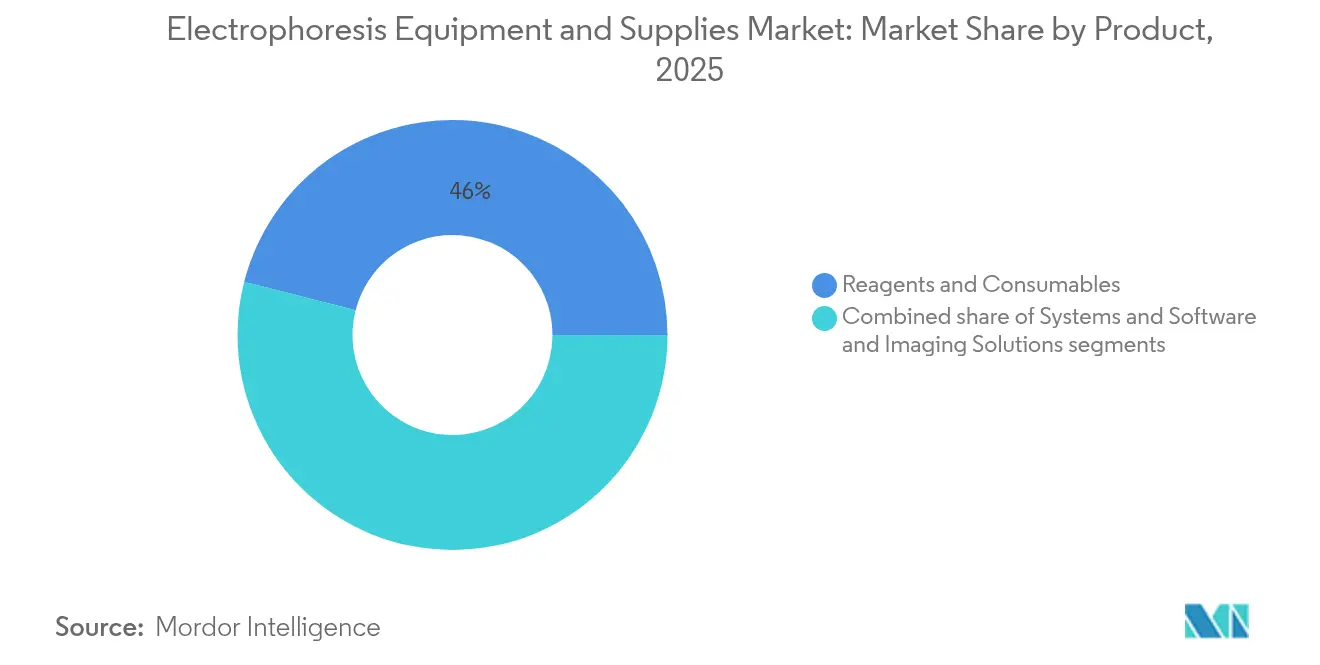
- By product, reagents and consumables captured 46.02% of electrophoresis equipment and supplies market share in 2025, whereas, software and imaging suites are projected to expand at a 6.21% CAGR through 2031, the fastest growth within the segment mix.
- By application, genomics commanded 54.96% of electrophoresis equipment and supplies market size in 2025, whereas, clinical diagnostics is predicted to grow at a 6.68% CAGR to 2031.
- By end-user, academic and research institutes held 45.21% of electrophoresis equipment and supplies market share in 2025; hospitals and diagnostic centers exhibit the fastest growth at 7.24% CAGR to 2031.
- By geography, North America led with 42.03% revenue share in 2025; Asia-Pacific is forecast to advance at a 5.39% CAGR through 2031.
Note: Market size and forecast figures in this report are generated using Mordor Intelligence’s proprietary estimation framework, updated with the latest available data and insights as of 2026.
Global Electrophoresis Equipment And Supplies Market Trends and Insights
Driver Impact Analysis*
| Driver | % Impact on CAGR Forecast | Geographic Relevance | Impact Timeline |
|---|---|---|---|
| Accelerating biopharmaceutical R&D expenditure | +1.2% | North America and European Union | Medium term (2-4 years) |
| Growing adoption of personalized medicine and genomic diagnostics | +0.9% | Early uptake in North America, expanding across Asia-Pacific | Long term (≥ 4 years) |
| Expansion of academic and contract research infrastructure worldwide | +0.8% | Asia-Pacific core, spill-over to Middle East & Africa and Latin America | Medium term (2-4 years) |
| Rising demand for high-throughput quality control in biologics manufacturing | +1.1% | Biomanufacturing hubs worldwide | Short term (≤ 2 years) |
| Increasing government funding for molecular biology education programs in emerging economies | +0.6% | Asia-Pacific, Middle East & Africa, Latin America | Long term (≥ 4 years) |
| Convergence of electrophoresis with microfluidics and automation platforms | +0.7% | North America and European Union | Medium term (2-4 years) |
| Source: Mordor Intelligence | |||
Growing Adoption of Personalized Medicine and Genomic Diagnostics
Capillary electrophoresis couples seamlessly with PCR workflows to deliver rapid, automated detection of gene variants underlying disorders such as cystic fibrosis and Huntington’s disease. Performance benchmarks published in Clinical Chemistry and Laboratory Medicine confirm that electrophoresis can screen hundreds of samples per shift with minimal hands-on time, which reduces operational costs for hospital labs. Point-of-care microfluidic devices now bring this capability to bedside settings, where compact cartridges complete separations in less than five minutes, underscoring the modality’s relevance to precision-care protocols.
Expansion of Academic and Contract Research Infrastructure Worldwide
Government-funded laboratory build-outs across India, China, Indonesia, and Nigeria position electrophoresis as a foundational teaching and research tool. Enrollment surges in molecular-biology programs have triggered bulk procurements of basic horizontal and vertical gel units as well as entry-level capillary systems. Contract research organizations (CROs) carry this momentum forward by integrating electrophoretic assays into multi-omic service lines, ensuring steady consumables pull-through across regional hubs[1]Katarzyna Bialkowska et al., “Global Academic Adoption of Electrophoresis,” Frontiers in Microbiology, frontiersin.org.
Rising Demand for High-Throughput Quality Control in Biologics Manufacturing
Multi-capillary instruments such as SCIEX BioPhase 8800 run eight samples in parallel, achieve impurity detection down to 0.1%, and switch automatically between UV and laser-induced fluorescence modes. These attributes elevate batch release efficiency and align with the manufacturing sector’s real-time release testing ambitions. The result is a clear preference for high-capillary-count platforms that can keep pace with perfusion bioreactor outputs.
Convergence with Microfluidics and Automation Platforms
Instrument makers now bundle electrophoresis modules with robotic liquid handlers and AI-driven image analyzers, eliminating manual loading steps and delivering automatic band quantification in less than 30 seconds per lane. Pilot deployments inside European GMP facilities have cut operator intervention by 60%, validating the return on investment for integrated solutions.
Restraints Impact Analysis*
| Restraints Impact Analysis | (~) % Impact on CAGR Forecast | Geographic Relevance | Impact Timeline |
|---|---|---|---|
| High capital and operating costs of advanced electrophoresis systems | -0.8% | Global, most acute in small labs and emerging markets | Short term (≤ 2 years) |
| Competition from alternative separation technologies such as LC-MS | -1.1% | Developed markets with entrenched LC-MS infrastructures | Medium term (2-4 years) |
| Limited skilled workforce for complex data interpretation in developing regions | -0.6% | Asia-Pacific, Middle East & Africa, Latin America | Long term (≥ 4 years) |
| Vulnerabilities in supply of critical high-purity reagents and consumables | -0.7% | Global; intensified in regions dependent on imports | Short term (≤ 2 years) |
| Source: Mordor Intelligence | |||
High Capital and Operating Costs of Advanced Electrophoresis Systems
State-of-the-art capillary genetic analyzers list between USD 75,000 and USD 150,000. Consumables, including polymer matrices and capillaries, can outstrip the initial hardware outlay within three years of routine use. Proposed tariff schedules on analytical imports would add USD 63 billion to operating budgets across life-science sectors, prompting smaller laboratories to postpone refresh plans. Supply chain interruptions in high-purity buffers underscore the fragility of the cost structure, making price a primary adoption barrier in resource-constrained geographies.
Competition from Alternative Separation Technologies Such as LC-MS
Studies in Annals of Laboratory Medicine report that LC-MS identifies monoclonal proteins at 0.025 g/dL, a sensitivity an order of magnitude tighter than immunofixation electrophoresis[2]Samuel Kim et al., “LC-MS Outperforms Immunofixation Electrophoresis,” Annals of Laboratory Medicine, annlabmed.org. Falling instrument prices and AI-enabled data processors accelerate LC-MS adoption in the same clinical and research environments served by electrophoresis. Vendors must therefore position electrophoresis as the faster, lower-cost option for well-defined workflows rather than compete head-to-head on analytical depth.
*Our forecasts treat driver/restraint impacts as directional, not additive. The impact forecasts reflect baseline growth, mix effects, and variable interactions.
Segment Analysis
By Product: Consumables Dominance Drives Recurring Revenue Streams
Electrophoresis equipment and supplies market size for reagents and consumables was USD 1.02 billion in 2025, equating to 46.02% of overall revenue. Buffer concentrates, pre-cast gels, fluorescent stains, and molecular weight ladders are single-use or limited-reuse items, guaranteeing a replenishment cycle that cushions revenue against capital-spending lulls. Systems sales remain cyclical but software and imaging suites are forecast to compound at 6.21% annually as laboratories retrofit legacy gel boxes with AI-enabled documentation modules. The University of Edinburgh GelGenie engine exemplifies this transition by parsing faint bands with pixel-level accuracy and automatically generating compliance-ready reports.
Advances in microfluidic cartridges carve out a new hybrid category of chip-based consumables plus bench-top analyzers. Each lab-on-a-chip run consumes nanoliter volumes, reducing reagent purchases by as much as 90%, but drives higher chip revenue in aggregate, a trade-off vendors leverage to stabilize margin profiles. Smart-maintenance dashboards inside next-generation instruments prompt automatic re-ordering of buffers and capillaries, reinforcing the consumables-first business model that underpins the electrophoresis equipment and supplies market.


By Application: Genomics Leadership Faces Clinical Diagnostics Acceleration
Genomics workflows controlled 54.96% of electrophoresis equipment and supplies market share in 2025 on the back of DNA sample preparation, RNA integrity checks, and fragment analysis protocols that precede NGS or qPCR. Yet the highest CAGR through 2031 belongs to clinical diagnostics at 6.68%, buoyed by CE-SDS validation for protein therapeutics and the FDA Class I exemption that simplifies implementation in hospital labs. Proteomics continues to pivot toward capillary isoelectric focusing for charge-variant monitoring, where industry round-robin studies across ten labs yielded relative standard deviations under 5% on pI values, meeting stringent release criteria.
Electrophoresis remains well suited to frontline screening tasks that need quick turnaround, limited sample triage, and definitive visual confirmation. As clinical labs migrate to outpatient settings, the technology’s modest footprint and self-contained consumables give it a logistical edge over mass spectrometers that demand controlled utilities.
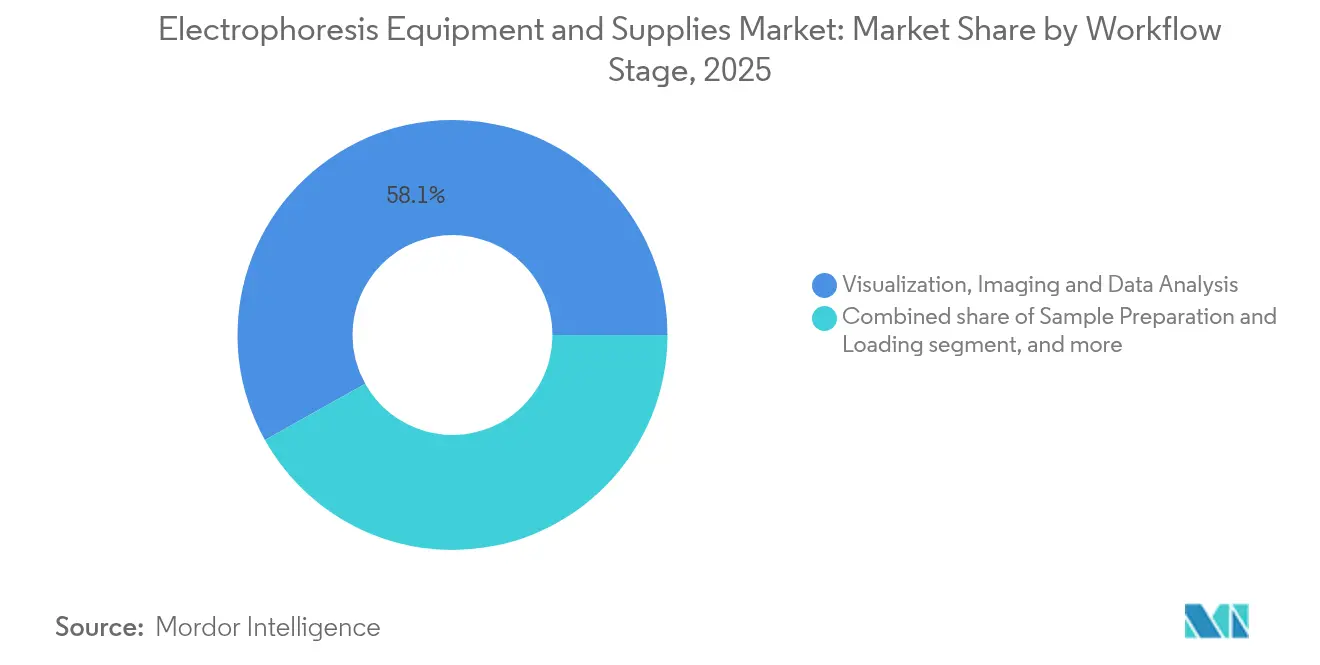
By Workflow Stage: Visualization Dominance Meets Sample Preparation Innovation
Visualization, imaging, and data analysis represented 58.12% of the electrophoresis equipment and supplies market size in 2025, reflecting regulatory mandates to archive gel or capillary traces as part of method validation packages. Automated sample preparation stages, however, are pacing the fastest at 6.01% CAGR. Liquid-handling robots equipped with custom pipette heads load capillary trays at 60 samples per hour while consuming just 2 nL per injection, as demonstrated in peer-reviewed Talanta studies.
Separation modules now rely on advanced inner coatings that neutralize electro-osmotic flow, cutting analysis times from 30 minutes to fewer than 6 minutes for certain antibody fragments. Post-run algorithms stitch raw files into searchable databases, enabling immediate batch acceptance decisions by QA personnel. The electrophoresis equipment and supplies market therefore tilts toward end-to-end workflow orchestration rather than isolated instrument sales.
By End-User: Academic Institutions Lead While Hospitals Accelerate Adoption
Universities and government labs accounted for 45.21% of electrophoresis equipment and supplies market share in 2025. Mandated laboratory practicums and grant-funded basic research keep gel boxes and capillary units in constant rotation. Hospitals and diagnostic centers, while smaller in absolute volume, show the fastest growth at 7.24% CAGR. Stretch goals in oncology and rare-disease screening push lab directors to favor automated, cartridge-based capillary systems that deliver same-day results without specialist oversight.
Pharma and biotech continue to refresh high-capillary count instruments, embedding them in upstream cell-line selection workflows where rapid charge-variant profiling can shave weeks off clone-development timelines. Meanwhile, CROs capitalize on overflow testing from in-house pharma labs, reinforcing the recurring reagent demand underpinning the electrophoresis equipment and supplies market.
Geography Analysis
North America contributed 42.03% of global revenue in 2025 thanks to its dense biopharma cluster, clear FDA guidance, and deep installed base of gel and capillary systems FDA.GOV. Replacement demand centers on fully automated hardware that integrates electronic batch records to streamline GMP compliance. Tariff uncertainty on scientific imports could raise acquisition costs for niche components but is unlikely to disrupt consumables flows, which are predominantly regionally manufactured.
Asia-Pacific is the fastest-advancing territory with a projected 5.39% CAGR. China’s 14th Five-Year Plan earmarks substantial funding for college-level biochemistry labs, while India’s production-linked incentive program covers analytical instruments, triggering procurement waves across university networks. Japan and South Korea continue to favor premium capillary systems for biosimilar development, reinforcing steady high-value demand.
Europe maintains equilibrium growth, balancing rising biotech start-ups with cost-containment in public health systems. EU device regulation harmonization simplifies pan-regional launches, but sustainability directives push vendors to minimize plastic waste in consumables.
Latin America and MEA remain nascent yet promising: national health ministries in Brazil and Saudi Arabia now require electrophoresis confirmation for hemoglobinopathy newborn screening, establishing a foothold for future platform upgrades.

Competitive Landscape
The electrophoresis equipment and supplies market displays moderate concentration, with the top five vendors controlling an estimated 58% of global turnover. Thermo Fisher, Bio-Rad, and Agilent retain leadership through portfolio breadth and installed base support. Bio-Rad’s Life Science segment posted USD 228.6 million in Q1 2025 despite a 5.4% year-on-year decline amid softer academic spending. Thermo Fisher’s USD 4.1 billion Solventum acquisition strengthens its downstream purification reach, paving the way for bundled QC platforms spanning electrophoresis, filtration, and chromatography.
Agilent’s latest InfinityLab LC Series integrates sample-tracking RFID tags and predictive service analytics, features that crossover into its electrophoresis roadmap. Start-ups such as KeyDev confront incumbents with bench-top units that combine electrophoresis, imaging, and data reporting in a single chassis, cutting run-to-result time by 30%. Strategic alliances with AI developers further intensify competitive dynamics as software becomes the primary differentiator rather than raw separation performance.
Vendor sustainability credentials are also moving up the purchasing criteria. My Green Lab ACT 2.0 ecolabel verification for select Agilent systems illustrates a pivot to decarbonized operations, which institutional buyers increasingly weigh alongside instrument throughput.
Electrophoresis Equipment And Supplies Industry Leaders
Bio-Rad Laboratories, Inc
GE Healthcare
Thermo Fisher Scientific Inc
Agilent Technologies, Inc
Merck KGaA (Millipore Sigma)
- *Disclaimer: Major Players sorted in no particular order

Recent Industry Developments
- June 2025: Advanced Instruments completed a merger with Nova Biomedical, forming a USD 621 million life-science tools business aimed at biopharma analytics.
- May 2025: Agilent launched the next-generation InfinityLab LC Series featuring Assist Technology for enhanced automation and error reduction.
- May 2025: University of Edinburgh released GelGenie, an AI-powered framework for automated gel electrophoresis image analysis, trained on more than 500 labelled gels for improved precision.
- February 2025: Thermo Fisher Scientific announced a USD 4.1 billion acquisition of Solventum’s Purification & Filtration unit to deepen its bioproduction platform.
- February 2025: Agilent Technologies reported Q1 2025 revenue of USD 1.68 billion, with Life Sciences and Diagnostics contributing USD 647 million.
- October 2024: Agilent introduced Infinity III LC Series with verified ACT 2.0 ecolabel certification.


Global Electrophoresis Equipment And Supplies Market Report Scope
Electrophoresis is a technique used to separate molecules based on charge, size, and binding affinity. This technique is mainly used to separate and analyze large molecules, such as proteins, nucleic acids, plasmids, DNA, RNA, plasmids, and fragments of these macromolecules. The electrophoresis equipment and supplies market is segmented by product type (gel electrophoresis systems, capillary electrophoresis systems, electrophoresis accessories), application (academic and research institutes, hospitals and diagnostics centers, pharmaceutical and biotechnology companies, other applications), and geography (North America, Europe, Asia-Pacific, Middle East and Africa, South America). The report also covers the estimated market sizes and trends for 17 countries across major regions. The report offers market size and forecast values in USD million for the above segments.
| Systems | Gel Electrophoresis Systems |
| Capillary Electrophoresis Systems | |
| Microfluidic Electrophoresis Systems | |
| Reagents & Consumables | Gels & Buffers |
| Stains & Dyes | |
| Membranes & Blotting Media | |
| Molecular Weight Standards & Ladders | |
| Software & Imaging Solutions | Gel Documentation & Analysis Software |
| CE Data Analysis Platforms | |
| AI-Driven Automation Suites |
| Genomics (DNA/RNA Analysis) |
| Proteomics (Protein Characterization) |
| Clinical Diagnostics |
| Quality Control & Process Validation |
| Sample Preparation & Loading |
| Separation & Fractionation |
| Visualization, Imaging & Data Analysis |
| Academic & Research Institutes |
| Hospitals & Diagnostic Centers |
| Pharmaceutical & Biotechnology Companies |
| North America | United States |
| Canada | |
| Mexico | |
| Europe | Germany |
| United Kingdom | |
| France | |
| Italy | |
| Spain | |
| Rest of Europe | |
| Asia-Pacific | China |
| Japan | |
| India | |
| Australia | |
| South Korea | |
| Rest of Asia-Pacific | |
| Middle East & Africa | GCC |
| South Africa | |
| Rest of Middle East & Africa | |
| South America | Brazil |
| Argentina | |
| Rest of South America |
| By Product | Systems | Gel Electrophoresis Systems |
| Capillary Electrophoresis Systems | ||
| Microfluidic Electrophoresis Systems | ||
| Reagents & Consumables | Gels & Buffers | |
| Stains & Dyes | ||
| Membranes & Blotting Media | ||
| Molecular Weight Standards & Ladders | ||
| Software & Imaging Solutions | Gel Documentation & Analysis Software | |
| CE Data Analysis Platforms | ||
| AI-Driven Automation Suites | ||
| By Application | Genomics (DNA/RNA Analysis) | |
| Proteomics (Protein Characterization) | ||
| Clinical Diagnostics | ||
| Quality Control & Process Validation | ||
| By Workflow Stage | Sample Preparation & Loading | |
| Separation & Fractionation | ||
| Visualization, Imaging & Data Analysis | ||
| By End-User | Academic & Research Institutes | |
| Hospitals & Diagnostic Centers | ||
| Pharmaceutical & Biotechnology Companies | ||
| Geography | North America | United States |
| Canada | ||
| Mexico | ||
| Europe | Germany | |
| United Kingdom | ||
| France | ||
| Italy | ||
| Spain | ||
| Rest of Europe | ||
| Asia-Pacific | China | |
| Japan | ||
| India | ||
| Australia | ||
| South Korea | ||
| Rest of Asia-Pacific | ||
| Middle East & Africa | GCC | |
| South Africa | ||
| Rest of Middle East & Africa | ||
| South America | Brazil | |
| Argentina | ||
| Rest of South America | ||


Key Questions Answered in the Report
How large is the global electrophoresis equipment and supplies space today and how fast is it expanding?
Sales reach USD 2.33 billion in 2026 and are projected to climb to USD 2.94 billion by 2031, translating to a 4.79% CAGR.
Which product category generates the most predictable revenue stream for suppliers?
Reagents and consumables hold 46.02% share because gels, buffers, and stains are single-use items that laboratories must replace constantly.
What application is growing the quickest?
Clinical diagnostics shows the fastest momentum with a 6.68% CAGR through 2031, driven by regulatory acceptance of capillary methods for protein and biomarker assays.
Why is Asia-Pacific recording the highest regional growth rate?
Government spending on lab infrastructure and molecular-biology education fuels instrument purchases, lifting the region to a 5.39% CAGR.
Which competing technology poses the greatest threat?
Liquid chromatographyÐmass spectrometry challenges electrophoresis by offering lower detection limits and expanding automation at similar price points.
How is automation reshaping adoption trends?
Integrated systems combine robotic sample loading with AI image analysis, cutting operator intervention by 60% and speeding batch release decisions.
Page last updated on:


