
Virus Filtration Market Size and Share
Market Overview
| Study Period | 2022 - 2031 |
|---|---|
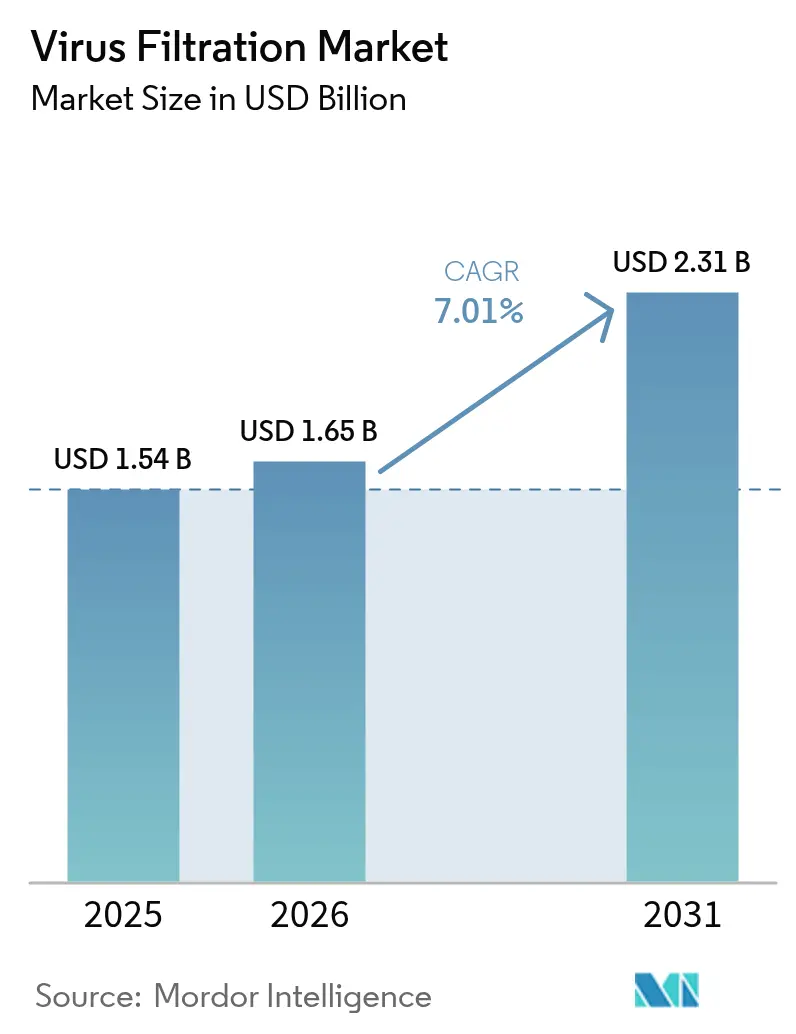
| Market Size (2026) | USD 1.65 Billion |
| Market Size (2031) | USD 2.31 Billion |
| Growth Rate (2026 - 2031) | 7.01 % |
| Fastest Growing Market | Asia Pacific |
| Largest Market | North America |
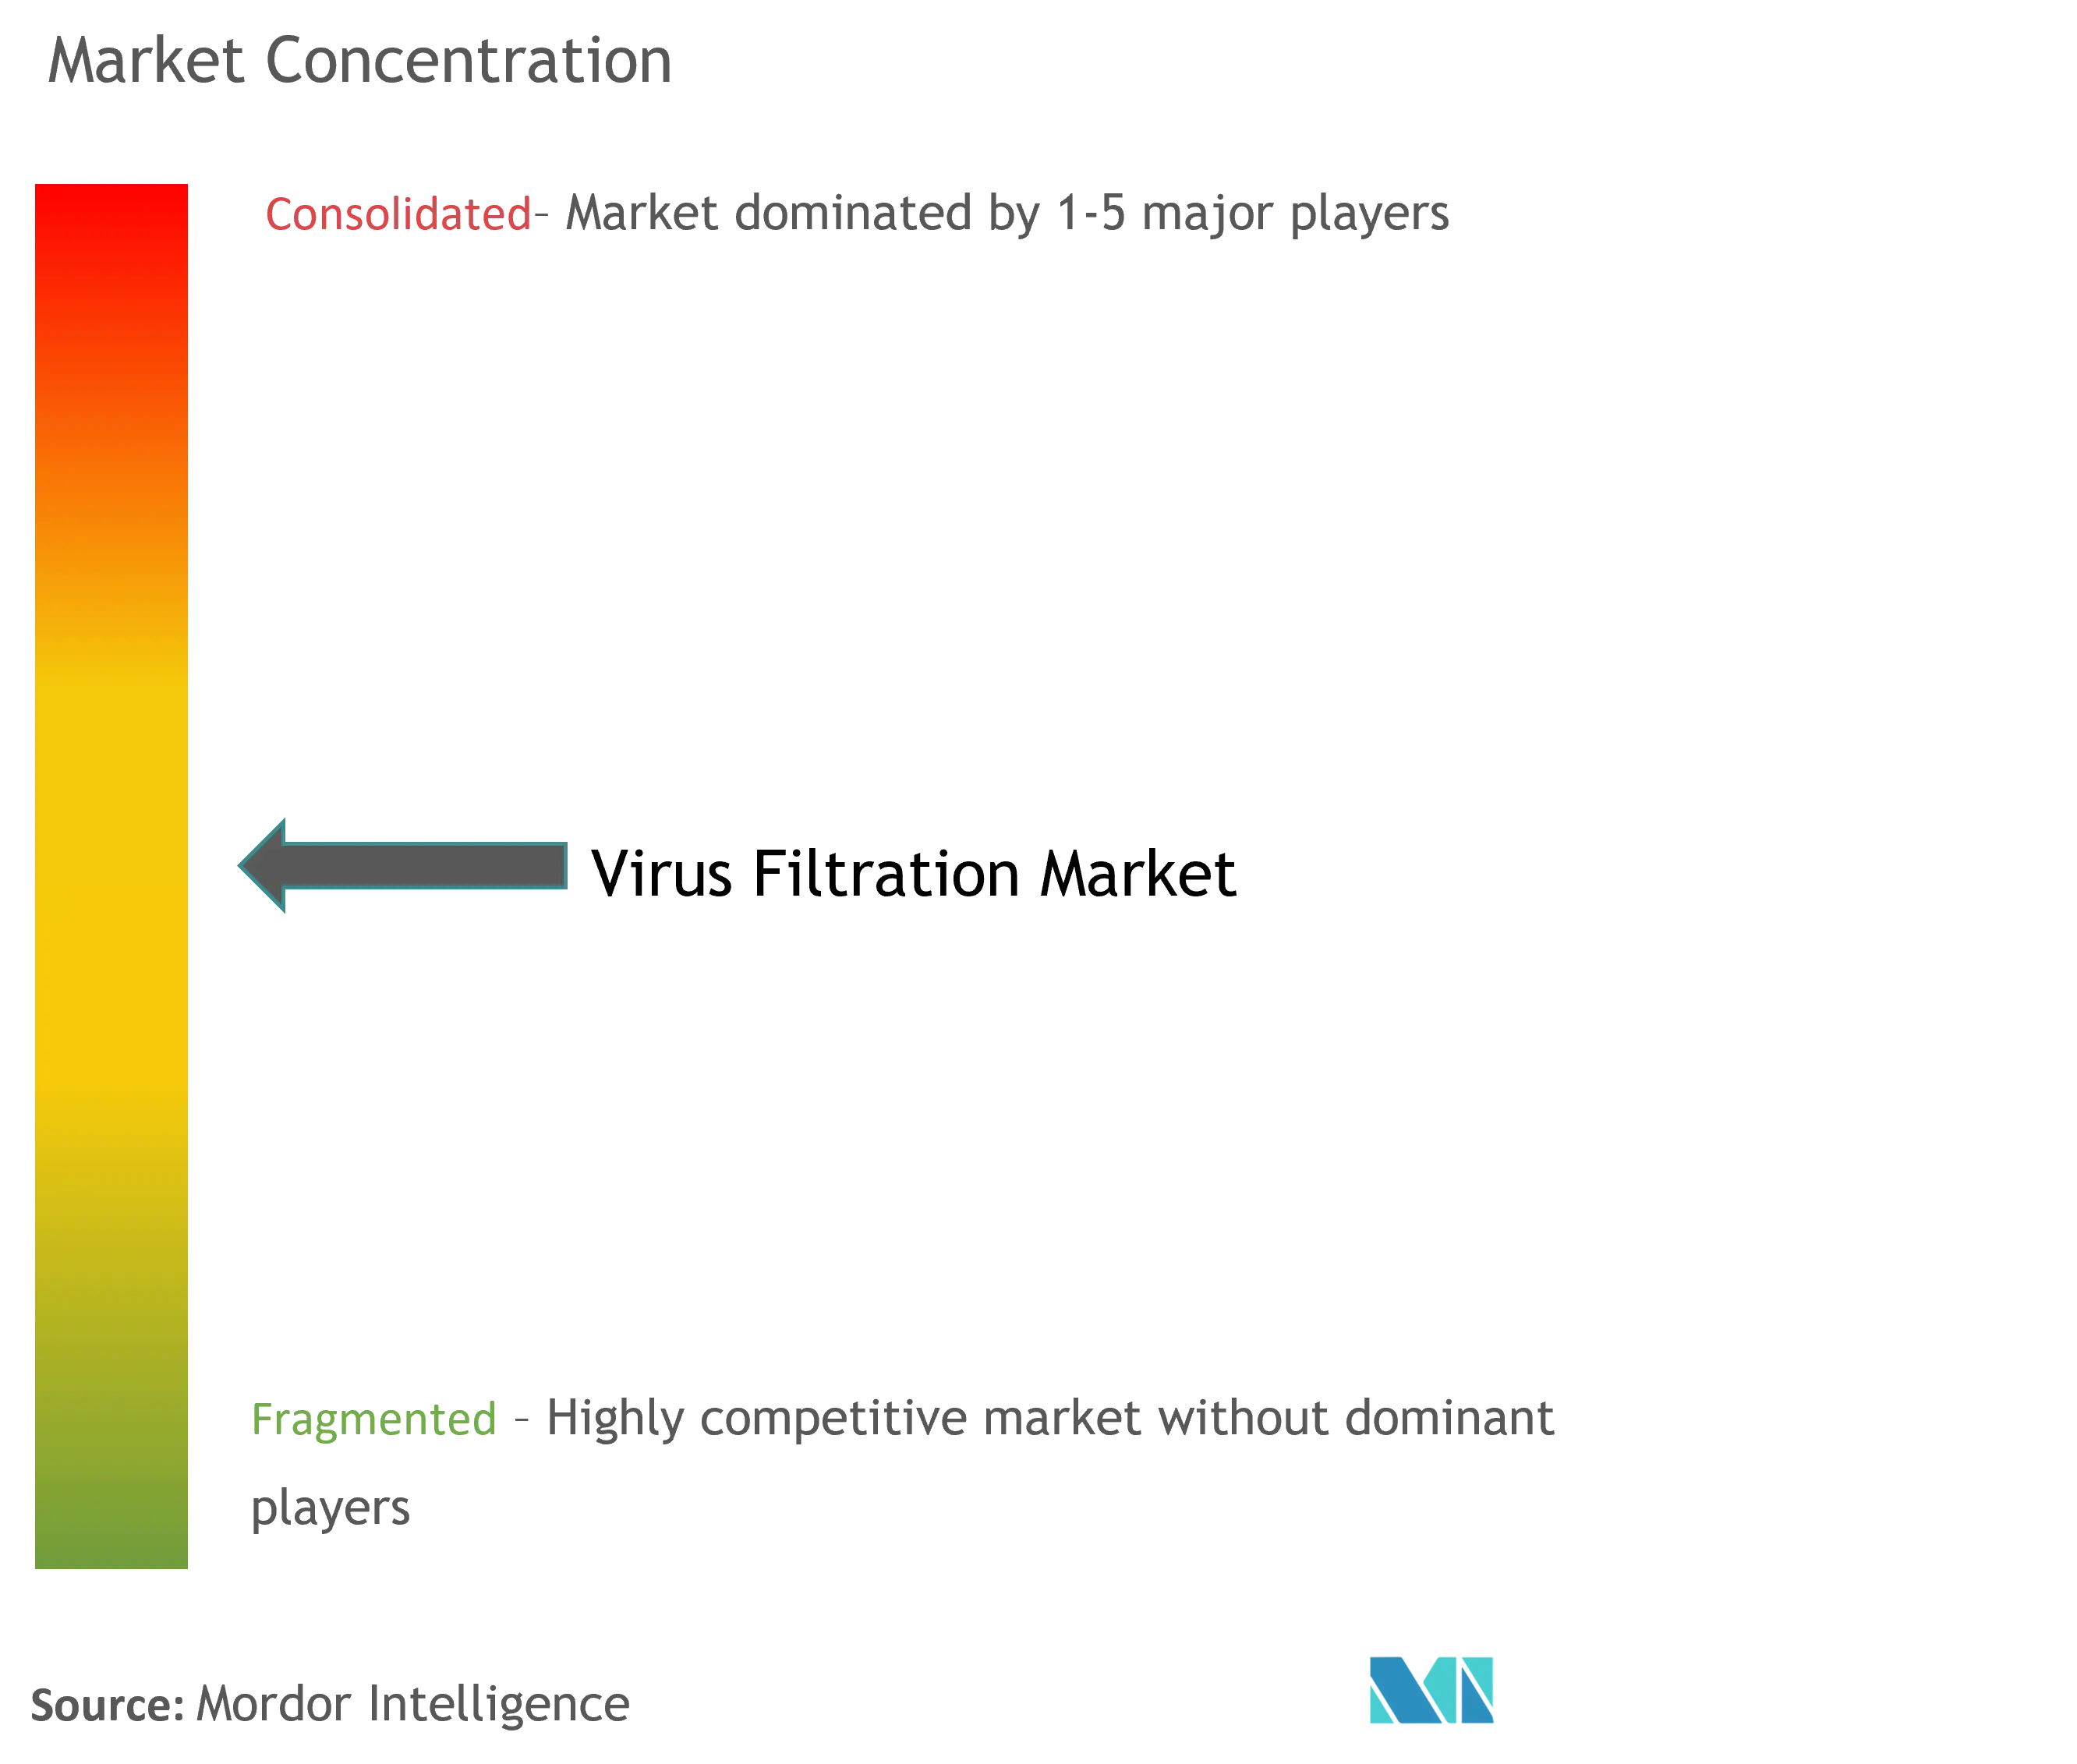
| Market Concentration | Medium |
Major Players *Disclaimer: Major Players sorted in no particular order Image © Mordor Intelligence. Reuse requires attribution under CC BY 4.0. | |
Virus Filtration Market Analysis by Mordor Intelligence
The virus filtration market size was valued at USD 1.54 billion in 2025 and estimated to grow from USD 1.65 billion in 2026 to reach USD 2.31 billion by 2031, at a CAGR of 7.01% during the forecast period (2026-2031). Heightened regulatory focus on viral safety, fast-rising biologics pipelines, wider adoption of single-use systems, and the transition toward continuous bioprocessing are the principal engines propelling the virus filtration market. Suppliers are responding by upgrading membrane materials, integrating automation, and embedding in-line analytics to shorten validation cycles. Heightened investments in mRNA vaccines and gene therapies continue to amplify demand for robust clearance technologies across North America, Europe, and especially Asia-Pacific. Meanwhile, strategic acquisitions among leading vendors illustrate an industry intent on broadening end-to-end portfolios, shoring up supply resilience, and advancing next-generation filter performance.
Key Report Takeaways
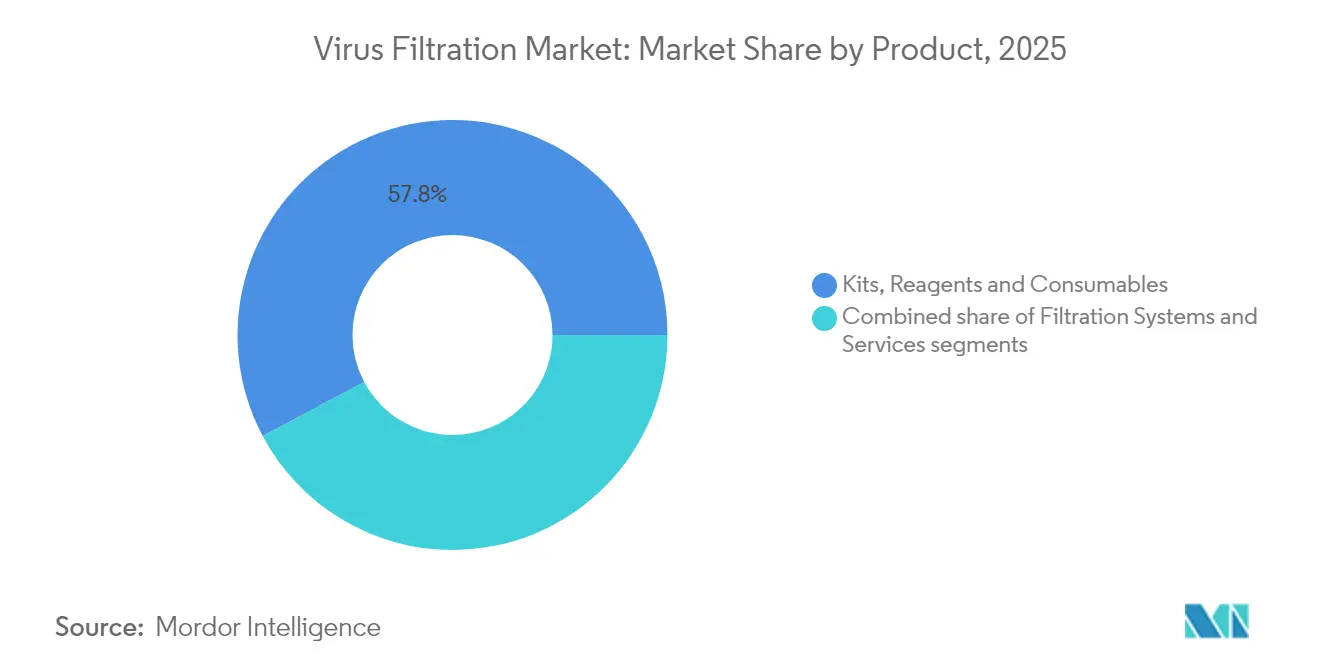
- By product, kits, reagents, and consumables held 57.78% of the virus filtration market share in 2025; filtration systems are projected to expand at a 9.51% CAGR through 2031.
- By filtration mode, batch operations commanded 54.82% of the virus filtration market size in 2025, while continuous and in-line configurations are advancing at a 9.72% CAGR to 2031.
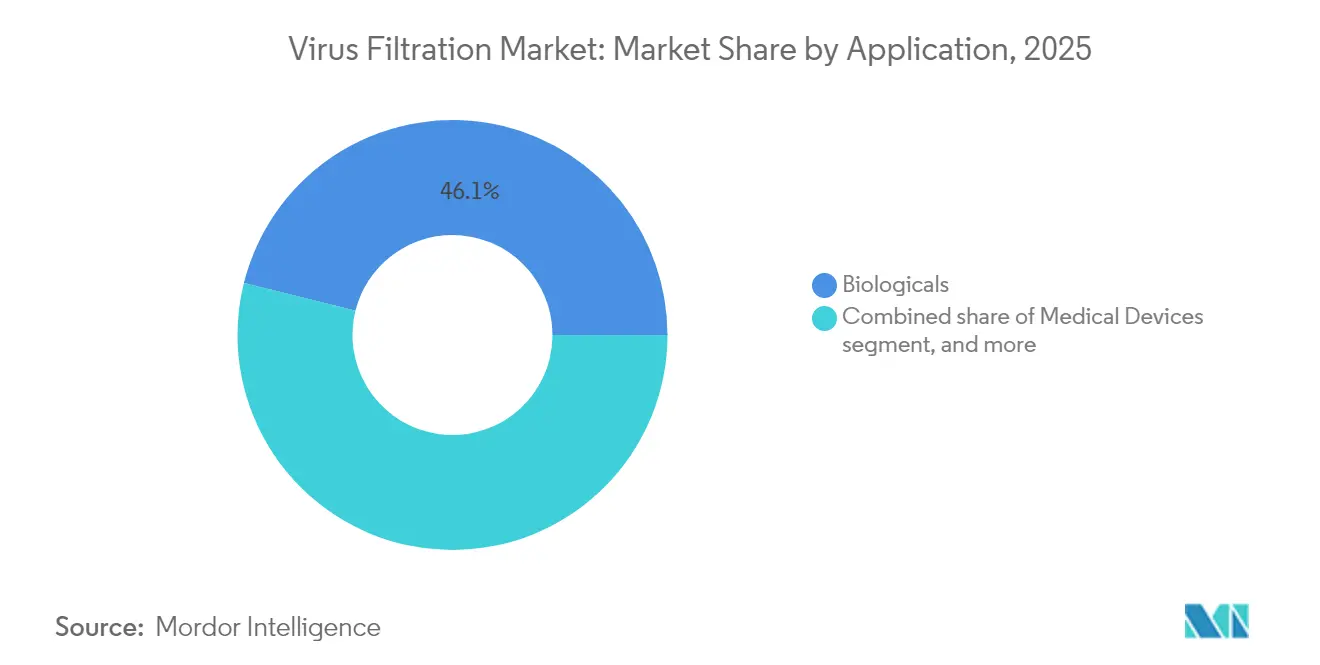
- By application, biologicals captured 46.12% revenue share in 2025; medical devices are set to grow at a 10.54% CAGR through 2031.
- By end user, pharmaceutical and biotechnology companies accounted for 71.68% of the virus filtration market size in 2025, while contract research organizations record the fastest 10.28% CAGR to 2031.
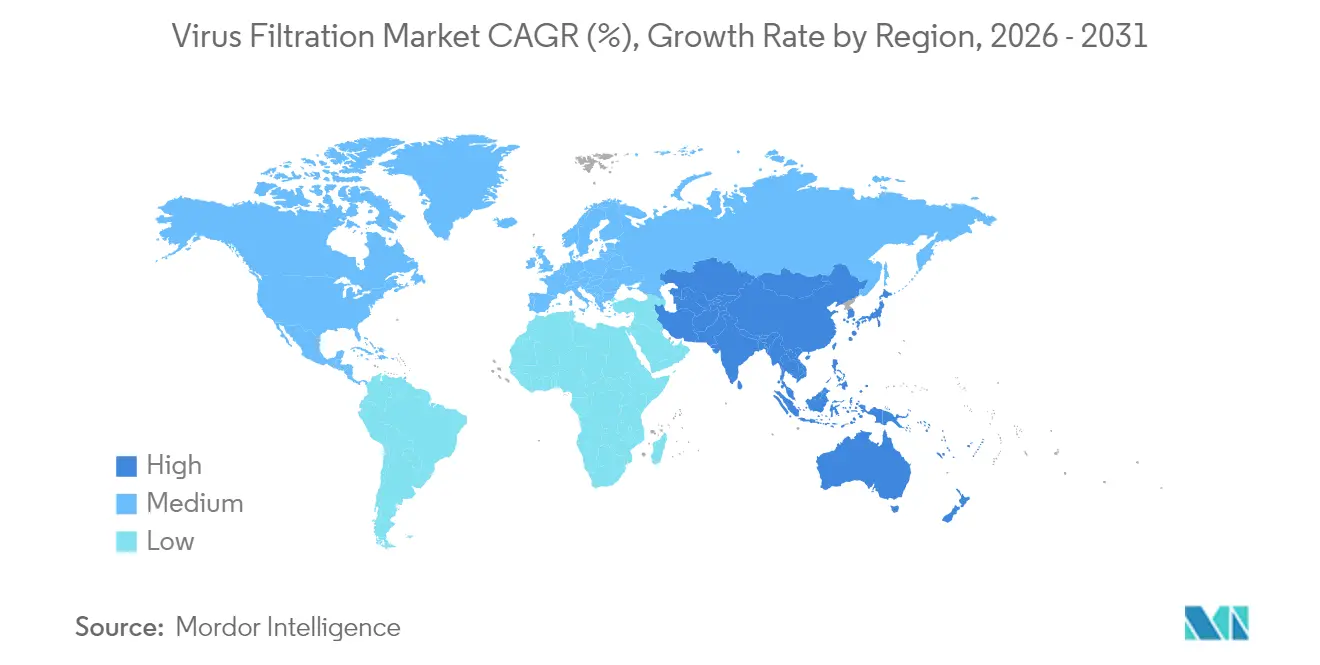
- By geography, North America led with 42.74% revenue share in 2025; Asia-Pacific is forecast to expand at an 8.32% CAGR through 2031.
Note: Market size and forecast figures in this report are generated using Mordor Intelligence’s proprietary estimation framework, updated with the latest available data and insights as of 2026.
Market Trends and Insights
Drivers Impact Analysis of Virus Filtration Market*
| Driver | % Impact on CAGR Forecast | Geographic Relevance | Impact Timeline |
|---|---|---|---|
| Increasing pharmaceutical & biopharma R&D spending | +1.2% | Global, concentrated in North America & Europe | Medium term (2-4 years) |
| Rising demand for biologics & gene therapies | +1.8% | Global, led by North America, expanding into Asia-Pacific | Long term (≥4 years) |
| Adoption of single-use filtration technologies | +1.1% | Global, early adoption in North America & Europe | Short term (≤2 years) |
| Expansion of CDMO/CMO outsourcing models | +1.4% | Global, fastest uptake in Asia-Pacific | Medium term (2-4 years) |
| Shift toward continuous bioprocessing & in-line filtration | +0.9% | North America & Europe, progressively global | Long term (≥4 years) |
| AI-driven membrane engineering accelerating product launches | +0.6% | Technology hubs in North America & Asia | Medium term (2-4 years) |
| Source: Mordor Intelligence | |||
Rising Demand for Biologics & Gene Therapies
The T-cell therapy segment alone is forecast to balloon from USD 10.30 billion in 2025 to USD 161.21 billion by 2034, driving unprecedented volumes of viral vectors that must be purified without structural loss. More than 700 active AAV programs require filters capable of maintaining capsid integrity at ever-higher titers. Lentiviral production faces even sharper fouling challenges, making low-adsorptive membranes essential for acceptable recovery. Industry participants consequently invest in predictive modeling tools to pre-screen filter candidates and cut extensive wet-lab iterations. This surge in biologics underscores the virus filtration market’s centrality to next-generation therapeutics.
Adoption of Single-Use Filtration Technologies
Contract development and manufacturing organizations (CDMOs) favor single-use assemblies for campaign flexibility and lower cleaning validation overheads. High-throughput microcarrier cultures can now pair with disposable virus filters rated for multi-barrier removal. Asahi Kasei’s Planova FG1, released in 2024, achieves seven-fold faster flux versus its predecessor while retaining compatibility with existing holders. Automated pressure monitoring and integrity-test sockets come standard, aligning with Annex 1 requirements for pre-use post-sterilization testing.
Expansion of CDMO/CMO Outsourcing Models
The global CDMO segment is forecast to capture more than half of total biologics capacity by 2028, reshaping how viral filtration expertise is sourced. Providers in Singapore, South Korea, and Ireland are installing modular suites that allow rapid configuration changes between recombinant protein, vaccine, and viral-vector campaigns. To win contracts, these sites typically showcase a library of validated filter trains and leverage digital twins to predict filter fouling in silico.
AI-Driven Membrane Engineering Accelerating Product Launches
Machine-learning models increasingly predict the interplay among membrane porosity, surface chemistry, and virus size. A 2024 Chinese Academy of Sciences study cut lab optimization cycles in half by using algorithms to prioritize parameter sets that maximize log-reduction value without sacrificing flux[1]George Mason, “AI Maximizes Virus Filter Design Efficiency,” Phys.org, phys.org. Vendors embedding similar data pipelines reduce development risk and speed delivery of bespoke virus filters for niche gene-therapy payloads.
Restraints Impact Analysis of Virus Filtration Market*
| Restraints Impact Analysis | (~) % Impact on CAGR Forecast | Geographic Relevance | Impact Timeline |
|---|---|---|---|
| Stringent validation & regulatory approval timelines | -0.8% | Global, intensity varies by region | Long term (≥4 years) |
| High capital cost of high-capacity filtration skids | -0.6% | Global, particularly challenging in emerging markets | Medium term (2-4 years) |
| PFAS-related membrane material supply disruptions | -0.7% | Europe & North America, potential spillover worldwide | Short–medium term (≤4 years) |
| Filter fouling from high-vector impurity loads in ATMPs | -0.9% | Global, acute in gene-therapy manufacturing hubs | Short–medium term (≤4 years) |
| Source: Mordor Intelligence | |||
Stringent Validation & Regulatory Approval Timelines
The FDA’s revised Q5A(R2) guidance specifies deeper virus panel testing and endorses new detection technologies, pushing firms to update validation protocols and archival records. Cygnus Technologies’ MockV kits help predict clearance early using non-infectious surrogates, yet full-scale spiking studies remain mandatory for licensure. Developers must therefore budget for multi-phase pilot work, statistical robustness evaluations, and regulator engagement sessions, lengthening time to market.
High Capital Cost of High-Capacity Filtration Skids
A fully automated 4,000 L virus filtration skid equipped with redundant sensors, closed-loop fail-safe valves, and electronic batch records can command several million dollars in upfront spend. Smaller biotech firms struggle to absorb depreciation, validation, and operator training outlays. Equipment leasing and pay-per-use models are beginning to surface, but risk-sharing terms still deter widespread uptake. Meanwhile, membrane suppliers attempt to lower total cost of ownership by boosting flux and longevity, thereby reducing the number of cartridges per campaign.
*Our forecasts treat driver/restraint impacts as directional, not additive. The impact forecasts reflect baseline growth, mix effects, and variable interactions.
Virus Filtration Market Segment Analysis
By Product:
Systems Drive Innovation While Consumables Dominate RevenueKits, reagents, and consumables generated 57.78% of the virus filtration market size in 2025, a testament to their recurring use in every production run. Demand is magnified by the turn toward disposable assemblies, where each lot requires fresh capsules, integrity-test reagents, and prefilters. Rising biologics titers intensify fouling, elevating cartridge replacement rates and bolstering consumables revenue. In contrast, systems revenue is one-time yet rising briskly as next-generation skids integrate data historians, auto-flush features, and digital twin compatibility. Membrane innovations—such as PFAS-free polyamide composites—further differentiate premium models aimed at gene-therapy vectors susceptible to adsorption losses.
Filtration systems are pacing the segment with a 9.51% CAGR through 2031. Vendors highlight planar flow paths that minimize shear and maintain viral vector infectivity. Asahi Kasei’s FG1 launch epitomizes this trajectory, delivering seven-fold higher throughput at equivalent log-reduction values. Hardware modularity permits straightforward swap-outs between stainless housings and single-use capsules, appealing to CDMOs juggling diverse client pipelines. Advisory services—ranging from filterability screening to end-to-end validation documentation—are becoming bundled, creating annuity revenue streams even for equipment-centric suppliers.



By Filtration Mode:
Continuous Processing Gains MomentumBatch filtration retained 54.82% of the virus filtration market share in 2025 as legacy stainless facilities opt to extend validated methods rather than embrace wholesale redesigns. Operators value the extensive historical data that batch processes hold, easing regulatory dialogue and post-approval change management. Moreover, disposables readily retrofit existing batch hold tanks, allowing incremental capacity boosts without full facility refit. Nevertheless, the inherent start-stop nature imposes labor peaks and product hold times that hamper total equipment effectiveness.
Continuous and in-line filtration is advancing at a 9.72% CAGR, capitalizing on the broader shift to perfusion cell culture. At 2,000 L commercial scale, steady-state filtrate streams already satisfy global pharmacopoeia sterility norms while halving buffer consumption. Parallel filter arrays mitigate flux decay, and smart valves divert flow when sensors detect impending fouling—safeguarding product integrity without interrupting throughput. Regulators increasingly advocate holistic control-strategy filings, which continuous platforms naturally support via integrated, real-time analytics.
By Application:
Medical Devices Emerge as Growth LeaderBiologicals, encompassing vaccines, monoclonal antibodies, plasma derivatives, and advanced therapies, represented 46.12% of revenue in 2025. Each modality mandates a validated viral clearance envelope, typically combining low-pH hold, detergent inactivation, and final capsule filtration. The proliferation of multi-specific antibodies and high-concentration formulations compounds fouling challenges, expanding opportunities for optimized prefilter designs. Furthermore, pandemic-preparedness initiatives keep fill-finish lines in continuous production, sustaining high cartridge turnover.
Medical devices are charting the highest 10.54% CAGR. Filtration technologies originally crafted for biologics now feature in blood-purification cartridges like Seraph 100, granted FDA fast-track status for bacteremia therapy. Air-purification innovators employ copper-oxide or Zinnia-coated media to capture and inactivate 99% of airborne pathogens inside HVAC units, enabling hospitals to lower infection-control costs. Water-treatment lines also integrate virus-rated membranes to meet emerging micro-pollutant regulations, driving cross-sector synergies.
By End User:
CROs Lead Growth in Specialized ServicesPharmaceutical and biotechnology companies held 71.68% of the virus filtration market size in 2025 as most biologics developers still run in-house process-development labs. Internal ownership of critical clearance steps safeguards intellectual property and expedites regulatory inspection readiness. However, filling capacity constraints and the steep learning curve around novel vectors are nudging firms toward external support.
Contract research organizations (CROs) are expanding fastest at 10.28% CAGR. Clients leverage CROs for early-stage clearance studies, filterability screens, and dossier-ready reports that align with Q5A(R2) expectations. The ability to access seasoned virologists and BSL-2/-3 suites without capital expenditure resonates strongly with start-ups and mid-size firms. Meanwhile, CDMO hybrids bundle development with commercial manufacturing, prompting virus filtration suppliers to structure long-term service agreements that guarantee cartridge availability and technical support throughout the product life cycle.
Geography Analysis
North America Virus Filtration Market
North America delivered 42.74% of global revenue in 2025, anchored by the United States’ deep biologics R&D pipelines and the FDA’s role in setting viral-safety benchmarks. Major capacity investments—such as Fujifilm Diosynth’s USD 1.2 billion cell-culture expansion in North Carolina—signal ongoing confidence in domestic infrastructure. Mature supply chains ease access to sterile capsules and validation viruses, giving local plants a time-to-market edge. As more mRNA and gene-therapy candidates move to late stage, filter suppliers are scaling membrane casting lines inside the region to safeguard against cross-border disruptions.
APAC Virus Filtration Market
Asia-Pacific is on track for an 8.32% CAGR to 2031, the fastest among all regions. South Korea, Japan, and Singapore headline capacity expansions for mRNA vaccines and viral vectors, often backed by state incentives aimed at pandemic readiness. Pall Corporation’s USD 150 million Singapore plant exemplifies multinational faith in the region’s talent pool and logistics reach. Regional CDMOs combine attractive cost structures with cutting-edge single-use suites, drawing Western sponsors seeking risk-diversified supply strategies.
Europe Virus Filtration Market
Europe preserves a robust footprint underpinned by long-standing GMP rigor and extensive plasma-fractionation capacity. Yet the looming European Chemicals Agency proposal to restrict PFAS could significantly disrupt PVDF membrane availability, compelling filter designers to accelerate PFAS-free alternatives. Nanofiber membranes that deliver high flow and tunable pore size have surfaced as practical substitutes, with Matregenix reporting customizable platforms tailored for virus removal. Regulatory uncertainty around material substitution is prompting parallel validation programs across leading biomanufacturers to future-proof supply continuity.

Regulatory Landscape
Viral safety expectations for biopharmaceuticals are anchored by ICH Q5A(R2), adopted in November 2023. The framework harmonizes the risk-based design of viral clearance strategies and the evidence package used in dossiers. It reinforces orthogonal clearance approaches, including virus retentive filtration, and supports more rigorous virus panel selection, method sensitivity, and documentation. FDA and EMA continue to use their viral safety guidances and virus validation references as key review touchpoints for biologics submissions.
Operational expectations are further shaped by consensus standards and industry guidance, including ASTM E3259-22 for small virus retentive filters and PDA Technical Report No. 41 (Revised 2022). These documents emphasize QbD, worst-case condition definition (for example, flux and pressure excursions), and robust integrity testing. In China, the NMPA CDE issued Guideline No. 2 (2024) on platform validation for viral clearance in clinical trial applications of recombinant proteins, supporting broader use of platform data packages when appropriately justified. This has helped accelerate alignment with ICH-style expectations across multi-region development programs.
Competitive Landscape
The virus filtration industry features moderate consolidation, with scale players engaging in multi-billion-dollar moves to broaden downstream breadth. Thermo Fisher Scientific’s USD 4.1 billion purchase of Solventum’s purification and filtration unit boosts its single-use capsule and membrane lineup while adding about USD 1 billion in incremental revenue. Danaher deepened its reach by merging Cytiva and Pall into a USD 7.5 billion entity, reinforcing its end-to-end bioprocessing suite that includes virus-rated capsules, pre-sterilized flow paths, and scalable skids.
Technological differentiation is the prime battleground. Suppliers deploy AI-driven design to shorten membrane R&D timelines and embed data-rich sensors that unlock closed-loop control of filtration performance. Partnerships with automation vendors advance predictive maintenance, enabling cartridge change-out before flux decline endangers batch integrity. White-space innovation clusters around gene-therapy manufacture, where low-adsorptive, high-throughput membranes can preserve delicate capsids better than standard PVDF.
Regional manufacturers are also scaling: Cleanova’s 2024 acquisitions of Sidco Filter and Shawndra Products augment its North American footprint and bring complementary depth-filtration know-how[3]Cleanova, “Acquisition of Sidco Filter and Shawndra Products,” cleanova.com. At the same time, start-ups are exploring graphene and ceramic composite filters with inherent antiviral surfaces, aiming to couple removal and inactivation in a single step. The competitive balance therefore hinges on rapid innovation cycles supported by robust quality systems and globally distributed manufacturing.
Virus Filtration Industry Leaders
Danaher Corporation
Merck KGaA
Asahi Kasei Medical Co. Ltd
Sartorius AG
Thermo Fisher Scientific Inc.
- *Disclaimer: Major Players sorted in no particular order
Virus Filtration Market Companies Covered in this Report
- Asahi Kasei
- Danaher Corporation (Pall)
- Merck KGaA (MilliporeSigma)
- Sartorius
- Thermo Fisher Scientific
- Charles River
- Lonza Group
- Wuxi Biologics
- 3M Purification
- Repligen Corp.
- Parker Hannifin (Bioscience)
- Meissner Filtration Products
- FUJIFILM Wako Pure Chemical
- PendoTECH
- Clean Cells SAS
- Alfa Laval
- GE Healthcare Life Sciences
- 3S Bio (Synartro)
- TSI Scientific
- GEA Group

Market Opportunities and Future Outlook
Recent capacity expansions point to whitespace around secure, regionally distributed supply of virus-rated membranes and assemblies. The need is strengthening as biologics, mRNA, and advanced therapy manufacturing scales, with additional facilities adding more single-use and high-throughput unit operations. In July 2026, Asahi Kasei Life Science initiated construction of its fourth spinning plant for Planova hollow-fiber cellulose membrane virus removal filters in Nobeoka City, Miyazaki, Japan (operations scheduled for January 2030). The project is backed by Japan’s Ministry of Economy, Trade and Industry (METI) biopharmaceutical manufacturing initiative, and it is designed to shorten lead times while giving manufacturers additional qualified sources for critical filtration steps.
Technology opportunities persist in integrating virus filtration into continuous downstream processing while maintaining robustness under higher pressures, higher viscosities, and high-titer feeds seen in concentrated antibodies and viral vectors. The transition toward platform validation aligned with ICH Q5A(R2), along with the emergence of more pressure-resistant, high-throughput membranes, creates room for suppliers to combine improved filter hardware with fit-for-purpose scale-down models, in-line monitoring, and documentation packages. This approach can reduce re-validation burdens during process changes and tech transfers across CDMOs and multi-site networks.
Recent Industry Developments in Virus Filtration Market
- July 2026: Asahi Kasei Life Science initiated construction of a new spinning plant in Nobeoka City, Miyazaki, Japan, for Planova hollow-fiber cellulose membrane virus removal filters, supported by Japan’s METI. The expansion strengthens long-term membrane supply for biopharma customers facing tighter viral safety requirements and higher single-use consumption. Operations were communicated on a timeline extending to 2030, signaling multi-year capacity planning for high-volume biologics demand.
- September 2025: Merck KGaA opened a EUR 150 million, 3,000-square-meter climate-neutral filter manufacturing facility in Blarney Business Park, Cork, Ireland, producing filtration products including those used in virus filtration workflows. The site addition expands European manufacturing capacity and provides customers a more localized supply option for critical consumables used in validated filtration trains.
- October 2024: Asahi Kasei Medical launched Planova FG1, a next-generation virus-removal filter positioned around materially higher throughput while maintaining virus removal performance. The product update supports higher-productivity downstream operations and aligns with the market shift toward single-use assemblies and faster validation cycles in biologics and advanced therapy manufacturing.


Virus Filtration Market Report Scope and Research Methodology
Market Definition and Coverage
This market covers virus filtration solutions used to remove or reduce viral contaminants during manufacturing and use, typically through filtration systems, consumables, and related services that support viral safety and quality needs.
Scope exclusions: It excludes adjacent steps that are not virus filtration itself, such as upstream cell culture media, general sterilization equipment, and non-filtration viral inactivation methods when sold as standalone offerings.
Segments Covered in This Report
- By Product
- Filtration Systems
- Membrane-based filters
- Depth filters
- Hollow-fiber filters
- Nanofiltration modules
- Kits, Reagents & Consumables
- Integrity test reagents
- Prefilters & membranes
- Services
- Virus clearance studies
- Validation & consulting
- Filtration Systems
- By Filtration Mode
- Batch Filtration
- Continuous / In-line Filtration
- By Application
- Biologicals
- Vaccines & Therapeutics
- Blood & Plasma Products
- Cellular & Gene Therapies
- Tissue-derived Products
- Other Biologics
- Medical Devices
- Water Purification
- Air Purification
- Biologicals
- By End User
- Pharmaceutical & Biotechnology Companies
- Contract Development & Manufacturing Organizations (CDMOs/CMOs)
- Contract Research Organizations (CROs)
- Academic & Government Labs
- Geography
- North America
- United States
- Canada
- Mexico
- Europe
- Germany
- United Kingdom
- France
- Italy
- Spain
- Rest of Europe
- Asia-Pacific
- China
- Japan
- India
- Australia
- South Korea
- Rest of Asia-Pacific
- Middle East & Africa
- GCC
- South Africa
- Rest of Middle East & Africa
- South America
- Brazil
- Argentina
- Rest of South America
- North America
Data Sources, Market Sizing, and Validation
Desk Research
Desk work starts by mapping where virus filtration is used and what drives demand across biologics and other applications. We rely on public sources such as US FDA and EMA guidance on viral safety expectations, WHO technical documents for biologics and vaccines, and CDC references where they help explain risk control practices.
To ground the model inputs, we also review sources such as UN Comtrade for trade flows of relevant filtration-related categories, World Bank macro indicators for healthcare and manufacturing context, and peer-reviewed bioprocessing journals that describe process steps and filtration performance expectations. Company filings, investor presentations, and credible press coverage are used to track capacity additions, product launches, and adoption themes, and a paid subscription for company financials and a patent database is used to cross-check timelines and product focus. These examples are illustrative, and many other public sources were also used for data collection, validation, and clarification.
Primary Interviews and Surveys
Primary work is used to pressure-test demand drivers and pricing logic with stakeholders across bioprocessing and filtration supply chains, including manufacturers, service providers, and buyers operating in regulated environments. For a global market, coverage is balanced across major production hubs and buyer regions, and follow-ups are done when desk indicators and interview feedback do not match.
The respondent mix is designed to capture both deployment realities (for example, how often filters are replaced in practice) and decision factors that affect procurement volumes and contract pricing.
Distribution of primary research fieldwork respondents
| Company type | Respondent position | Region |
|---|---|---|
| Top tier: 28% | CXOs: 13% | APAC: 52% |
| Mid tier: 58% | Functional/Unit leaders: 33% | EMEA: 29% |
| Smaller Players: 14% | Managers: 54% | Americas: 19% |
Market-Sizing & Forecasting
Sizing is built using a top-down and bottom-up approach, where the top-down view reconstructs the demand pool from bioprocessing activity and filtration penetration across key use areas, and then the totals are checked using selective supplier and channel approximations. In practice, we start from application-level activity signals like biologics and vaccine manufacturing intensity, the mix shift toward high-value biologics, and the share of processes that require dedicated virus filtration steps.
Key inputs that shape the model include biologics production expansion and utilization, the number and scale of batch campaigns, adoption of single-use and continuous or in-line filtration modes, typical filter replacement frequency, and average selling price movement for systems and consumables as process complexity rises. Where bottom-up information is patchy, the gaps are handled through conservative ranges for volume per campaign and pricing bands, which are then narrowed using interview checks. Forecasts are generated using scenario analysis, with the base case anchored to expected biologics pipeline commercialization and capacity additions, and upside and downside cases reflecting slower approvals or delayed plant ramp-ups that respondents flagged.
Data Validation & Update Cycle
Outputs are validated by comparing the model against independent signals such as biologics capacity expansion announcements, trade and production direction, and the pace of adoption for continuous and single-use processing. When a country or application shows a sharp jump that is not supported by these signals, assumptions are revisited and, when needed, respondents are re-contacted to confirm what changed.
Before sign-off, the work is reviewed in steps, including internal checks for year-to-year continuity, currency conversion consistency, and logical alignment between pricing and volume drivers. The report is refreshed annually, and interim updates are made when material events occur, followed by a final analyst pass right before delivery so clients receive the latest updated view.
Mordor Intelligence's Virus Filtration Market Size Versus Other Published Estimates
Published market sizes for virus filtration often do not match because scope boundaries and year choices are not the same, and because pricing and volume assumptions are updated at different speeds. The table makes the spread visible, and it helps explain how two credible-looking numbers can still be far apart.
The table also points to a common driver in this market, which is whether estimates focus on bioprocess virus filtration only or also fold in broader air and water purification uses and extra lab workflows, and then apply faster growth assumptions on top. In Mordor Intelligence's model, the 2026 value is tied to the defined product and application scope (including filtration systems, consumables, and services across listed application areas) and is cross-checked with filtration mode adoption and end-user demand signals before the forecast is extended.
Benchmark comparison
| Source | Market Size | Gaps in Research Methodology |
|---|---|---|
| Mordor Intelligence | USD 1.65 B (2026) | |
| Global Publisher A | USD 5.86 B (2024) | Uses an earlier base year and a broader interpretation of applications, which can pull in more non-bioprocess demand areas, and the higher CAGR assumption lifts the starting point when back-calculated. |
| Industry Publisher B | USD 5.81 B (2025) | Anchors the market on a historical year value with wider end-use framing, and the long-range forecast horizon tends to apply aggressive growth across products without making filtration mode and replacement-cycle checks explicit. |
Reading the three values together, the biggest difference comes from how wide the application net is cast and how fast pricing and adoption are allowed to move. With clear inclusions, practical volume drivers, and repeatable checks, our estimate stays traceable to demand activity rather than only to high-level growth expectations.


Key Questions Answered in the Report
What is the current size of the virus filtration market?
The virus filtration market size stood at USD 1.65 billion in 2026 and is projected to reach USD 2.31 billion by 2031.
Which region leads the virus filtration market today?
North America led with 42.74% revenue share in 2025, benefiting from strong R&D pipelines and rigorous FDA oversight.
Why are single-use filters gaining popularity in biomanufacturing?
Single-use systems minimize cleaning validation, reduce cross-contamination risk, and offer campaign flexibility, which accelerates product changeovers and lowers operating cost.
Which application is growing fastest within virus filtration?
Medical devices, particularly blood and air-purification products, are exhibiting the highest 10.54% CAGR thanks to new clinical use cases and regulatory fast tracks.
How does continuous bioprocessing influence virus-removal strategies?
Continuous operations require in-line virus filtration capable of steady-state performance, real-time monitoring, and rapid membrane change-out without halting production, thereby improving plant utilization.
What are the principal barriers to wider adoption of high-capacity filtration skids?
High capital expenditure, extended validation timelines, and operator-training requirements can deter smaller firms, though equipment leasing and modular designs are beginning to ease these hurdles.
Page last updated on:


 Your data is secure and never sold or shared.


