Tangential Flow Filtration Market Size and Share
Market Overview
| Study Period | 2020 - 2031 |
|---|---|
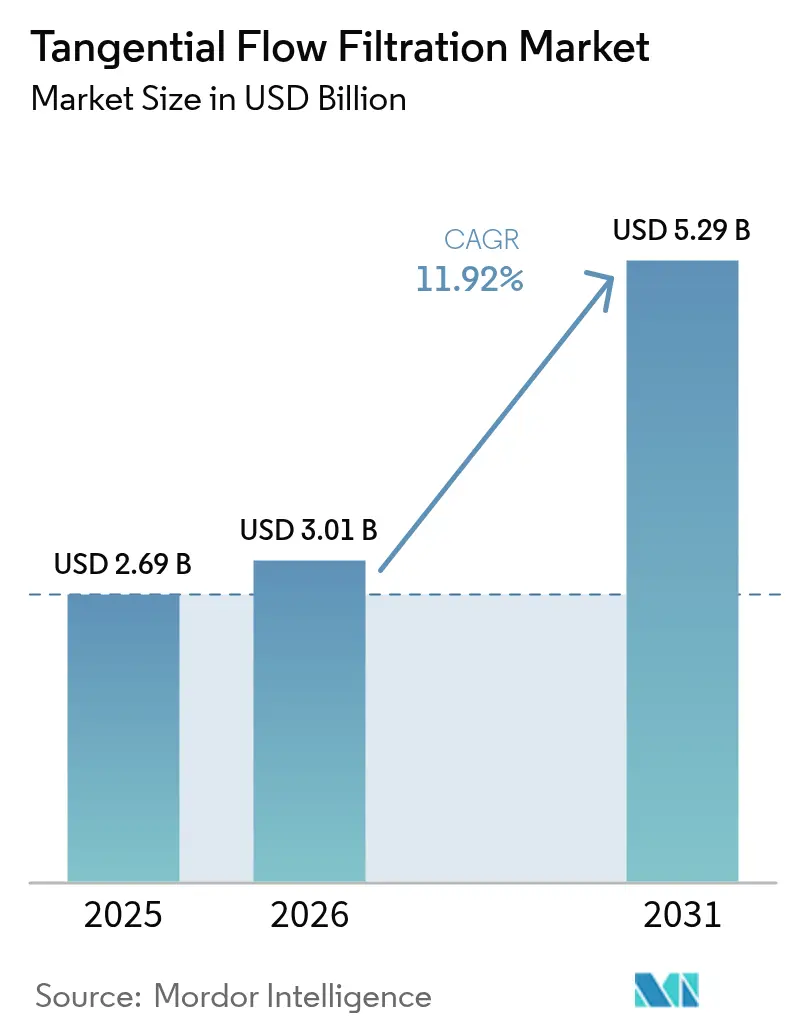
| Market Size (2026) | USD 3.01 Billion |
| Market Size (2031) | USD 5.29 Billion |
| Growth Rate (2026 - 2031) | 11.92% CAGR |
| Fastest Growing Market | Asia Pacific |
| Largest Market | North America |
| Market Concentration | Medium |
Major Players *Disclaimer: Major Players sorted in no particular order Image © Mordor Intelligence. Reuse requires attribution under CC BY 4.0. | |
Tangential Flow Filtration Market Analysis by Mordor Intelligence
tangential flow filtration market size in 2026 is estimated at USD 3.01 billion, growing from 2025 value of USD 2.69 billion with 2031 projections showing USD 5.29 billion, growing at 11.92% CAGR over 2026-2031. Sustained investment in process-intensified, continuous biomanufacturing lines, the rapid scale-up of gene therapy plants, and an accelerated shift toward single-use equipment all underpin this double-digit expansion. Contract development organizations in Asia are commissioning large-footprint greenfield plants, while incumbent North American and European producers are retrofitting legacy facilities to boost throughput without expanding cleanroom space. Ongoing integration of inline analytics with filtration skids shortens process-development cycles and lowers failure rates, pushing end users to favor fully integrated system packages. At the same time, supply-chain friction in GMP-grade membranes and tightening rules on plastic waste are sharpening vendor focus on material innovation and recycling programs.
Key Report Takeaways
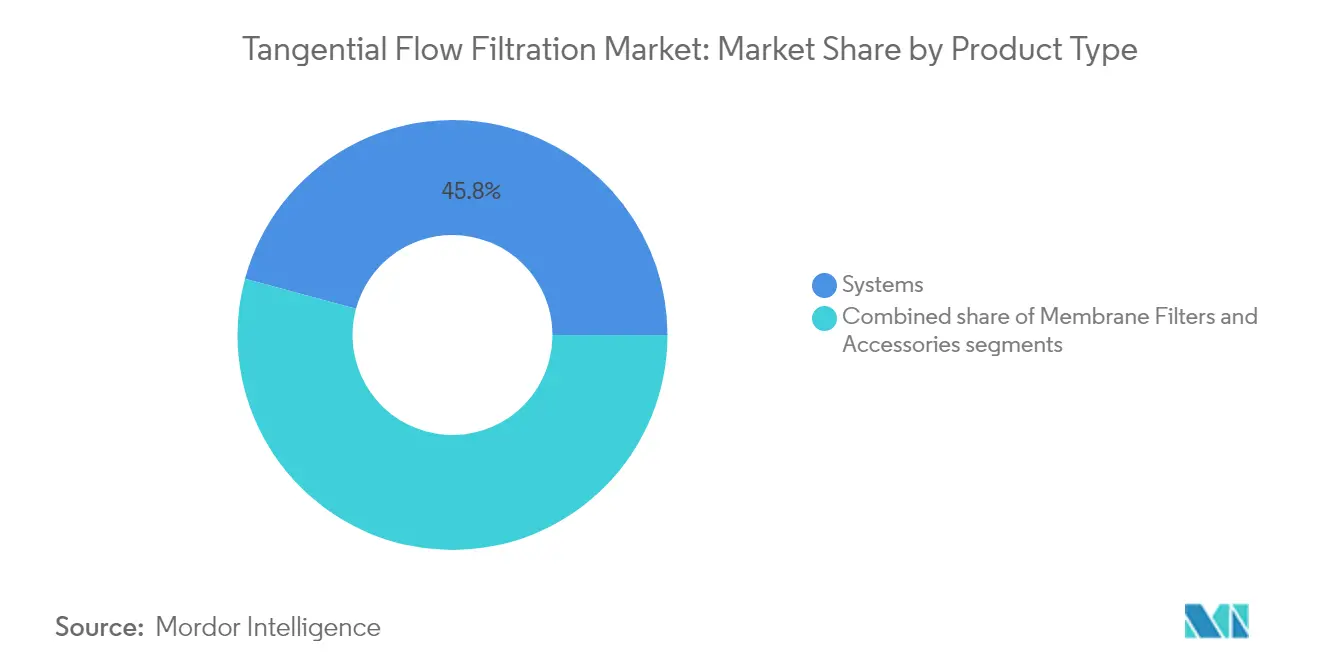
- By product type, systems held 45.78% of tangential flow filtration market share in 2025, whereas membrane filters are projected to expand at a 14.38% CAGR through 2031.
- By technology, ultrafiltration led with 56.98% revenue share in 2025; microfiltration is poised for the fastest growth at a 14.51% CAGR to 2031.
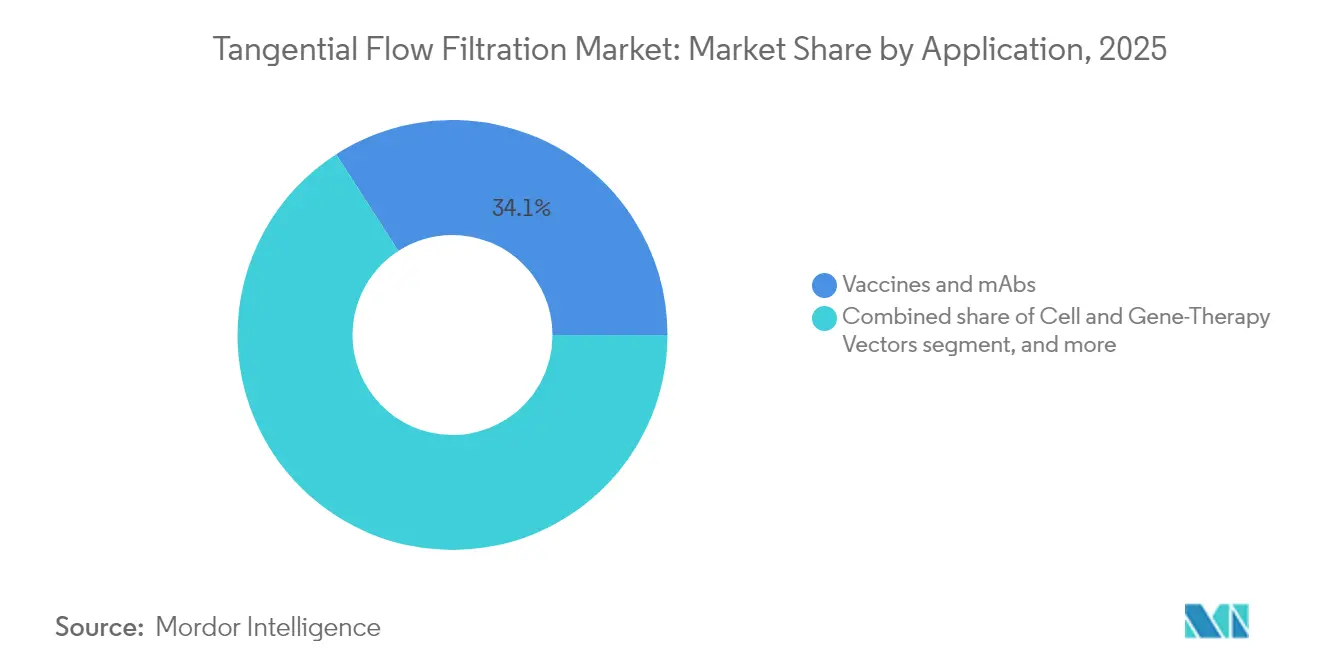
- By application, vaccines and monoclonal antibodies accounted for a 34.10% share of the tangential flow filtration market size in 2025, while cell and gene therapy vectors are forecast to grow at 15.18% CAGR through 2031.
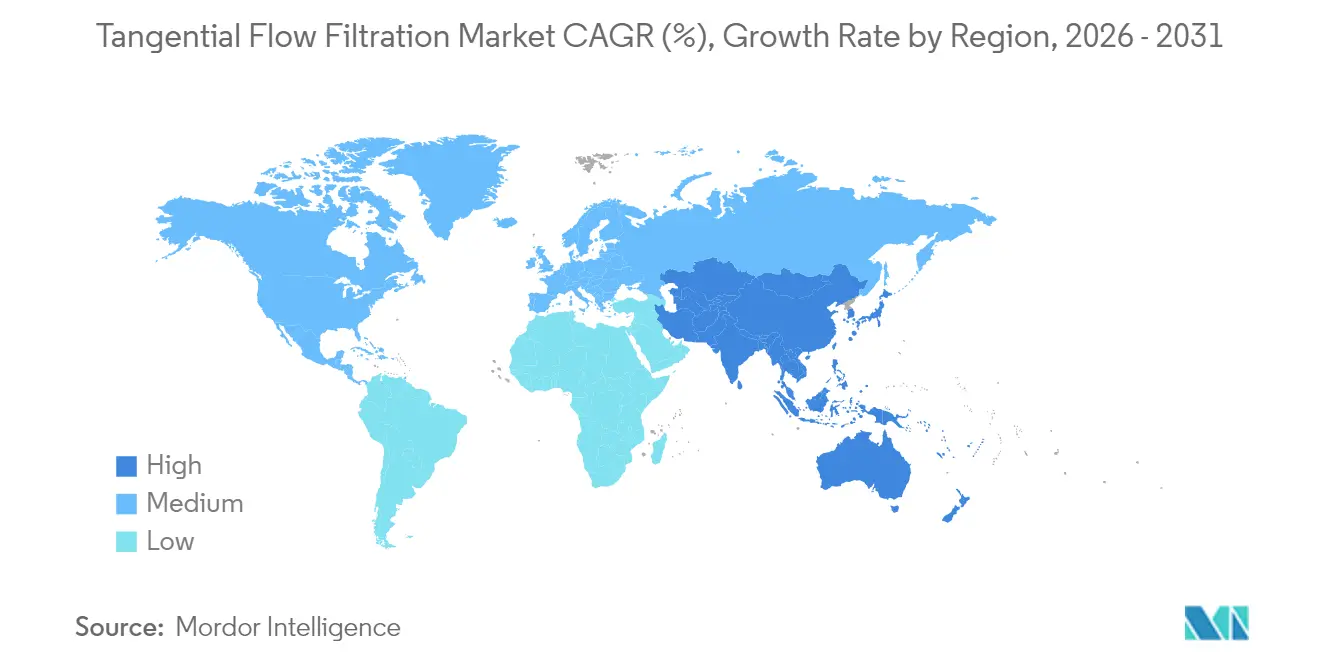
- By geography, North America dominated with 39.15% revenue share in 2025; Asia-Pacific is projected to post the highest 13.22% CAGR up to 2031.
- By end user, biopharma manufacturers commanded 57.85% demand in 2025, yet CDMOs are advancing at a 15.18% CAGR to 2031.
Note: Market size and forecast figures in this report are generated using Mordor Intelligence’s proprietary estimation framework, updated with the latest available data and insights as of 2026.
Global Tangential Flow Filtration Market Trends and Insights
Drivers Impact Analysis*
| Driver | % Impact on CAGR Forecast | Geographic Relevance | Impact Timeline |
|---|---|---|---|
| Single-Use Systems Slash Change-Over Time | +2.8% | Global, early uptake in North America and EU | Medium term (2-4 years) |
| Growing Adoption of Continuous Bioprocessing | +2.1% | North America and EU core, expanding into Asia-Pacific | Long term (≥ 4 years) |
| High-Throughput Screening Cassettes for Gene-Therapy Vectors | +1.9% | North America and EU, selective Asia-Pacific markets | Medium term (2-4 years) |
| Biopharma Shift to High-Cell-Density Perfusion | +1.7% | Global, strongest in established manufacturing hubs | Medium term (2-4 years) |
| CAPEX-Light CDMO Build-Outs in Emerging Asia | +2.3% | Asia-Pacific core, spill-over to Middle East & Africa | Long term (≥ 4 years) |
| ESG-Driven Water-Recycling Mandates | +1.5% | EU and North America, expanding globally | Long term (≥ 4 years) |
| Source: Mordor Intelligence | |||
Single-Use Systems Slash Change-Over Time
Single-use tangential flow filtration systems eliminate the 4-8-hour cleaning validation windows that previously limited multiproduct facilities, delivering a documented 27% uplift in development-stage productivity[1]Thermo Fisher Scientific, “Single-Use Technologies in Bioprocessing,” thermofisher.com. Adoption has broadened beyond traditional monoclonal antibody plants to cell and gene therapy suites, where dedicated run campaigns heighten contamination concerns. Regulators increasingly guide toward disposable assemblies because sterility assurance is inherent and validation files are slimmer, a position mirrored across recent FDA facility inspection trends. Yet the sustainability conversation is intensifying; life-cycle assessments now inform purchasing decisions, spurring suppliers to advance biodegradable membranes and closed-loop plastic reclamation schemes.
Growing Adoption of Continuous Bioprocessing
Continuous bioprocessing repositions tangential flow filtration as a permanently online operation that maintains steady-state production for weeks, cutting the typical facility footprint by 50-70% while tightening quality variance among lots. Perfusion cultures running above 100 million cells/mL require robust cell-retention modules, a capability strongly favored by gene therapy producers because shorter residence times curb vector degradation. Digital-twin modeling now fine-tunes flux, shear, and trans-membrane pressure in real time, as demonstrated by Samsung Biologics’ pilot lines[2]Pharma’s Almanac, “Digital Twins Transform Bioreactor Design,” pharmasalmanac.com.
High-Throughput Screening Cassettes for Gene-Therapy Vectors
Manufacturing adeno-associated virus vectors at commercial scale depends on filtration cassettes that safeguard delicate capsids while processing high-viscosity harvests. Recent enzyme-evolution screening platforms push 10 million mutants per day, raising complexity for downstream separation[3]Phys.org Staff, “Droplet Sorting Revolutionizes Enzyme Screening,” phys.org. Suppliers with validated viral-vector cassettes therefore command price premiums and face fewer competitive entrants because regulatory hurdles are steeper than in classical protein purification.
Biopharma Shift to High-Cell-Density Perfusion
Perfusion runs operating 5-10 times traditional cell densities deliver sustained high titers but also place new stress on filter modules charged with cell retention and nutrient exchange. Specialized hollow fibers featuring tighter molecular-weight cutoffs and fouling-resistant coatings have emerged to support bispecific antibody and conjugate production. Though productivity economics are compelling, the requirement for advanced process-control architecture and seasoned operators explains a still-gradual global rollout, leaving room for equipment makers that can embed turnkey automation and analytics within filtration skids.
Restraints Impact Analysis*
| Restraints Impact Analysis | (~) % Impact on CAGR Forecast | Geographic Relevance | Impact Timeline |
|---|---|---|---|
| Shear-Sensitive Modalities Limit Flux Rates | -1.4% | Global, notably in high-value viral vectors | Short term (≤ 2 years) |
| Scarcity of GMP-Grade Hollow-Fiber Supply | -1.8% | Global, most acute in specialized viral applications | Medium term (2-4 years) |
| Learning-Curve Risk in Process-Automation Adoption | -0.9% | Emerging markets and smaller manufacturers | Medium term (2-4 years) |
| Export-Control Rules on Single-Use Plastics | -1.2% | Cross-border manufacturing and emerging markets | Short term (≤ 2 years) |
| Source: Mordor Intelligence | |||
Shear-Sensitive Modalities Limit Flux Rates
Complex biologics such as viral vectors cannot tolerate high shear, forcing operators to run filters at throughput levels that are 50-75% lower than monoclonal antibody norms. Even with surface-modified membranes that reduce stress points, core physics restrict the ability to accelerate flows without risking capsid rupture, thus prolonging cycle times and squeezing facility capacity.
Scarcity of GMP-Grade Hollow-Fiber Supply
Lead times for large-pore, GMP-qualified hollow fibers now stretch to 12-18 months because only a few validated manufacturers exist. Export-control constraints and protracted vendor-requalification rules dissuade newcomers. As a result, users pay premiums and sometimes re-engineer downstream trains around alternative membranes, postponing launch schedules and inflating development budgets.
*Our forecasts treat driver/restraint impacts as directional, not additive. The impact forecasts reflect baseline growth, mix effects, and variable interactions.
Segment Analysis
By Product Type: Integrated Systems Anchor Procurement Strategies
Systems accounted for a 45.78% tangential flow filtration market share in 2025, reflecting user preference for turnkey assemblies that couple pumps, controllers, and real-time sensors under a single validation envelope. Demand remains resilient because multinationals routinely upgrade installed skids to align with tightening data-integrity and automation mandates. In parallel, the tangential flow filtration market size allocated to membrane filters is climbing at a 14.38% CAGR to 2031 as single-use programs require fresh cassettes for each campaign. Disposable membrane uptake is particularly sharp in gene therapy suites, where cross-contamination risk is less acceptable and changeover speed carries premium value.
Accessories such as pre-conditioners, flow-path sensors, and disposable conductivity probes are the smallest dollar segment yet record steady, mid-single-digit growth. Suppliers bundle these add-ons with service agreements, expanding revenue beyond hardware. Repligen’s recently launched SoloVPE Plus system exemplifies the push toward integrated analytics, shortening concentration tests by 70% and feeding back to automated filter-control loops. This convergence of hardware and analytics delivers higher margins to vendors while reducing batch-failure risk for users.


By Technology: Microfiltration Narrows the Gap with Ultrafiltration
Ultrafiltration retained 56.98% revenue in 2025 given its entrenchment in buffer-exchange and concentration steps for classical biologics. Nevertheless, microfiltration is projected to expand at a 14.51% CAGR through 2031, propelled by high-cell-density perfusion cultures that depend on tight cell-retention cutoffs. The tangential flow filtration market size apportioned to microfiltration modules is therefore growing faster than the macroscale figure, stimulated by viral vector facilities that demand precise pore distribution for debris removal.Breakthroughs in polymer chemistry, specifically polyethersulfone blends and regenerated-cellulose coatings, are boosting flux stability and fouling resistance during long perfusion runs. Innovations are also surfacing in gradient-pore architectures that pair high retentate selectivity with low trans-membrane pressure, features that align with the shear-sensitivity of new biologic entities. Reverse osmosis and nanofiltration remain niche, handling mainly utility water polishing, and their share is unlikely to budge materially across the forecast window.
By Application: Gene Therapy Vectors Catalyze Segment Diversification
Vaccines and monoclonal antibodies held a 34.10% share of the tangential flow filtration market in 2025 and still represent the largest revenue block. However, cell and gene therapy vectors are rising at a 15.18% CAGR over 2026-2031, riding a pipeline wave of approved adeno-associated virus and lentivirus products. This redirection of capital towards personalized and curative treatments compels filter vendors to validate cassettes that can separate full from empty capsids without undue shear.Plasma-derived proteins remain a stable yet low-growth niche as recombinant substitutes erode addressable demand. Specialty areas such as biosimilars and bispecific antibodies add moderate diversification, but the gravitational center of innovation clearly sits with gene therapy. Asahi Kasei’s virus-removal Planova range illustrates the performance required, integrating validated logs of viral clearance without compromising product recovery.
By End User: CDMOs Accelerate Outsourcing Momentum
Biopharma manufacturers consumed 57.85% of equipment in 2025, yet CDMOs are registering a 15.18% CAGR that will narrow the gap quickly. Smaller biotechnology sponsors find it capital-efficient to outsource complex filtration steps rather than invest in fully compliant facilities. Established pharmaceutical majors likewise divest non-core production as they reorient toward discovery. Consequently, the tangential flow filtration market increasingly hinges on service providers that negotiate long-term supply agreements and co-develop bespoke filtration trains to attract molecule owners.Asia-based giants like Samsung Biologics and Lotte Biologics illustrate this surge. Samsung’s USD 6 billion expansion adds one of the globe’s largest single sites for hybrid single-use and stainless operations, locking in multiple Western sponsors. CDMOs differentiate by deploying cutting-edge analytics, so suppliers bundling sensors, software, and membranes into one invoice gain procurement preference.
Geography Analysis
North America generated 39.15% of 2025 revenue in the tangential flow filtration market, supported by advanced R&D clusters, a well-defined FDA validation pathway, and deep installed capacity across vaccines, antibodies, and viral vectors. Mergers such as Thermo Fisher Scientific’s USD 4.1 billion purchase of Solventum’s purification business underscore the region’s role as the gravitational center for technology consolidation. Persistent talent shortages and raw-material lead-time spikes, however, are prompting some producers to weigh dual-continental supply chains.
Asia-Pacific is on track to post a 13.22% CAGR through 2031, translating into the fastest regional expansion worldwide. Several headline projects, including Samsung Biologics’ USD 6 billion “Plant 5” build and Lotte Biologics’ USD 3.3 billion greenfield complex, are raising local demand for high-capacity filtration skids. Chinese CDMOs such as WuXi Biologics and Chime Biologics are similarly scaling viral-vector suites, further inflating order books. Favorable tax incentives, comparatively low labor costs, and short shipping lanes for polymer resins amplify the region’s competitiveness, although lingering IP and regulatory alignment challenges moderate uptake among some multinational sponsors.
Europe enjoys steady mid-single-digit growth owing to a robust pharmaceutical base and strict environmental statutes that encourage water-reuse and biodegradable filter elements. Brexit-related cross-border friction and high energy prices inflate operating costs but simultaneously bolster the case for continuous processing that squeezes more product out per kilowatt consumed. Middle East & Africa and South America are nascent yet viewable growth pockets; both benefit from government life-science funding programs but still lack the dense supplier and talent ecosystems found in mature markets.

Regulatory Landscape
Tangential flow filtration (TFF) systems, cassettes, and single-use flow paths used in regulated bioprocessing fit within a quality and sterility framework anchored by GMP and medical device quality systems. End users commonly require ISO 13485-aligned documentation alongside bioprocess validation packages. In the United States, the FDA Quality Management System Regulation (QMSR) incorporates ISO 13485:2016 by reference, which elevates the role of design controls, supplier oversight, and traceability for TFF hardware and membrane modules used in GMP manufacturing.
In Europe, EU GMP Annex 1 continues to shape expectations for sterile manufacturing, emphasizing microorganism-retaining filtration, bioburden control, and integrity testing as key control points. That posture tends to increase demand for validated filtration trains and automated monitoring. For single-use TFF components, biocompatibility and material safety requirements such as USP Class VI and ISO 10993 are often built into customer qualification. Industry guidance such as T/SHPPA 025-2024 also provides a structured reference for manufacturing, quality management, and inspection of TFF membrane and cassette devices. Regulatory administration changes can add to compliance cost and timeline complexity, for example Malaysia enacted the Medical Device (Amendment) Regulations 2025 on August 20, 2025, with changes taking effect on January 1, 2026, updating registration and fee structures for device manufacturers and establishments.
Competitive Landscape
The tangential flow filtration market is moderately concentrated, with the top five suppliers collectively controlling a sizable slice of global revenue. Danaher’s Pall unit, Merck KGaA, Sartorius AG, Thermo Fisher Scientific, and Repligen anchor the field, each promoting integrated hardware-analytics platforms. Recent consolidation accelerates this tilt. Thermo Fisher’s Solventum acquisition broadens its purification footprint and offers significant cross-selling to its installed base of bioreactors and chromatography columns. Donaldson Company’s purchase of Solaris Biotechnology enhances its single-use filtration portfolio, illustrating how mid-tier entrants are bulking up capability to chase higher-margin biopharma opportunities.
Technology competition centers on membrane material science, fouling-resistant surface coatings, and embedded sensors that enable closed-loop control. Vendors increasingly couple skids with digital twins and AI-driven predictive maintenance modules to reduce downtime and increase usable membrane life. Single-use portfolios remain pivotal, yet suppliers are working on hybrid offerings that pair disposable flow paths with reusable stainless pressure housings, balancing sustainability mandates with efficiency.
Service wrap-arounds such as process-development consulting, installation qualification, and operator training are critical loyalty levers. CDMOs signing multi-year manufacturing contracts often negotiate life-cycle pricing that bundles membranes, spares, and software licenses into monthly fees, tilting competition away from pure capital expenditure bids.
Tangential Flow Filtration Industry Leaders
Danaher Corporation
Merck KGaA
Sartorius AG
Repligen Corporation
Parker Hannifin Corporation
- *Disclaimer: Major Players sorted in no particular order

Market Opportunities and Future Outlook
Process intensification in biologics manufacturing is widening the addressable use cases for single-pass and continuous TFF configurations, where reduced tankage and simpler facility fit matter for both retrofits and CAPEX-light CDMO build-outs. Published process research in 2025 and 2026 points to practical pathways for continuous concentration and diafiltration, along with approaches for integrating single-pass TFF into intensified monoclonal antibody downstream trains. This reinforces the shift from standalone batch UF/DF toward more connected, membrane-based unit operations.
Automation and material qualification stand out as near-term opportunity areas for suppliers targeting integrated filtration skids with inline sensors (for example UV, pressure, and flow) and closed-loop control to manage fouling and reduce operator dependency. Procurement decisions are also increasingly influenced by single-use validation requirements, including extractables and leachables expectations (often aligned with BioPhorum Operations Group and Bio-Process Systems Alliance protocols) and by tighter sterile manufacturing controls under Annex 1. That combination creates space for suppliers that can deliver validated assemblies, integrity testing solutions, and sustainability programs for disposable flow paths, even as demand remains constrained by limited availability of GMP-grade hollow-fiber supply.
Recent Industry Developments
- June 2026: INITS advanced development of its new 3,200 square meter GMP biomanufacturing facility in Montpellier, France, where it selected Repligen KrosFlo KR2i and KrosFlo KMPi tangential flow filtration systems. The selection supports the site’s use of standardized, single-use capable TFF platforms across customer programs, which can help accelerate tech transfer and keep UF/DF execution consistent for GMP runs.
- November 2025: Parker Hannifin entered into a definitive agreement to acquire Filtration Group Corporation for USD 9.25 billion. The transaction expands Parker's filtration portfolio breadth and manufacturing reach, strengthening its position across life science filtration categories that cover equipment and consumables used in bioprocessing workflows.
- September 2024: Sartorius launched Vivaflow SU, a next-generation tangential flow filtration cassette for lab-scale ultrafiltration and diafiltration. The product release targets higher-throughput development work and improves continuity from process development to scale-up by keeping cassette-based TFF workflows within a single supplier ecosystem.


Research Methodology Framework and Report Scope
Market Definition and Coverage
For this study, the tangential flow filtration market covers revenues from crossflow filtration systems and consumables used to concentrate, clarify, or buffer-exchange biological fluids in lab, pilot, and production settings.
Scope exclusions: Direct-flow (dead-end) filtration and centrifugal separation devices are excluded from this market boundary.
Segmentation Overview
- By Product Type
- Systems
- Single-use Tangential Flow Filtration Systems
- Re-usable Tangential Flow Filtration Systems
- Membrane Filters
- Polyethersulfone
- Regenerated Cellulose
- Other Membranes
- Accessories
- Systems
- By Technology
- Ultrafiltration
- Microfiltration
- Reverse Osmosis / Nanofiltration
- By Application
- Vaccines & mAbs
- Cell & Gene-Therapy Vectors
- Plasma-derived Proteins
- Other Applications
- By End-User
- Biopharma Manufacturers
- Contract Development & Manufacturing Organisations (CDMOs)
- Other End-Users
- Geography
- North America
- United States
- Canada
- Mexico
- Europe
- Germany
- United Kingdom
- France
- Italy
- Spain
- Rest of Europe
- Asia-Pacific
- China
- Japan
- India
- Australia
- South Korea
- Rest of Asia-Pacific
- Middle East & Africa
- GCC
- South Africa
- Rest of Middle East & Africa
- South America
- Brazil
- Argentina
- Rest of South America
- North America
Data Sources, Market Sizing, and Validation
Desk Research
Desk research starts with building a clean view of demand drivers tied to bioprocessing and research activity, then mapping what products are actually bought under tangential flow filtration workflows. We rely on public sources such as the US FDA databases and guidance notes, the US NIH and PubMed literature for filtration usage in biologics workflows, OECD health and R&D indicators, and United Nations Comtrade trade flows for filtration equipment and related materials (where classification fit is checked carefully). Association and standards references, such as those from bioindustry groups and pharmacopeia style publications, help confirm common process steps and the terminology used in supplier documentation.
On the supply side, we review company filings, annual reports, investor presentations, product catalogs, and technical notes to identify what is sold as TFF versus adjacent filtration products. We also use paid subscriptions for company financials and intelligence, patent databases, and shipment-level import and export records when a public series is too broad to isolate the category. The desk sources listed are illustrative, and we used additional public and paid references to fill gaps and validate assumptions against what companies report.
Primary Interviews and Surveys
Primary work is used to pressure-test the sizing logic with people who participate in TFF decisions, including process development teams, manufacturing and validation managers, procurement leads, and distribution-side specialists. For the global view, we cover APAC, EMEA, and the Americas so regional pricing, single-use adoption patterns, and biomanufacturing scale effects are represented, and then we reconcile the differences back into the model assumptions.
Distribution of primary research fieldwork respondents
| Company type | Respondent position | Region |
|---|---|---|
| Top tier: 29% | CXOs: 15% | APAC: 45% |
| Mid tier: 52% | Functional/Unit leaders: 42% | EMEA: 30% |
| Smaller Players: 19% | Managers: 43% | Americas: 25% |
Market-Sizing & Forecasting
The core model uses top-down logic where biomanufacturing and research activity indicators are converted into a TFF demand pool through penetration and usage assumptions, then expressed in value using price ladders by product type and scale of use. To keep the totals realistic, we corroborate with selective bottom-up approximations, such as sampled system placements, consumables replacement cycles, and channel feedback on average selling prices (ASPs), and then we adjust where gaps appear.
Inputs are chosen to match how TFF is purchased and consumed, so the model uses indicators like biologics pipeline and manufacturing scale-up signals, the single-use versus reusable mix, average filtration batch volumes, membrane area needs per run, and replacement frequency for cassettes or hollow-fiber modules. Pricing is handled through ASP bands that reflect configuration differences and typical discounting behavior. When a public source cannot isolate a line item cleanly, we apply conservative allocation rules and validate them through interviews. Forecasts are generated using scenario analysis supported by near-term visibility on bioprocess capacity additions, regulatory and quality expectations, and expected ASP movement, and we keep the assumptions readable so the steps can be replicated later.
Data Validation & Update Cycle
Validation is done by triangulating model totals against independent signals, such as bioprocessing capacity expansion announcements, observed ordering patterns shared by channel participants, and consistency checks versus related filtration spend trends. If an outlier shows up by region or by year, we rework it through variance checks on penetration, ASP bands, and replacement cycles, followed by an internal analyst review before sign-off.
The report is refreshed annually, and interim updates are triggered when material events occur, such as major capacity expansions, meaningful price shifts, or regulation-driven process changes. Before delivery, we recheck the latest public inputs and revalidate key assumptions that move the numbers through quick call-backs, so clients get an updated view that aligns with the current market context.
Mordor Intelligence's Tangential Flow Filtration Market Size Compared With Other Published Estimates
Published values for tangential flow filtration often do not line up because the reporting year, currency conversion timing, and how pricing is built for consumables versus systems can be handled differently. Numbers also move when authors include adjacent filtration methods or when single-use adoption is treated as an immediate step-change instead of a gradual shift.
In this study, price ladders are refreshed with recent ASP checks and normalized into USD using consistent timing assumptions. That refresh discipline is why the 2026 value of USD 3.01 B can look different from figures anchored on 2024 or 2025 and then projected forward, which is a choice applied by Mordor Intelligence.
Benchmark comparison
| Source | Market Size | Gaps in Research Methodology |
|---|---|---|
| Mordor Intelligence | USD 3.01 B (2026) | |
| Global Consultancy A | USD 2.05 B (2024) | Anchors on a 2024 base year with a 2025 to 2030 forecast window, so the headline value reflects earlier-year pricing and mix before later single-use penetration is fully realized. |
| Industry Publisher B | USD 1.86 B (2025) | Uses a 2025 starting point and may apply narrower product inclusion and more conservative ASP progression for consumables, which typically lowers the reported size versus later-year normalized pricing. |
The spread is mainly explained by different base years and how pricing and mix carry into the modeled year, rather than a disagreement that the category is growing. By keeping scope exclusions clear and tying volumes to practical usage metrics, our estimate stays traceable to inputs that can be checked and updated as new signals appear.


Key Questions Answered in the Report
What is the current size of the tangential flow filtration market and how fast is it growing?
The market stands at USD 3.01 billion in 2026 and is projected to reach USD 5.29 billion by 2031, advancing at a 11.92% CAGR over 2026-2031.
Which product category holds the largest share?
Integrated systems lead with a 45.78% revenue share in 2025 thanks to their turnkey design and embedded analytics.
Which region is expected to post the strongest growth?
Asia-Pacific is forecast to expand at a 13.22% CAGR through 2031, driven by multi-billion-dollar CDMO capacity additions.
How are CDMOs influencing demand?
CDMOs are expanding at a 15.18% CAGR through 2031, accelerating purchases of single-use membranes and high-capacity skids to attract outsourced projects.
What technology trend is most reshaping filtration workflows?
Continuous bioprocessing is integrating tangential flow filtration into steady-state operations, trimming facility footprints by up to 70% and boosting consistency.
What is the chief supply-side restraint?
Limited global capacity for GMP-grade hollow fiber membranes is stretching lead times to 12-18 months and inflating project costs.
Page last updated on:


