Kitchenware Market Size and Share
Market Overview
| Study Period | 2020 - 2031 |
|---|---|
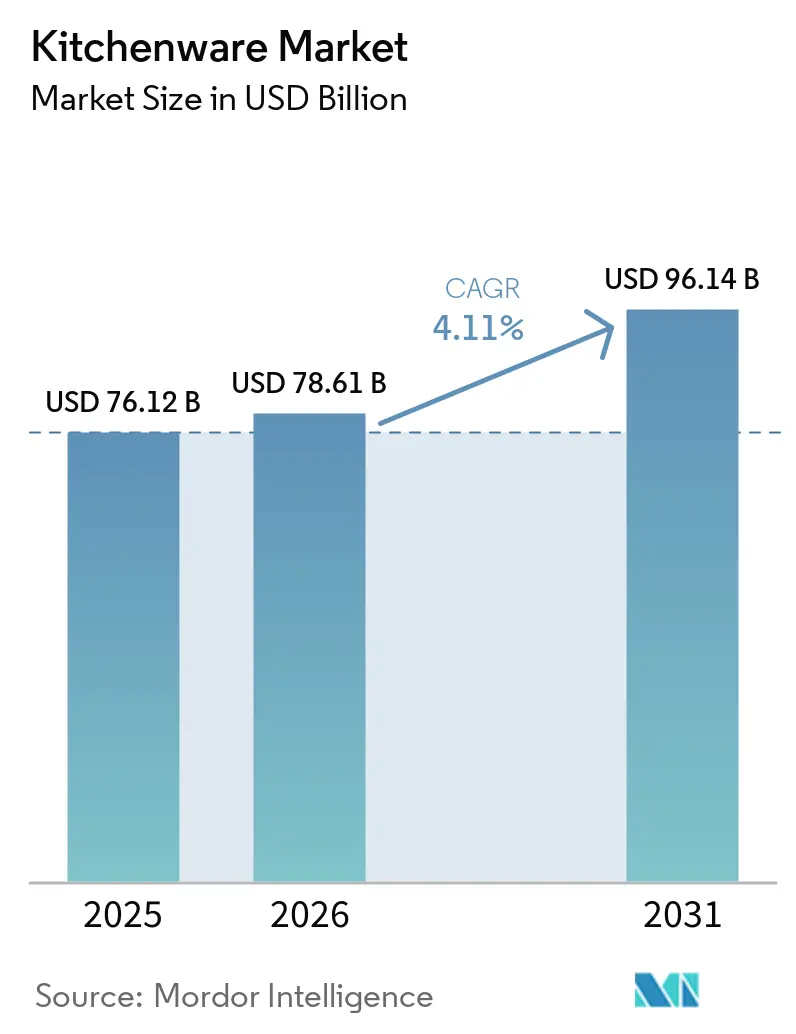
| Market Size (2026) | USD 78.61 Billion |
| Market Size (2031) | USD 96.14 Billion |
| Growth Rate (2026 - 2031) | 4.11% CAGR |
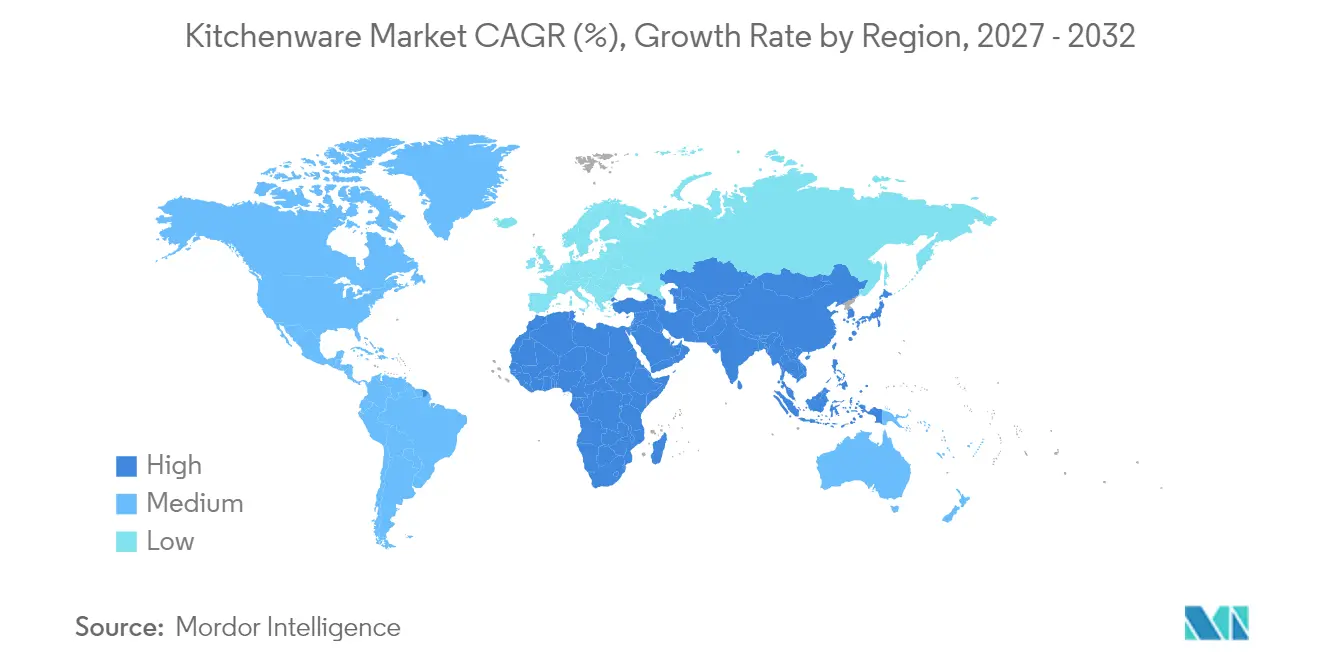
| Fastest Growing Market | Asia-Pacific |
| Largest Market | North America |
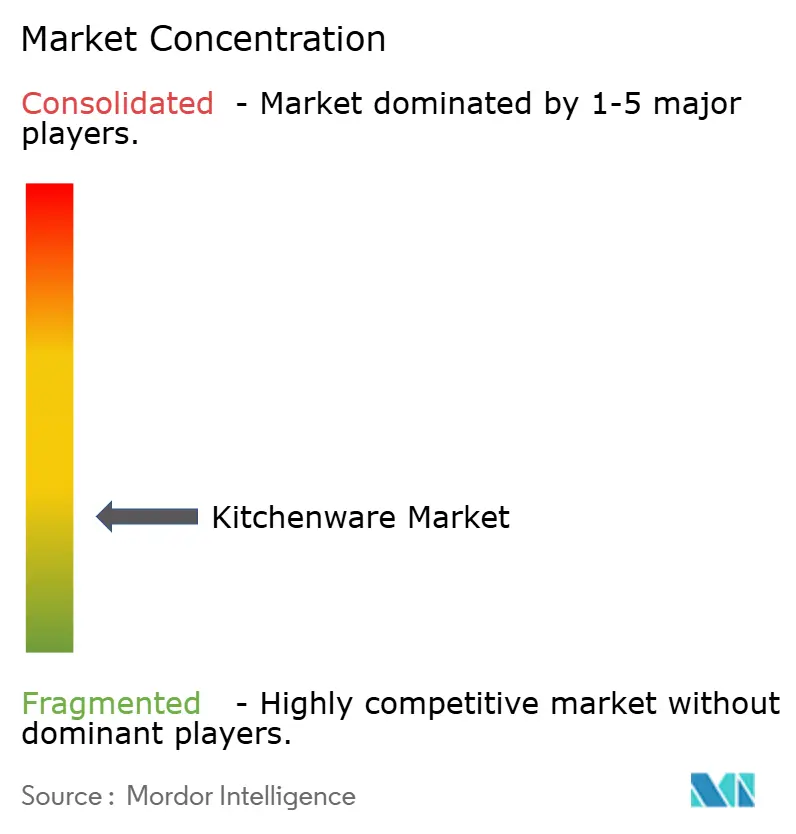
| Market Concentration | Low |
Major Players *Disclaimer: Major Players sorted in no particular order Image © Mordor Intelligence. Reuse requires attribution under CC BY 4.0. | |
Kitchenware Market Analysis by Mordor Intelligence
The Kitchenware Market size is projected to expand from USD 76.12 billion in 2025 and USD 78.61 billion in 2026 to USD 96.14 billion by 2031, registering a CAGR of 4.11% between 2026 to 2031.
The global kitchenware market is being reshaped by PFAS restrictions, which are redirecting coatings innovation toward PFAS-free ceramics and stainless-clad options. Building electrification and induction standards are shifting cookware replacement cycles as consumers and commercial buyers prioritize induction-ready materials. Digital retail continues to compress discovery-to-purchase timelines while enabling direct-to-consumer brands to reach scale without legacy intermediaries. Professional out-of-home dining investment cycles are extending demand for durable, high-throughput cookware in hotels and foodservice operations. Asia-Pacific’s role as both a demand center and a manufacturing base supports scale advantages for multinational brands and regional leaders.
Key Report Takeaways
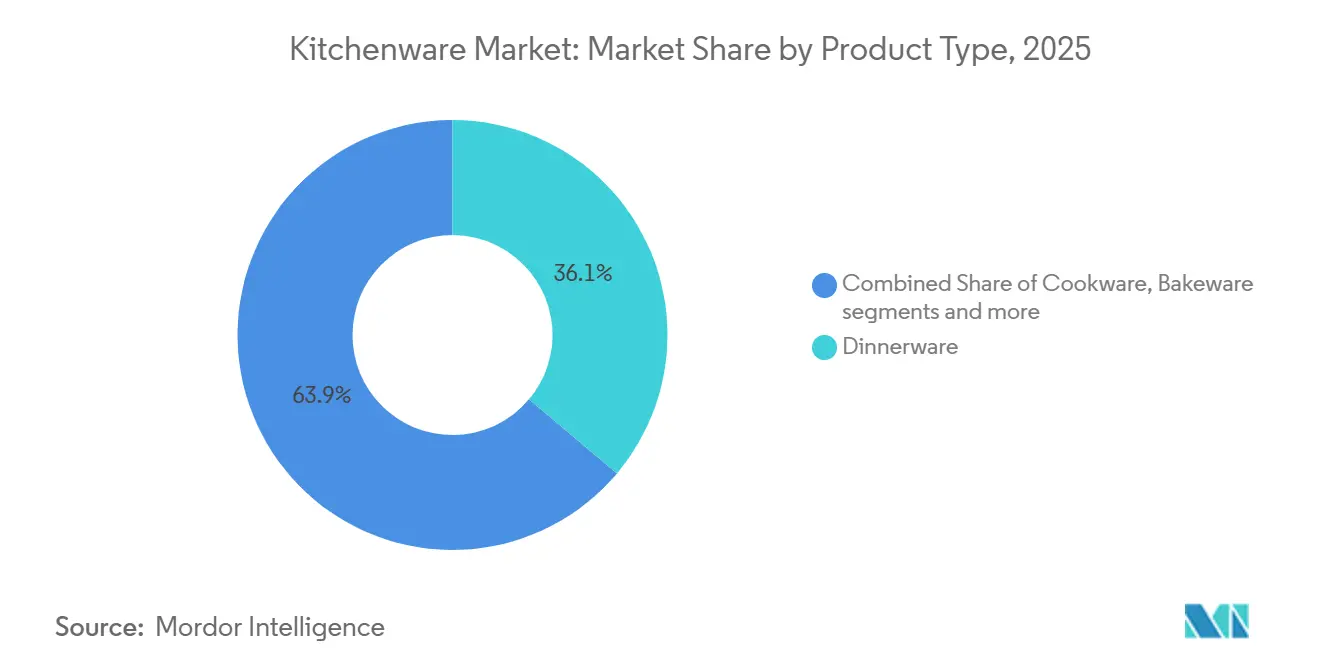
- By product type, dinnerware led with 36.13% of the kitchenware market share in 2025, while bakeware is forecast to expand at a 5.95% CAGR through 2031.
- By material, stainless steel held 55.72% of the global kitchenware market share in 2025, whereas non-stick ceramic and PTFE-free materials are projected to grow at a 5.62% CAGR through 2031.
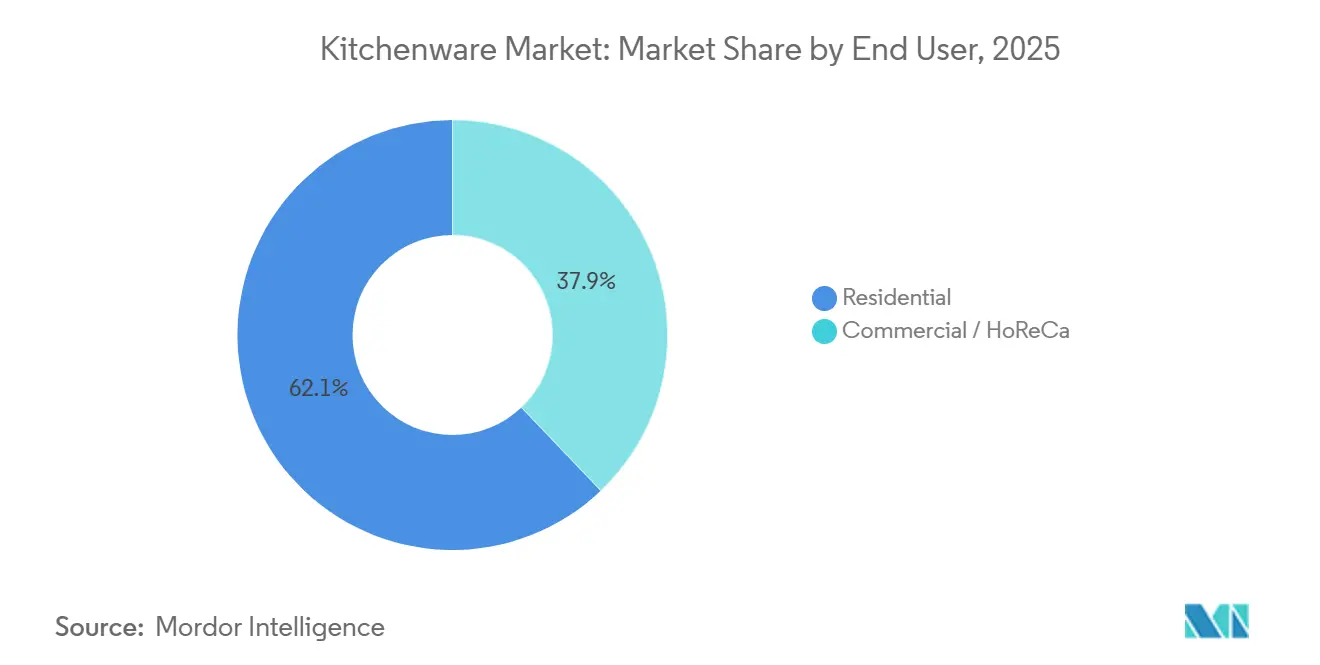
- By end user, residential accounted for 62.12% of the kitchenware market share in 2025, while commercial/HoReCa is projected to advance at a 4.56% CAGR through 2031.
- By distribution channel, supermarkets/hypermarkets held 44.14% of the kitchenware market share in 2025, whereas online retail is forecast to post a 5.94% CAGR through 2031.
- By geography, North America captured 34.11% of the kitchenware market share in 2025, while Asia-Pacific is projected to record a 4.91% CAGR through 2031.
Note: Market size and forecast figures in this report are generated using Mordor Intelligence’s proprietary estimation framework, updated with the latest available data and insights as of 2026.
Global Kitchenware Market Trends and Insights
Drivers Impact Analysis*
| Driver | (~) % Impact on CAGR Forecast | Geographic Relevance | Impact Timeline |
|---|---|---|---|
| Enduring home-cooking and at-home entertaining | +1.2% | Global, with concentration in North America, Europe, and spillover to urban Asia-Pacific | Medium term (2-4 years) |
| Omnichannel retail and e-commerce penetration in kitchenware | +0.9% | Global, led by North America, China, and the rapid growth in Southeast Asia | Medium term (2-4 years) |
| HoReCa expansion and refurbishment cycles post-2025 | +0.8% | North America, Western Europe core; Middle East emerging | Medium term (2-4 years) |
| Asia-Pacific demand depth and supply footprint | +1.3% | India, China, Southeast Asia (Vietnam, Indonesia, Thailand) | Long term (≥ 4 years) |
| Induction adoption driving induction-ready cookware upgrades | +0.7% | Europe, expanding to North America; early gains in Japan, South Korea | Medium term (2-4 years) |
| PFAS regulatory shift accelerating PFAS-free materials | +0.6% | United States (state-level), EU (REACH), spillover to Canada, Australia | Short term (≤ 2 years) |
| Source: Mordor Intelligence | |||
Enduring Home-Cooking and At-Home Entertaining
At-home food preparation remains elevated as households continue the routines formed over the past few years. Penn State Extension’s 2026 analysis highlights persistent interest in scratch cooking and batch preparation formats that favor versatile cookware and bakeware that can present well on the table. The same review notes a tilt toward buffet-style service and hosts who prefer to cook themselves, which sustains demand for durable pans, roasting vessels, and serveware that perform in both preparation and presentation. Younger consumers are adopting premium kitchen tools as part of home-upgrade milestones, which supports higher value sets and specialty items that give consistent results. Retail promotions and loyalty programs are reinforcing this behavior, such as recent premium cookware redemption offers that tie in-store shopping to cookware upgrades, which further support the upgrade cycle for the kitchenware market[1]Penn State Extension, “Food Trends 2026,” Penn State Extension, extension.psu.edu. Retailer-led cookware promotions in 2026 signal continued premiumization momentum in key consumer markets.
Omnichannel Retail and E-Commerce Penetration in Kitchenware
Digital retail’s influence is broadening kitchenware discovery and accelerating conversion. In the United States, e-commerce reached 16.4% of total retail sales in Q3 2025, outpacing overall retail growth, which helps categories like cookware that benefit from reviews and product video content during decision making[2]U.S. Census Bureau, “Quarterly Retail E-Commerce Sales,” U.S. Census Bureau, census.gov. Large, multi-brand players are expanding digital engagement while linking online programs to circular initiatives, including cookware recycling and credit redemption schemes that encourage repeat purchases. Social selling and brand-led livestream formats are strengthening conversion in the Asia-Pacific region, helping regional leaders deepen their presence in cookware and kitchen electrics. These models are complemented by retailer loyalty programs that tie in-store shopping to premium cookware rewards, blending offline traffic with online account engagement. The kitchenware market benefits when product pages, tutorials, and flexible return policies reduce friction relative to traditional storefronts, making omnichannel strategies a structural tailwind for category growth.
Induction Adoption Driving Induction-Ready Cookware Upgrades
Induction’s efficiency advantage is material to cookware replacement cycles, with energy transfer of near 90% compared to lower rates for electric or gas ranges, which supports consumer and commercial electrification goals. Regulatory and standards work also points to continued momentum, with standard-setting bodies advancing projects for induction hobs, including portable formats that consider cookware characteristics alongside cooktop performance. This alignment helps clarify performance expectations and encourages buyers to prioritize induction-ready bases and multi-ply stainless construction that work across cooktops. Large cookware manufacturers have noted cookware growth tied to induction-compatible systems in European markets, and are extending those platforms into other regions. Several brands launched 2025 and 2026 collections that emphasize hard-anodized or multi-ply stainless steel with ceramic nonstick finishes tailored for induction compatibility[3]Meyer Corporation U.S., “Company Press Releases,” PR Newswire, prnewswire.com. Professional buyers are following similar patterns as commercial kitchens electrify, which lifts demand for durable, induction-ready pans that reduce energy use and improve control.
PFAS Regulatory Shift Accelerating PFAS-Free Materials
PFAS policy has moved from voluntary reductions to formal restrictions in food-contact applications, which is increasing urgency for alternative coatings and materials. The United States FDA stated in 2024 that PFAS grease-proofing agents for food-contact use were no longer being sold in the domestic market following a voluntary phase-out, which signaled a broader shift across food-contact materials. In Europe, PFAS concentration thresholds in packaging are being introduced within a defined schedule, which is nudging cookware brands serving both regions to standardize toward PFAS-free options and more rigorous supplier testing. Laboratory guidance documents explain concentration thresholds and testing approaches that manufacturers can use when verifying compliance and auditing supply chains. Brands have responded with 2026 launches of PFAS-free ceramic nonstick lines and new stainless-clad platforms that promise nonstick performance while aligning with compliance trends. Corporate productivity programs launched in late 2025 also cited compliance and reformulation complexity among factors for efficiency plans, which indicates PFAS policy is reshaping operations and product portfolios in the kitchenware market.
Restraints Impact Analysis*
| Restraint | (~) % Impact on CAGR Forecast | Geographic Relevance | Impact Timeline |
|---|---|---|---|
| Growing demand for eco-friendly and plastic-free alternatives | -0.3% | Global, concentrated in Western Europe, North America | Medium term (2-4 years) |
| Fragmented market and private-label price pressure | -0.5% | North America, Europe; acute in mass retail channels | Medium term (2-4 years) |
| PFAS restrictions are causing reformulation and compliance costs | -0.4% | United States(state-level priority), EU | Short term (≤ 2 years) |
| Category substitution from countertop appliances, dampening some bakeware/tools | -0.6% | North America, Western Europe, urban households | Medium term (2-4 years) |
| Source: Mordor Intelligence | |||
Fragmented Market and Private-Label Price Pressure
The kitchenware market remains competitive at the entry and mid-price tiers, where private-label assortments hold strong placement and exert steady pressure on branded price bands. Mass merchants prioritize value, which narrows the room for branded differentiation unless materials, durability, or after-sales service can justify a premium. As online reviews flatten information gaps, buyers can compare private-label to branded alternatives within minutes, which compresses the willingness to pay beyond a narrow premium. Branded players that do not invest in induction-ready materials, PFAS-free coatings, or product warranties struggle to sustain shelf position. The economics of this segment favor high-volume runs and efficient sourcing, which can be hard to balance with the investment required for new coatings or multi-ply construction. This dynamic encourages brand portfolios to push premium SKUs upward while defending select entry SKUs to maintain traffic and category relevance.
Category Substitution from Countertop Appliances
Adoption of multifunctional countertop appliances reduces the need for some types of bakeware and single-purpose pans. Households that rely on small ovens with air-fry, crisp, or steam modes often rotate fewer sheet pans and specialty tins, which can trim replacements within those sub-categories. The effect is uneven because premium enthusiasts still invest in cast iron, carbon steel, and multi-ply stainless sets that deliver high-heat control and longevity. Substitution tends to be strongest in urban dwellings with limited storage, where one compact device replaces several tools. Brands with diverse portfolios can mitigate this effect by positioning durable bakeware as complements to multifunction ovens while advancing induction-ready cookware for stovetop tasks. The kitchenware market responds best when assortments help consumers plan across appliances without redundancy.
*Our forecasts treat driver/restraint impacts as directional, not additive. The impact forecasts reflect baseline growth, mix effects, and variable interactions.
Segment Analysis
By Product Type: Bakeware Gains as At-Home Baking Embeds
Dinnerware accounted for 36.13% of 2025 sales as a high-volume, replacement-friendly category across home and hospitality settings. Bakeware is projected to post a 5.95% CAGR through 2031, supported by persistent interest in scratch cooking and batch preparation that favors reliable roasting pans, sheet pans, and Dutch ovens. Consumer trend reporting from 2026 indicates a sustained focus on home cooking and hosting, which continues to support repeat purchase behavior in cookware and bakeware. These patterns align with a steady stream of brand-led product introductions across multi-ply stainless, ceramic nonstick, and enamel cast iron sets aimed at durability and performance under everyday use. Specialty bakeware gains where consumers seek presentation-ready results for social sharing or family entertaining, which also lifts premium glazed stoneware and seasoned cast iron. The kitchenware market benefits where product detail pages and in-store demonstrations clarify performance under induction and oven use, reducing return rates and increasing basket size.
Cookware remains the revenue anchor due to its central role in daily meal preparation and its compatibility with induction, which is rising in both residential and commercial kitchens. Kitchen tools and utensils ride the “elevated everyday” theme, where functional upgrades like better spatulas, tongs, and boards improve routine cooking. Tableware and dinnerware’s growth is steady, with artisanship and premium glazes attracting audiences that value long service life. Food storage accessories win with meal prep and leftovers, particularly where vacuum systems and glass containers extend shelf life and reduce waste. The kitchenware market accommodates both premium and value tiers by using clear labeling on induction compatibility and PFAS-free coatings that speak to evolving consumer expectations. Product development now blends material science with user experience details such as welded handles and sealed edges that enhance hygiene and longevity[4]Fissler, “PHI Collection Announcement,” Fissler, fissler.com.


By Material: PFAS-Free Ceramics Surge Amid Regulatory Compliance
Stainless steel led with 55.72% share in 2025 due to its durability, ease of sanitation, and universal cooktop compatibility, including induction. Non-stick ceramic and PTFE-free coatings are forecast to grow at a 5.62% CAGR through 2031, helped by regulatory signals and consumer preferences that favor PFAS-free solutions in food-contact applications. The global kitchenware market size for PFAS-free ceramic-coated products is expected to expand in line with compliance deadlines and standards convergence, which rewards manufacturers that can certify coatings and maintain nonstick performance. Changes in the United States and EU policy guidance are shaping the timing of reformulation and scale-up, which helps align procurement for global product lines. Laboratory guidance on concentration thresholds and total fluorine testing supports supplier screening and documentation needs for global brands.
Aluminum maintains relevance in entry and mid-tier products but faces headwinds in markets that are moving quickly to induction, which tends to favor multi-ply stainless or ferromagnetic bases. Cast iron remains a durable favorite, and lighter variants have improved access for cooks who prefer heat retention without added weight. Glass, bamboo, and silicone each contribute to niche needs, including oven compatibility, tool gentleness, and cleanup convenience. Stainless steel also benefits, as some buyers trade nonstick convenience for perceived inertness and longevity. The kitchenware market reflects this trade-off dynamic, with premium sets offering multi-layer construction, welded handles, and induction-ready bases that justify higher ticket prices. Product portfolios that present clear PFAS-free claims while meeting performance standards build trust with health-conscious segments.
By End-user: Commercial Segment Outpaces as HoReCa Invests
Residential buyers represented 62.12% of sales in 2025, supported by entrenched home-cooking habits and steady entertaining. The commercial and HoReCa segment is projected to grow at a 4.56% CAGR to 2031 as hotel and restaurant refurbishments prioritize energy-efficient kitchens and durable cookware that supports high-throughput operations. Commercial procurement standards stress longevity, hygiene, and induction readiness, which lifts demand for welded-handle stainless pans and multi-ply stockpots. Product innovation in the professional channel often cascades to prosumer lines, which narrows the gap between commercial and residential options. Commercial kitchen electrification is also driving material choices toward induction-ready platforms to meet sustainability targets and lower operational costs. The kitchenware market aligns with this demand by adapting coatings and constructions that balance performance under heat with compliance and durability.
Extended-stay formats and modern hospitality concepts blur residential and commercial needs by specifying more residential-style cookware in suites, which pulls consumer-grade SKUs into institutional procurement. Leading global brands have invested in professional equipment through acquisitions and plant upgrades, which strengthens their ability to serve both pro and home use cases with shared technologies. Corporate updates in 2025 referenced business rebounds, organization streamlining, and renewed investment in innovation that directly impact cookware portfolios for both channels. As these initiatives roll out, buyers in hospitality will find a broader range of induction-ready systems and PFAS-free nonstick options that meet compliance while delivering throughput. The kitchenware industry is likely to see faster iteration cycles for pro and prosumer lines as suppliers standardize platforms across end-users.
By Distribution Channel: Online Retail Captures Share as D2C Scales
Supermarkets and hypermarkets held a 44.14% share in 2025 as the legacy high-volume channel for entry and mid-tier kitchenware. Online retail is projected to grow at a 5.94% CAGR to 2031, reflecting the advantage of rich media, transparent product specifications, and easy returns that reduce friction in high-consideration categories. In the United States, e-commerce penetration was 16.4% of retail sales in Q3 2025, with kitchenware benefiting from category-specific content and social discovery that accelerates trial and adoption. Leading brands and retailers are expanding circular initiatives like cookware recycling and loyalty credit redemption that encourage online-to-store and store-to-online behavior. This hybrid approach integrates convenience with tactile evaluation, particularly for premium cookware and knives that benefit from in-person assessment. The kitchenware market gains when online product pages use clear materials disclosures and compatibility guides that help shoppers select the right pan for gas, electric, or induction.
Specialty stores maintain relevance through curated assortments and live demonstrations that show performance in controlled conditions. Online direct-to-consumer brands compete by offering professional-grade materials, PFAS-free ceramic options, or hybrid surfaces while emphasizing transparent sourcing and strong warranties. Retailer promotions in 2026 that tie loyalty points to cookware redemption show how omnichannel levers can bring premium brands within reach, which supports mix upgrades for households. The kitchenware market continues to benefit from an omnichannel playbook that reduces returns through clear sizing, compatibility information, and care instructions.
Geography Analysis
North America held 34.11% of global revenue in 2025, supported by persistent home-cooking routines and a steady flow of premium product introductions. Energy-efficiency programs and electrification policies are encouraging induction cooktop adoption, which drives replacement demand for induction-ready cookware with ferromagnetic bases and multi-ply stainless construction. Natural Resources Canada highlights the efficiency gains of induction, which strengthens the value case for induction-compatible sets among environmentally conscious households as local codes evolve in the United States. Consumers are increasingly attentive to cookware labels that confirm induction compatibility, which benefits stainless-steel and carbon steel. The kitchenware market in North America also benefits from omnichannel habits, where online reviews and video explainers reduce time to purchase while brick-and-mortar stores support brand experience. New cookware collections launched in late 2025 and early 2026 underscore alignment with these needs, particularly hard-anodized and ceramic lines designed for induction. Together, these patterns set up steady mix upgrades during 2026.
Asia-Pacific is projected to grow at a 4.91% CAGR to 2031, with China and India anchoring demand and Southeast Asia contributing through social commerce and smartphone-led retail. Reports from global leaders point to strong growth from their China brands in 2025, aided by digital campaigns and livestream selling formats that lift cookware and small appliance categories. The region’s manufacturing scale continues to be a strength in aluminum and stainless-steel production, supporting export capacity and regional availability at competitive price points. Urban Asian markets show rising adoption of induction, particularly in Japan and South Korea, which adds to demand for induction-ready pans and multi-ply sets. The kitchenware market benefits as leading brands align product roadmaps in Asia-Pacific with PFAS-free coatings and compatibility features that transfer globally. Localized marketing, including influencer demonstrations and short-video explainers, strengthens consideration for higher-value cookware that promises durability and consistent heat control. This mix points to sustained value growth even where unit growth starts to moderate.
Europe’s kitchenware dynamics reflect high induction penetration in several markets and a policy environment that prioritizes decarbonization and materials compliance. Induction’s efficiency and control remain a core reason for consumer preference in Germany and the Nordics, while France is catching up with rising adoption supported by energy-focused incentives. PFAS-related regulatory timelines are pushing brands toward ceramic nonstick or stainless-clad constructions, which is raising the performance bar and reinforcing premium positioning. The kitchenware market in Europe is also benefiting from professional-grade technologies filtering into home assortments, including welded-handle designs and 5-ply builds. Leading European brands and groups have emphasized renewed investment in innovation, AI-led engagement, and streamlined organizations to restore growth and profitability in 2026 and beyond. Retail programs and circular initiatives, including pan recycling with credits for future purchases, demonstrate how sustainability messaging and end-of-life programs drive repeat buying. These levers support the broader kitchenware market by reducing uncertainty about materials, care, and compatibility.

Competitive Landscape
The kitchenware market exhibits moderate fragmentation. Global leaders balance multi-brand portfolios that span mass to premium while investing in product innovation and digital engagement. A top European group’s 9M 2025 results cited ongoing programs to restore growth and profitability through innovation pipelines, streamlined organizations, and stronger consumer engagement, which directly influence cookware product cadence. The same group has advanced its professional footprint through prior acquisitions, reinforcing capability in high-end cooking equipment and enabling technology transfer into prosumer lines. Newell Brands announced a global productivity plan in December 2025 that aims to deliver annualized savings, referencing efficiency and portfolio focus that can reshape its cookware and kitchen electrics businesses. Meyer Corporation has focused on product-led differentiation with 2025 and 2026 introductions across ceramic nonstick and multi-ply platforms designed for induction compatibility, which strengthens mid-premium positioning in the kitchenware market.
Premium brands are extending into adjacent spaces and using design narratives to support higher ticket prices. A notable example is Zwilling’s outdoor kitchen unit showcased at a 2026 trade event, which extends stainless steel design and water management features to premium outdoor entertaining. Fissler has emphasized form-and-function blends in recent launches, including new design-led collections and pressure-cooking updates that underscore health and speed while maintaining stainless-steel build quality. Retail promotions by grocers and mass merchants have also supported premiumization by allowing shoppers to redeem loyalty credits for high-end cookware brands. These promotions serve as on-ramps to premium lines and broaden awareness of professional-grade design traits in mainstream households, which supports mix upgrades for the kitchenware market.
Competitive strategies highlight three consistent themes. First, induction compatibility is table stakes across price tiers, which favors multi-ply stainless, ferromagnetic bases, and welded construction. Second, PFAS-free coatings are advancing with ceramic-based systems that promise durability and scratch resistance, anchored by 2026 product launches that prioritize compliance and performance claims. Third, omnichannel presence with strong content and easy returns sustains conversion and loyalty, especially for sets that require more consideration. Corporate updates in 2025 signaled higher investment in innovation and digital engagement to restore growth, which should lift the cadence of material advances and user-centric features in 2026. These efforts align with the kitchenware market’s shift toward compliance-ready, induction-capable, and digitally merchandised assortments.
Kitchenware Industry Leaders
Groupe SEB
Tupperware Brands
Arc International (Arc Group)
ZWILLING J.A. Henckels (Werhahn KG)
Lifetime Brands
- *Disclaimer: Major Players sorted in no particular order

Recent Industry Developments
- February 2026: Le Creuset commenced operations at its new 300,000-square-foot distribution facility in Early Branch, South Carolina, following a USD 30 million investment. The facility is designed for operational efficiency and employee wellness, with provisions for future expansion and solar panel installations.
- February 2026: ZWILLING Flammkraft unveiled the Model L Companion Unit at KBIS 2026, featuring an isolated stainless steel double sink with extendable/swivelable/retractable faucet and dual-circuit connection for hot or cold water. The unit integrates with the Model D grill and Model M cart to create a complete outdoor kitchen without custom construction.
- January 2026: Meyer Corporation introduced the KitchenAid Stonewash Stainless Steel 5-Ply Clad Cookware collection in partnership with KitchenAid, targeting premium residential users seeking induction-compatible, durable cookware.
- January 2026: Meyer Corporation launched the Circulon Halo with LaserDefense Ceramic Nonstick, a PFAS-free ceramic nonstick cookware line designed to address regulatory compliance and health-conscious consumer demand.


Global Kitchenware Market Report Scope
Kitchenware refers to items that aid in the preparation and serving of food. As these items are essential for the preparation of food, they are very useful to have. A complete background analysis of the kitchenware market is covered in the report, which includes an assessment of the national accounts, the economy, emerging market trends by segments, significant changes in the market dynamics, and a market overview includes an assessment of the national accounts, the economy, emerging market trends by segments, significant changes in the market dynamics, and a market overview.
The kitchenware market is segmented by product type, material, end-user, distribution channel, and geography. By product type, the market is sub-segmented into cookware, bakeware, tableware, tools, and storage. By material, the market is sub-segmented into stainless steel, aluminum, cast iron, ceramic, and other materials. By end-user, the market is sub-segmented into residential and commercial. By distribution channel, the market is sub-segmented into supermarkets, specialty stores, online, and other distribution channels. By geography, the market is sub-segmented into North America, South America, Asia-Pacific, Europe, and Middle East, and Africa. The report offers market size and forecasts for the kitchenware market in value (USD Billion) for all the above segments.
| Cookware |
| Bakeware |
| Tableware & Dinnerware |
| Kitchen Tools & Utensils |
| Food Storage & Accessories |
| Stainless Steel |
| Aluminum |
| Cast Iron |
| Non-stick Ceramic & PTFE-free |
| Others (Glass, Bamboo, Silicone) |
| Residential |
| Commercial / HoReCa |
| Supermarkets / Hypermarkets |
| Specialty Stores |
| Online Retail |
| Others (Direct Sales, Department Stores) |
| North America | Canada |
| United States | |
| Mexico | |
| South America | Brazil |
| Peru | |
| Chile | |
| Argentina | |
| Rest of South America | |
| Asia-Pacific | India |
| China | |
| Japan | |
| Australia | |
| South Korea | |
| South East Asia (Singapore, Malaysia, Thailand, Indonesia, Vietnam, Philippines) | |
| Rest of Asia-Pacific | |
| Europe | United Kingdom |
| Germany | |
| France | |
| Spain | |
| Italy | |
| BENELUX (Belgium, Netherlands, Luxembourg) | |
| NORDICS (Denmark, Finland, Iceland, Norway, Sweden) | |
| Rest of Europe | |
| Middle East and Africa | United Arab Emirates |
| Saudi Arabia | |
| South Africa | |
| Nigeria | |
| Rest of Middle East and Africa |
| By Product Type | Cookware | |
| Bakeware | ||
| Tableware & Dinnerware | ||
| Kitchen Tools & Utensils | ||
| Food Storage & Accessories | ||
| By Material | Stainless Steel | |
| Aluminum | ||
| Cast Iron | ||
| Non-stick Ceramic & PTFE-free | ||
| Others (Glass, Bamboo, Silicone) | ||
| By End-user | Residential | |
| Commercial / HoReCa | ||
| By Distribution Channel | Supermarkets / Hypermarkets | |
| Specialty Stores | ||
| Online Retail | ||
| Others (Direct Sales, Department Stores) | ||
| By Region | North America | Canada |
| United States | ||
| Mexico | ||
| South America | Brazil | |
| Peru | ||
| Chile | ||
| Argentina | ||
| Rest of South America | ||
| Asia-Pacific | India | |
| China | ||
| Japan | ||
| Australia | ||
| South Korea | ||
| South East Asia (Singapore, Malaysia, Thailand, Indonesia, Vietnam, Philippines) | ||
| Rest of Asia-Pacific | ||
| Europe | United Kingdom | |
| Germany | ||
| France | ||
| Spain | ||
| Italy | ||
| BENELUX (Belgium, Netherlands, Luxembourg) | ||
| NORDICS (Denmark, Finland, Iceland, Norway, Sweden) | ||
| Rest of Europe | ||
| Middle East and Africa | United Arab Emirates | |
| Saudi Arabia | ||
| South Africa | ||
| Nigeria | ||
| Rest of Middle East and Africa | ||


Key Questions Answered in the Report
What is the kitchenware market growth outlook through 2031?
The kitchenware market size is expected to reach USD 96.14 billion by 2031, reflecting a 4.11% CAGR over 2026-2031 as PFAS-free materials, induction compatibility, and omnichannel retail drive steady demand.
Which materials are set to gain the most in kitchenware?
Stainless steel remains the leader by share, while PFAS-free ceramic coatings are projected to grow fastest due to compliance pressure and consumer health preferences, reinforced by 2026 product launches across major brands.
How will induction adoption influence cookware purchasing?
Induction’s near-90% energy transfer and evolving standards are accelerating replacement toward induction-compatible bases and multi-ply stainless, affecting both residential and professional kitchens and lifting associated cookware upgrades.
Which channels are shaping kitchenware purchases in 2026?
Supermarkets and hypermarkets still hold the largest share, but online retail is growing faster as rich product content, transparent specifications, and easy returns reduce purchase friction in cookware and bakeware.
What are the main regulatory forces impacting kitchenware?
PFAS policies in food-contact applications are pushing reformulation toward PFAS-free ceramic systems and stainless-clad platforms, supported by FDA guidance in the United States, and tightening European thresholds for related materials.
Which regions will contribute most to kitchenware demand growth?
Asia-Pacific is projected to post the fastest growth through 2031 due to digital retail models and manufacturing scale, while North America and Europe support premiumization aligned with induction and compliance trends, sustaining value growth for the kitchenware market.
Page last updated on:


