
Market Overview
| Study Period | 2020 - 2031 |
|---|---|
| Forecast Data Period | 2026 - 2031 |
| Historical Data Period | 2020 - 2024 |
| Market Size (2026) | USD 26.76 Billion |
| Market Size (2031) | USD 35.16 Billion |
| Growth Rate (2026 - 2031) | 5.61 % |
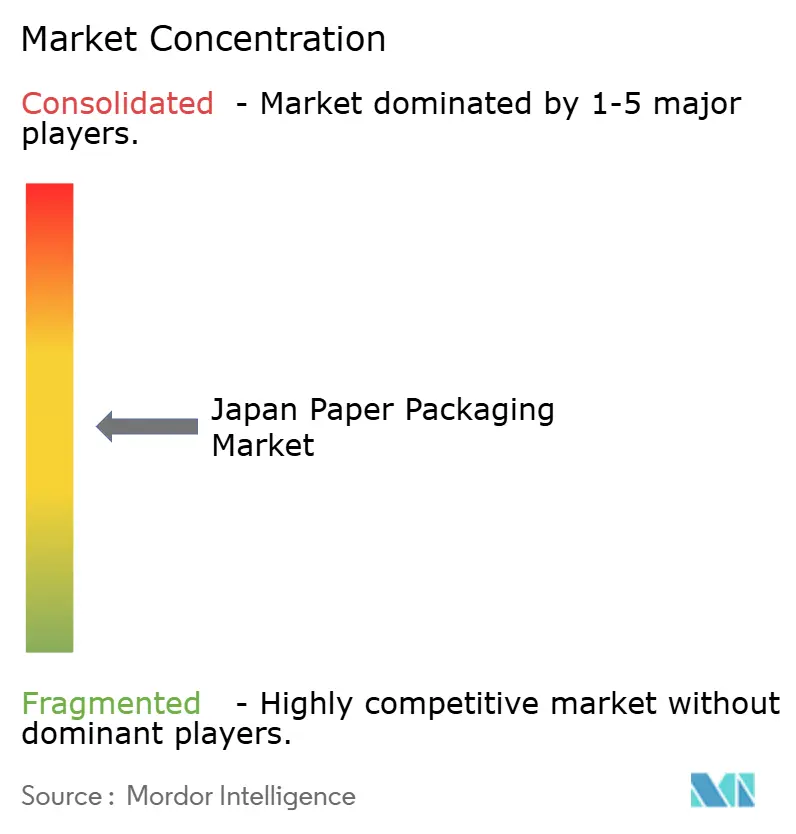
| Market Concentration | Medium |
Major Players *Disclaimer: Major Players sorted in no particular order Image © Mordor Intelligence. Reuse requires attribution under CC BY 4.0. | |
Japan Paper Packaging Market Analysis by Mordor Intelligence
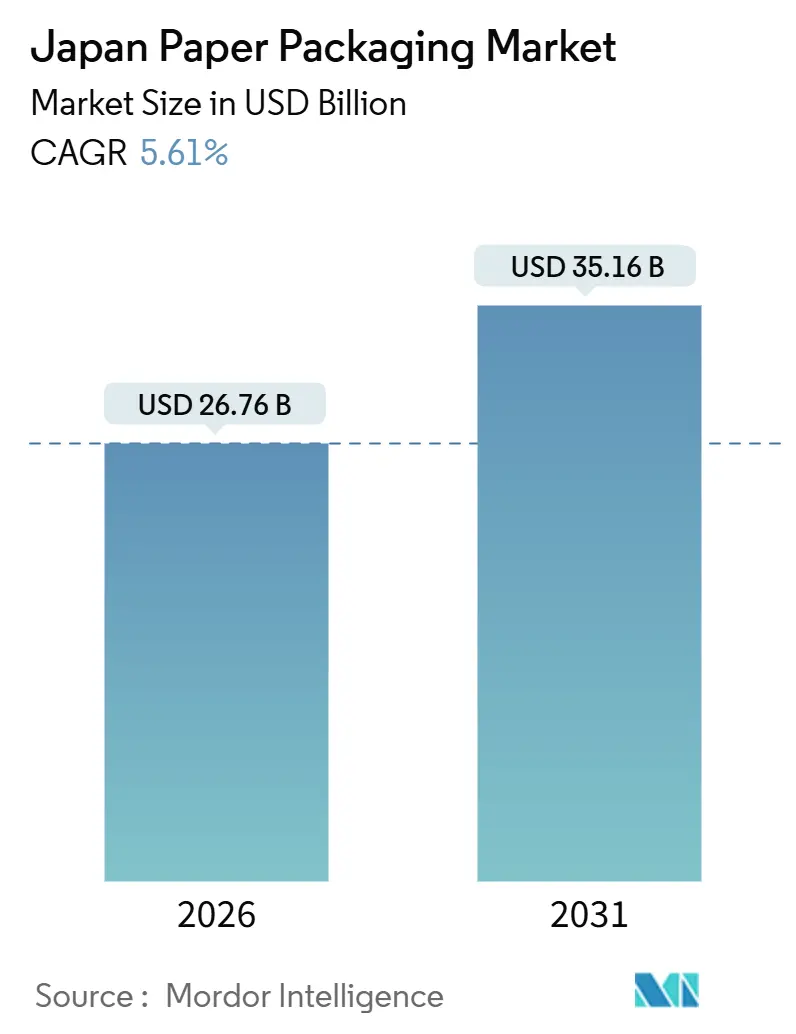
Japan paper packaging market size stands at USD 26.76 billion in 2026 and is projected to reach USD 35.16 billion by 2031, reflecting a 5.61% CAGR. The growth of the Japan paper packaging market aligns with the country’s transition from petroleum-based substrates following the implementation of the Plastic Resource Circulation Act, and with brand owners’ preference for barrier-coated paper that now achieves oxygen-transmission rates below 0.5 cc m-2 day-1 atm. E-commerce demand strengthens the Japan paper packaging market as consumer parcel volume rises in line with a 5.1% year-on-year increase in fiscal-2024 online retail sales. Recovered-paper infrastructure, which posts national recovery rates above 80%, underpins the supply of recycled paperboard, while specialty grades capture premium niches because of their mono-material design advantage. Investments by Oji Holdings, Nippon Paper Industries, and The Pack Corporation in barrier-paper R&D, high-speed converting, and recycling facilities illustrate defensive and offensive competitive strategies amid rising raw-material costs and labor constraints. Overall, the Japanese paper packaging market is experiencing multi-year tailwinds from regulations, technology, and shifting consumer behavior.
Key Report Takeaways
- By material type, recycled paperboard held 45.34% of Japan paper packaging market share in 2025, while specialty paper recorded the fastest forecast CAGR at 6.32% through 2031.
- By product type, rigid formats commanded a 55.32% revenue share in 2025, whereas flexible paper packaging is expected to expand at a 6.64% CAGR through 2031.
- By packaging format, secondary packaging accounted for 47.42% of the Japan paper packaging market size in 2025, and primary packaging is projected to grow at a 7.01% annual rate to 2031.
- By end-use industry, the food sector captured 29.32% of the revenue share in 2025 and is forecast to advance at a 7.18% CAGR through 2031.
Note: Market size and forecast figures in this report are generated using Mordor Intelligence’s proprietary estimation framework, updated with the latest available data and insights as of January 2026.
Japan Paper Packaging Market Trends and Insights
Drivers Impact Analysis*
| Driver | (~) % Impact on CAGR Forecast | Geographic Relevance | Impact Timeline |
|---|---|---|---|
| Increasing Demand from the Food and Beverage Sector | +1.2% | National, Tokyo, Osaka, Nagoya | Medium term (2-4 years) |
| Regulations on Plastic-based Packaging | +1.5% | National | Short term (≤ 2 years) |
| Expansion of E-commerce Fulfillment Packaging | +1.3% | National, urban prefectures | Medium term (2-4 years) |
| Premiumization of Convenience Foods | +0.8% | National, Tokyo, Kansai | Long term (≥ 4 years) |
| Emergence of Smart Paper Packaging (NFC, QR) | +0.4% | National, pilot cities | Long term (≥ 4 years) |
| Corporate Net-Zero Procurement Commitments | +0.9% | National | Medium term (2-4 years) |
| Source: Mordor Intelligence | |||
Regulations On Plastic-Based Packaging
Japan’s Plastic Resource Circulation Act became effective in April 2022. It obliges municipalities to expand the collection of sorted plastic items and requires businesses that distribute single-use plastic products to adopt reduction or substitution measures. The Ministry of the Environment's design guidelines favor low-plastic or plastic-free designs, and certified products receive preferential treatment in government procurement. These rules raise compliance costs for plastic substrates while exempting most paper equivalents from the positive-list restrictions that govern food-contact plastics.[1]Ministry of Health, Labour and Welfare, “Utensils, Containers, and Packaging,” mhlw.go.jp As a result, supermarkets and convenience stores are switching to barrier-coated paper for cutlery, straws, and trays, thereby accelerating demand in the Japanese paper packaging market.
Expansion Of E-Commerce Fulfillment Packaging
Business-to-consumer e-commerce reached JPY 26.1 trillion (USD 180 billion) in fiscal 2024 and lifted Japan’s e-commerce ratio to 9.8%. Japan Post Holdings plans Yu-Packet revenue of JPY 160 billion (USD 1.1 billion) by fiscal 2025 and is investing JPY 270 billion (USD 1.9 billion) in small-parcel sorters and robotic arms. These automated hubs require corrugated and paper mailers that feed smoothly through high-speed sorters without crushing. Demand is strongest in high-penetration categories, such as books, electronics, and household goods, which bolsters volumes in the Japanese paper packaging market and pressures converters to deliver precise dimensions, barcode-friendly surfaces, and stack strength.
Increasing Demand From The Food And Beverage Sector
Food, drinks, and liquor online sales increased 6.36% year-over-year to JPY 3.116 trillion (USD 21.5 billion) in fiscal 2024, yet penetration remains at just 4.52%, indicating substantial headroom. Meiji Group already sourced 100% eco-friendly paper for 22,073 tonnes of packaging in fiscal 2024. Growth in takeout and meal kits reinforces demand for grease-resistant kraft, moisture-barrier folding cartons, and microwavable sleeves that preserve food quality in chilled and ambient supply chains. These requirements align with premiumization trends that reward tactile finishes and windowed designs, expanding value capture within the Japan paper packaging market.
Premiumization Of Convenience Foods
Consumers in urban centers seek high-quality, ready-to-eat meals that strike a balance between indulgence and sustainability. Beverage leader Suntory’s “2R+B” framework prioritizes material reduction and recycling, while Asahi aims to achieve full conversion to recycled or bio-based packaging by 2030.[2] Suntory Group, “Containers and Packaging,” suntory.com These policies create long-term offtake for specialty barrier papers that deliver shelf appeal, brand differentiation, and food safety, lifting the overall revenue mix toward higher-margin grades.
Restraints Impact Analysis*
| Restraint | (~) % Impact on CAGR Forecast | Geographic Relevance | Impact Timeline |
|---|---|---|---|
| Rising Raw Material Costs | -0.9% | National, exposed to global pulp markets | Short term (≤ 2 years) |
| Shrinking Graphic Paper Mills Capacity Allocation | -0.6% | Hokkaido, Tohoku, Shikoku | Medium term (2-4 years) |
| Aged Logistics Infrastructure Creating Bottlenecks | -0.4% | Rural prefectures | Long term (≥ 4 years) |
| Skilled Labor Shortages in Paper Converting Plants | -0.5% | Kanto and Kansai zones | Medium term (2-4 years) |
| Source: Mordor Intelligence | |||
Rising Raw Material Costs
Oji Holdings forecasts long-fiber kraft pulp to rise from USD 570 per tonne in fiscal 2025 to USD 610 by fiscal 2027, squeezing converters that serve price-sensitive corrugated customers.[3]Oji Holdings Corporation, “Medium-Term Management Plan 2027,” ojiholdings.co.jp Although Japan’s recovered-paper rate exceeds 80%, the pool of high-grade waste is diminishing due to falling newspaper volumes, and exports to ASEAN buyers add volatility. Converters therefore shift toward specialty papers where unique coatings justify pass-through pricing, but commodity segments of the Japan paper packaging market face margin compression.
Shrinking Graphic Paper Mills’ Capacity Allocation
Graphic paper demand fell 33% over five years, prompting mill closures and re-tooling. Nippon Paper plans to limit graphic production to three mills and redeploy assets toward packaging. However, converting glossy-paper coaters to food-contact barrier roles requires the development of new drying and quality-control systems. The capital burden delays supply expansion for high-barrier substrates, creating short-term tightness in specialty grades within the Japan paper packaging market.
*Our forecasts treat driver/restraint impacts as directional, not additive. The impact forecasts reflect baseline growth, mix effects, and variable interactions.
Segment Analysis
By Material Type: Recycled Paperboard Anchors Supply While Specialty Paper Fuels Growth
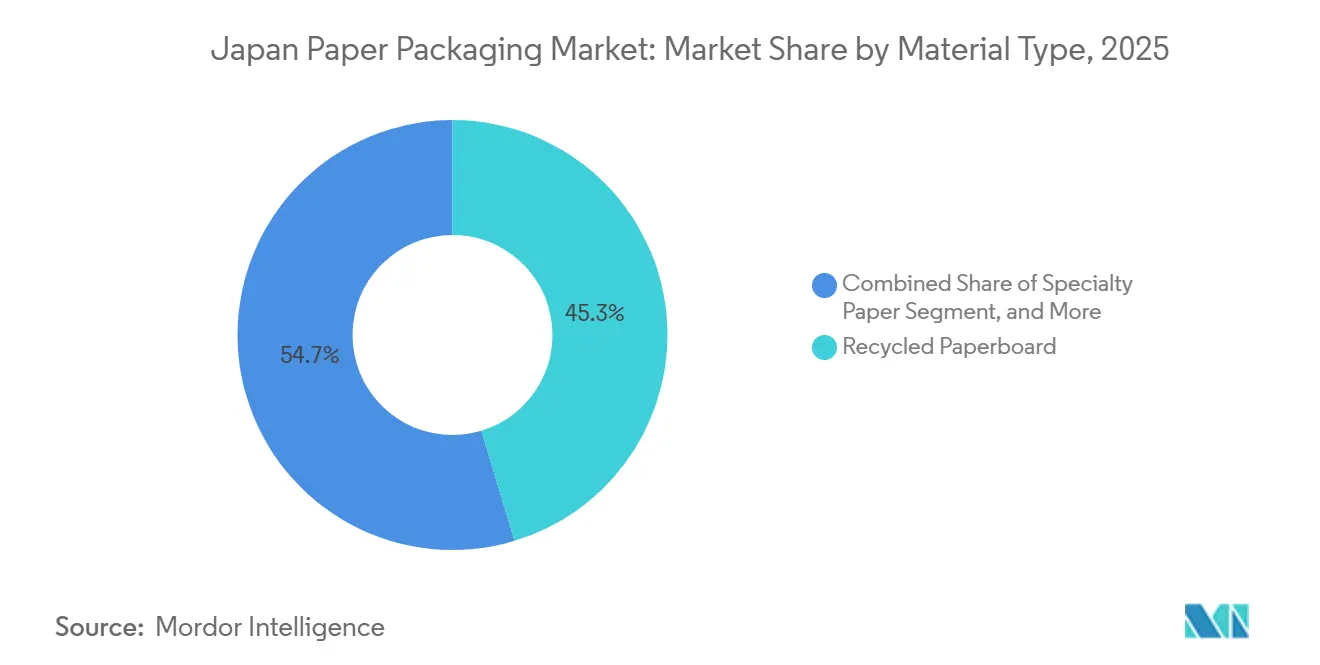
Recycled paperboard held 45.34% of the Japan paper packaging market share in 2025, underpinned by municipal collection efficiencies and brand commitments to post-consumer content. Specialty grades are forecast to rise by 6.32% annually through 2031. The Japan paper packaging market size for specialty paper is growing as barrier-coated substrates, such as Toppan’s GL-X-P, reduce carbon emissions by up to 35% compared to laminated films. Nippon Paper’s SHIELDPLUS achieves near-film oxygen and water vapor resistance without the use of aluminum or PVDC, thereby protecting dry foods and confectionery. Virgin board retains a foothold in pharma and cosmetics, where contamination risk drives preference for traceable fiber. Molded pulp, while small, appeals to electronics firms looking to replace expanded polystyrene. Supply limitations and long mold-cycle times temper its contribution to Japan paper packaging market growth.
Japan paper packaging market size expansion is also linked to virgin board as the Ministry of Health, Labour and Welfare’s positive list tightens allowable substances in food-contact materials. High-purity kraft papers are engineered with fluorine-free grease resistance for quick-service restaurant wraps, and Tokushu Tokai Paper targets a capacity of 7,000-8,000 tonnes per year for these grades. Recycled streams, although voluminous, face contamination challenges that restrict direct contact uses, channeling demand into secondary and transit packaging.



By Product Type: Flexible Paper Formats Capture Share
Rigid formats led revenue with 55.32% share in 2025, yet flexible paper is projected to grow 6.64% per year to 2031 as mono-material pouches and wraps displace plastic laminates. DNP’s high-barrier sheet maintains oxygen transmission below 0.5 cc m-2 day-1 atm and achieves 85% repulpability, enabling coffee and confectionery brands to meet Europe’s recyclability mandates. Folding cartons benefit from premiumization, with embossing and multi-panel structures lifting value per unit. Corrugated boxes face commoditization, but large-format and reinforced versions earn premiums for industrial exports. The Japan paper packaging market size for flexible formats gains as heat-sealable coatings improve machineability and sealing speed, positioning paper for dry-mix, spice, and snack pouches that were once film-centric.
Automation within converting halls accelerates the uptake of flexible formats because servo-driven pouch makers and laser scoring lines reduce changeover time from 90 minutes to under 20, enabling economical short runs for seasonal flavors and limited-edition SKUs. As more beverage powders, spices, and confectionery products rotate through quarterly promotions, converters justify capital expenditures on retrofit kits that handle thinner kraft and maintain seal integrity at 300 packs per minute, thereby widening the performance gap between paper-based pouches and legacy plastic laminates.
By Packaging Format: Primary Packaging Accelerates
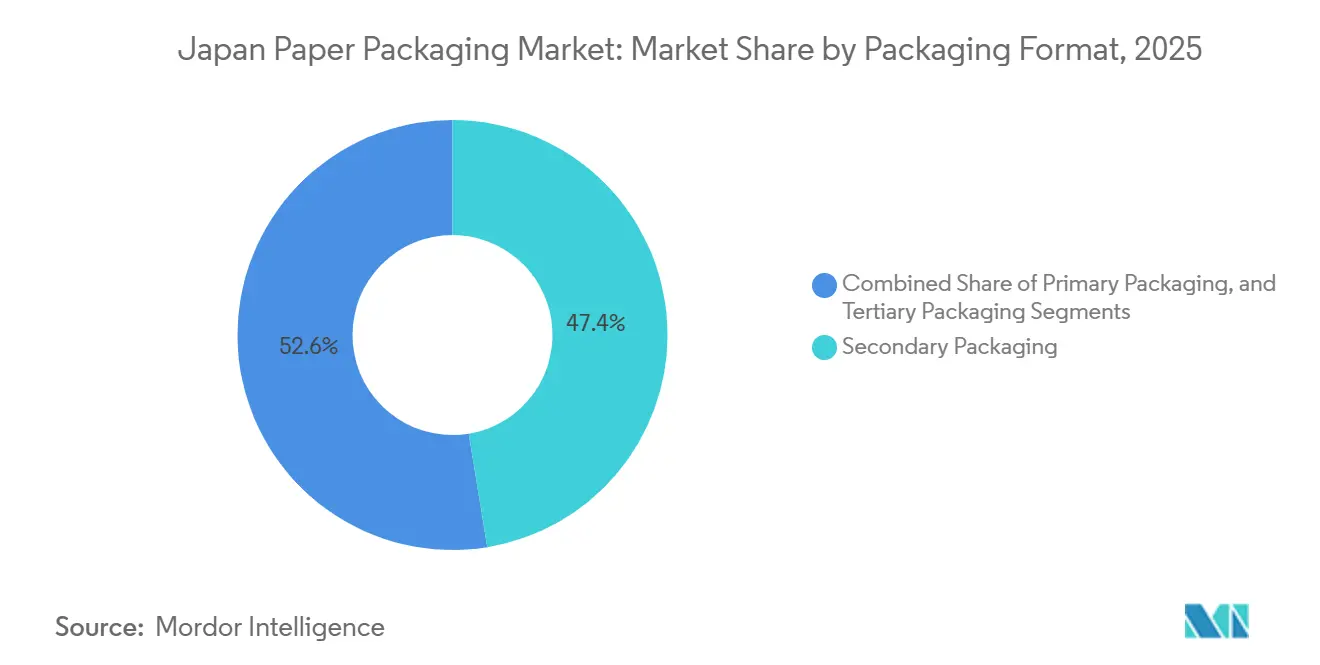
Secondary packaging accounted for 47.42% of 2025 revenue; however, primary packaging is expected to grow at a 7.01% CAGR. Barrier innovations enable paper to safely contact food, beverages, and pharmaceuticals. Oji Holdings and Nihon Tetra Pak launched a domestic recycling loop that converts aseptic cartons into corrugated board, tackling a 3.4% recovery baseline. The Japanese paper packaging market size increases as certified primary formats comply with restrictions on single-use plastics. Secondary packaging remains essential for retail-ready displays, but gains less incremental share. Tertiary and transit packaging grow in line with trade volumes, yet face substitution by reusable plastic pallets in automated warehouses.
Aseptic carton recycling alliances are now piloting blockchain-based bale tracking, which certifies fiber provenance and polymer separation efficiency, providing beverage brands with auditable proof of closed-loop recovery. Early data from the Fuji Mill scheme indicate carton-to-carton yield improvements of 12%, which encourages dairies and juice bottlers to replace multilayer pouches with gable-top or portion-pack board, thereby further expanding the primary share of the Japanese paper packaging market.
By End-Use Industry: Food Dominates Future Growth
The food sector accounted for 29.32% of the revenue and led growth with a 7.18% CAGR. Online grocery penetration remains below 5%, leaving room for corrugated shippers and barrier pouches that handle chilled logistics. Beverage brands are adopting liquid packaging board to meet their bottle-to-bottle recycled targets, thereby stimulating demand for virgin poly-coated board that enters dedicated recycling streams. The cosmetics and personal-care segments are increasing their usage of FSC-certified cartons and molded pulp trays to convey clean-beauty values. Industrial users are shifting to anti-static, moisture-balanced corrugated materials for electronics exports, supporting niche growth in molded pulp.
Electronics assemblers and appliance makers shift from expanded polystyrene to sculptured molded pulp that nests precision parts and dissipates static without chemical additives, dovetailing with retailer mandates for plastic-free shelf displays. This crossover into non-food applications reinforces the perception that paper solutions can satisfy stringent performance specs across diverse categories, thereby insulating total Japan paper packaging market demand from cyclical swings in any single vertical.
Geography Analysis
Production clusters around Hokkaido, Tohoku, Kanto, Kansai, and Shikoku, where pulp mills integrate with converting plants and recovered-paper depots. Kanto, anchored by Tokyo, consumes the largest share due to its high population density and the presence of the headquarters of food, beverage, and e-commerce giants. Kansai serves western distribution; Hokkaido and Tohoku leverage forestry resources and lower land costs. Rural prefectures struggle with aging roads and driver shortages, which increase freight costs.
Japan Post’s JPY 270 billion (USD 1.9 billion) automation program aims to address these bottlenecks with robotic sorters and electric vehicle fleets. Overseas, Japanese producers are expanding capacity in Southeast Asia and India to offset domestic maturity and capture regional e-commerce opportunities, yet they remain exposed to currency swings and the emergence of new Chinese mills. Municipal variation in recycling standards influences the quality of recovered paper, affecting mills’ fiber blends and cost structures across the Japanese paper packaging market.
The export orientation of Japanese mills influences fiber flows because overseas subsidiaries in Australia, Southeast Asia, and India absorb surplus virgin pulp and containerboard, smoothing domestic price spikes when local demand dips. Oji Holdings’ India and Southeast Asia corrugating clusters, for instance, backhaul base-paper rolls from Hokkaido mills during peak capacity, then redirect finished cartons to Japanese consumer-electronics assemblers operating in Vietnam and Thailand, creating a bidirectional logistics loop that cushions currency volatility and inventory risk.
Regulatory Landscape
Japan’s paper packaging demand is shaped by two parallel policy tracks, plastic-reduction rules and packaging identification and recycling obligations. The Plastic Resource Circulation Act (effective April 2022) pushes businesses distributing specified single-use plastic products toward reduction or substitution measures. Government design guidance and procurement preferences favor low-plastic designs, which improves the compliance position of paper-based alternatives for applications such as cutlery, straws, and trays.
Japan’s resource-efficiency framework also requires sorted-collection identification marking for specified products under the Act on the Promotion of Effective Utilization of Resources (Act No. 48 of 1991), affecting how paper packaging is labeled and designed for collection. Voluntary environmental labeling provides a commercial compliance anchor as well. Eco Mark Product Category No. 113 (Packaging Paper) criteria were revised effective April 1, 2025, expanding pathways to certification for paper products using forest-certified pulp or pulp derived from thinning, which aligns procurement and brand claims with traceable fiber sourcing.
Competitive Landscape
The market is moderately fragmented, with the presence of players such as Graphic Packaging, International Paper Company, and others which play vital roles in mitigating the decline in demand for plastic packaging and leveraging customers' preference for paper-based packaging. To capture the market share, vendors are strategizing their business models by enhancing their product lines and engaging in collaborations and acquisitions, with a core focus on sustainability.
Diversified printers Toppan and Dai Nippon Printing translate deep coating science into proprietary barrier papers, licensing oxygen-scavenging chemistries and NFC-embedded substrates that integrate traceability features demanded by pharmaceuticals and premium cosmetics. Their high R&D intensity grants an early-mover advantage, yet also raises capital-return hurdles unless rapid volume adoption offsets development outlays.
Mid-tier specialists, such as The Pack Corporation, Rengo’s converting affiliates, and regional carton makers, form cooperative purchasing pools for pulp and chemicals to counterbalance the scale economies enjoyed by the three majors. By aggregating orders for FSC-certified liner and water-based barrier coatings, these alliances secure price breaks and ensure continuity of supply during pulp spikes, preserving competitiveness in small-lot, quick-turnaround jobs that dominate food-service and e-commerce insert orders.
Japan Paper Packaging Industry Leaders
Graphic Packaging International Corporation
International Paper Company
Rengo Co., Ltd.
Oji Paper Co., Ltd.
Metsa Group
- *Disclaimer: Major Players sorted in no particular order

Market Opportunities and Future Outlook
The main opportunity centers on scaling paper solutions that meet both performance and circularity requirements in food, beverage, and e-commerce, where barrier-coated and mono-material paper formats compete directly with plastic laminates. Brand programs and conversion data already indicate this direction: Meiji Group reported sourcing 100% eco-friendly paper for 22,073 tonnes of packaging in fiscal 2024, and B2C e-commerce reached JPY 26.1 trillion in fiscal 2024. That combination raises expectations for corrugated and paper mailers engineered for automated sortation, including dimensional accuracy, stack strength, and scannable surfaces.
This supports whitespace for converters and material suppliers that can pair high-barrier papers (low oxygen transmission) with repulpability, facilitating primary packaging migration beyond traditional secondary formats. Upstream, decarbonization and fiber-traceability initiatives are reinforcing investment cases for recycled content, certified fiber, and process efficiency within domestic supply chains. The Japan Paper Association’s environmental action disclosures (FY2024 energy-derived CO2 emissions at 13.4 million tons, with 75.8% progress toward its FY2030 reduction target versus FY2013) and its managed plantation footprint (539,000 hectares as of end-2023 across domestic and overseas projects) align with customer procurement requirements that increasingly specify verified fiber origin and lower-carbon manufacturing. On the policy side, METI’s 2026 circular economy initiatives emphasize resource autonomy and JIS-oriented approaches for environmental compatibility, supporting product development and qualification work for recyclable, clearly labeled paper packaging designs that can operate within Japan’s collection and recycling system.
Recent Industry Developments
- April 2026: Rengo Co., Ltd. established the RS Wood Refinery as part of its sustainable resource development efforts. The initiative supports feedstock and material-innovation capabilities for fiber-based packaging and reinforces alignment with circular economy and responsible sourcing priorities.
- October 2025: Rengo Co., Ltd. implemented price increases of 10 yen/kg or more for containerboard, tube board, and chipboard, alongside corresponding increases for corrugated and folding carton products. The action formalized inflation pass-through across key paper packaging inputs, shaping converter pricing strategies and contract structures with end users.
- December 2024: Meiji Group reportedly sourced 100% eco-friendly paper for 22,073 tonnes of packaging in fiscal 2024. The disclosure points to rising demand for recyclable, high-barrier paper formats and supports procurement sustainability targets.


Research Methodology Framework and Report Scope
Market Definition and Coverage
For this study, the Japan paper packaging market is defined as revenue generated from paper-based packaging used to pack, protect, and transport goods in Japan, across common formats used in consumer and industrial supply chains.
Scope exclusions: Plastic, metal, and glass packaging are excluded, and printing-only paper products that do not function as packaging are not counted.
Segmentation Overview
- By Material Type
- Virgin Paperboard
- Recycled Paperboard
- Kraft Paper
- Specialty Paper
- Molded Pulp
- By Product Type
- Flexible Paper Packaging
- Pouches and Bags
- Wraps and Films
- Other Flexible Paper Packaging
- Rigid Paper Packaging
- Folding Carton
- Corrugated Boxes
- Other Rigid Paper Packaging
- Flexible Paper Packaging
- By Packaging Format
- Primary Packaging
- Secondary Packaging
- Tertiary / Transit Packaging
- By End-Use Industry
- Food
- Beverage
- Healthcare and Pharmaceuticals
- Personal Care and Cosmetics
- Industrial
- Other End-Use Industries
Data Sources, Market Sizing, and Validation
Desk Research
Desk work started with mapping what is actually consumed in Japan as paper-based packaging, and then tying it back to measurable indicators. We relied on public datasets and references such as Japan government statistics (for manufacturing and shipments), Japan Customs trade releases, UN Comtrade trade tables via WITS, and association publications connected to paper, board, and packaging, which helped set the direction of volumes and mix.
To keep assumptions realistic, we also reviewed company annual reports, investor decks, and press releases for capacity additions, plant utilization commentary, and pricing updates, followed by reputed business news for event tracking. In a few cases, paid subscriptions were used only to speed up company financial screening and to cross-check patent activity around barrier coatings and recyclable structures. These desk sources are illustrative only, and many more references were used to collect data points, validate patterns, and clarify open questions.
Primary Interviews and Surveys
Primary work was used to pressure-test the desk assumptions on demand, pricing, and product substitution, since paper packaging in Japan is sensitive to end-use needs and compliance choices. We spoke with converters, paper and board producers, distributors, and large end users in food, beverage, healthcare, personal care, and industrial goods, and then reconciled differences in what each group sees in ordering cycles and specifications.
Distribution of primary research fieldwork respondents
| Company type | Respondent position |
|---|---|
| Top tier: 35% | CXOs: 14% |
| Mid tier: 44% | Functional/Unit leaders: 38% |
| Smaller Players: 21% | Managers: 48% |
Market-Sizing & Forecasting
Sizing was built first from a top-down demand pool, where paper and board packaging usage is reconstructed using Japan packaging output signals and trade flows, and then filtered by where paper formats are typically specified. Once that view was formed, it was corroborated with selective bottom-up checks, including sampled converter revenue ranges, typical shipment volumes by format, and average price bands to make sure totals stayed realistic.
Key model inputs included recovered paper collection intensity (which affects recycled grades availability), e-commerce parcel activity that pushes corrugated and transit packaging, food and beverage packing volumes that drive primary packs, and the shift toward barrier-coated paper where plastic replacement is attempted. Material mix assumptions (virgin, recycled, kraft, specialty, molded pulp) were updated with interview feedback, and gaps in any single product line were handled by using proxy ratios from adjacent formats with similar end-use demand.
Forecasting used scenario analysis supported by variable-level views gathered from interviews, since future demand depends on policy enforcement, substitution speed, and price pass-through. For short-cycle indicators, smoothing was applied to avoid overreacting to one-off spikes in shipments or import volumes, and then assumptions were reviewed for internal consistency before finalizing the curve.
Data Validation & Update Cycle
Outputs were checked against independent signals, such as reported packaging shipments, directional paper and board production trends, and trade-based unit values, and then any variance beyond a reasonable band was investigated. When a mismatch was found, the drivers were re-tested, followed by a second round of calls where needed to confirm whether the change came from demand, mix, or pricing.
Before sign-off, the model and narrative go through multi-step analyst review so calculation logic and scope boundaries match what the market participants described. Reports are refreshed annually, and interim updates are made when a material event occurs, such as a large capacity move, a pricing shock, or a regulation change. Right before delivery, a final pass is completed so clients receive the latest updated view.
Mordor Intelligence's Japan Paper Packaging Market Estimate Compared With Other Published Estimates
Published market sizes for Japan paper packaging do not always match because the scope lines are drawn differently and the pricing logic is not consistent from one publisher to another. Differences also come from base year choices, how recycled content is treated, and whether the model is anchored to packaging demand indicators or to broader paper and board revenue pools.
By tracking packaging-format level demand signals and refreshing key price and mix assumptions with channel feedback, Mordor Intelligence keeps the estimate tied to paper packaging revenue only, instead of blending in adjacent paperboard or wider packaging totals that inflate the number.
Benchmark comparison
| Source | Market Size | Gaps in Research Methodology |
|---|---|---|
| Mordor Intelligence | USD 26.76 B (2026) | |
| Global Consultancy A | USD 16.99 B (2025) | Uses a narrower grade lens (virgin vs recycled) and a different base year, which can leave out specialty and molded pulp packaging revenue that still sells into Japan end uses. |
| Industry Publisher B | USD 19.90 B (2025) | Reported scope is organized around a few packaging types, and the estimate can shift depending on whether transit packaging and secondary packs are fully counted and how currency timing is converted. |
The spread is mainly explained by what gets counted as paper packaging, the base year used, and whether the model follows packaging formats through end uses or stays at a higher material grade level. With clear inclusions, repeatable inputs, and cross-checks against demand and pricing signals, the resulting market size stays traceable and practical for planning.


Key Questions Answered in the Report
How large is the Japan paper packaging market in 2026 and how fast will it grow?
The market reaches USD 26.76 billion in 2026 and is forecast to expand at a 5.61% CAGR to 2031.
What is driving Japanese demand for paper packaging in food applications?
Expansion of takeout and meal-kit channels plus single-use plastic restrictions raise demand for grease-resistant, barrier-coated paper that maintains shelf life.
Which paper material segment is growing fastest?
Specialty paper, including high-barrier and functional grades, is projected to grow at a 6.32% CAGR through 2031.
How are regulations influencing material choice?
The Plastic Resource Circulation Act imposes strict collection and reduction duties on plastics, giving paper formats a compliance and cost advantage.
Which companies lead Japan’s paper packaging supply?
Oji Holdings, Rengo, and Nippon Paper Industries dominate containerboard and corrugated, while Toppan, DNP, and The Pack Corporation hold niches in specialty grades and converting.
What role does e-commerce play in demand?
Parcel volume growth linked to a JPY 26.1 trillion online retail market drives corrugated and mailer demand that meets automated sorting and sustainability requirements.
Page last updated on:





