Japan Data Center Construction Market Size and Share
Market Overview
| Study Period | 2020 - 2032 |
|---|---|
| Forecast Data Period | 2026 - 2032 |
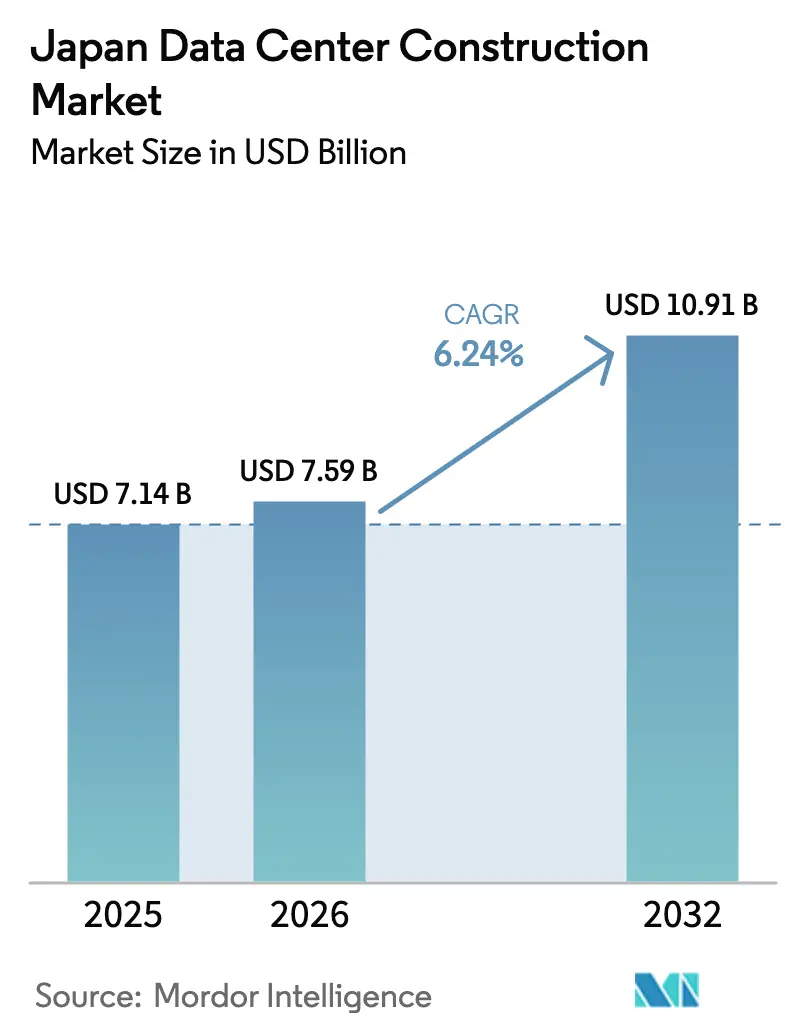
| Base Year Market Size (2025) | USD 7.14 Billion |
| Market Size (2026) | USD 7.59 Billion |
| Market Size (2032) | USD 10.91 Billion |
| Growth Rate (2026 - 2032) | 6.24% CAGR |
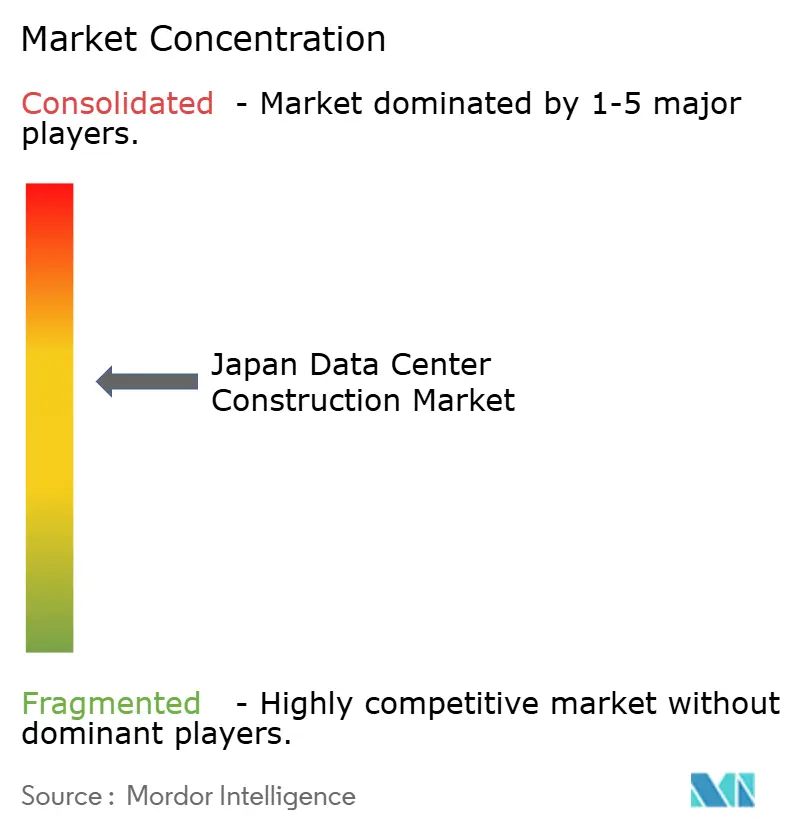
| Market Concentration | Medium |
Major Players *Disclaimer: Major Players sorted in no particular order Image © Mordor Intelligence. Reuse requires attribution under CC BY 4.0. | |
Japan Data Center Construction Market Analysis by Mordor Intelligence
The Japan data center construction market size is expected to grow from USD 7.14 billion in 2025 to USD 7.59 billion in 2026 and is forecast to reach USD 10.91 billion by 2032 at 6.24% CAGR over 2026-2032. Rising hyperscale investments, sovereign-cloud mandates, and edge computing rollouts keep large projects in the pipeline, while seismic engineering expertise and liquid cooling innovations sharpen competitive advantages. The steady capital inflow from Japanese real-estate investment trusts (J-REITs), coupled with subsidies under the Economic Security Promotion Act, continues to ease financing constraints for domestic operators. Grid upgrade plans by Kansai Electric and other utilities mitigate power-availability risks, and higher voltage distribution designs support GPU-dense halls. However, skilled labor shortages and land-price inflation temper the build-out pace, pushing firms to pursue modular designs and secondary-metro sites for cost control. Operators increasingly favor renewable power purchasing agreements to protect margins from tariff volatility, reinforcing the shift toward northern regions with ample green energy.
Key Report Takeaways
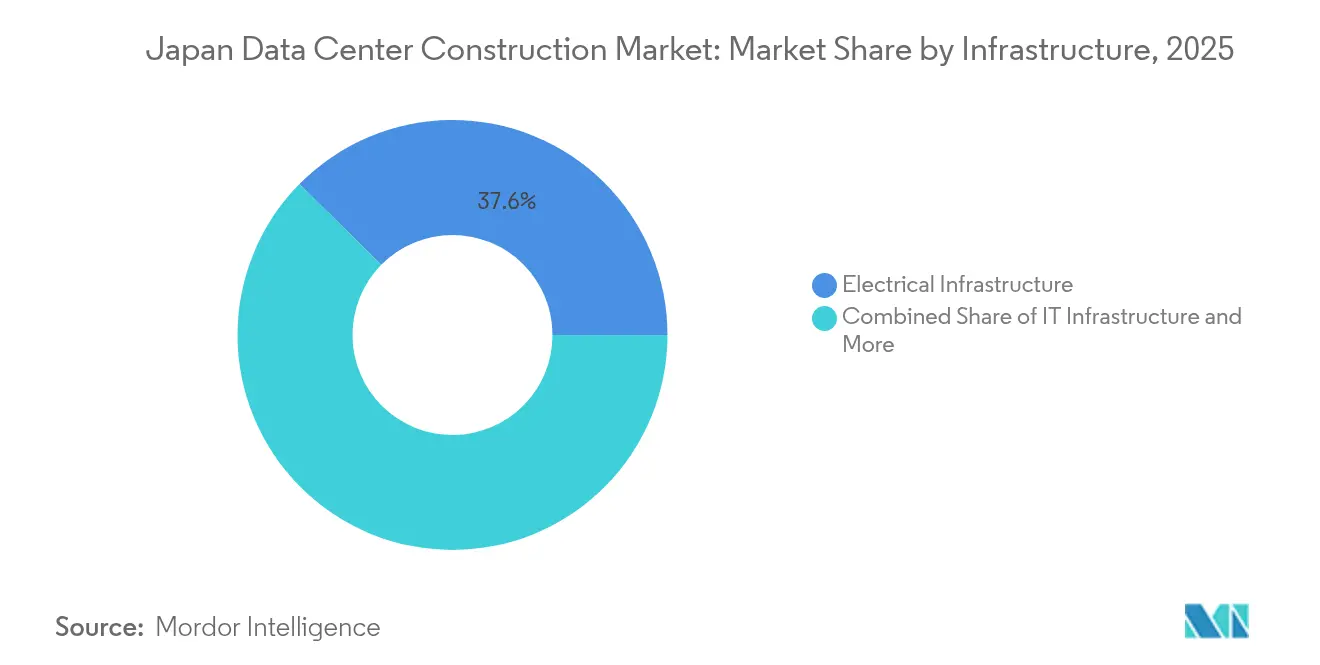
- By infrastructure, electrical systems led with a 37.62% share of the Japan data center construction market in 2025, while services are projected to post an 8.05% CAGR through 2032.
- By tier Standard, Tier III facilities commanded 56.42% of Japan data center construction market share in 2025, whereas Tier IV sites are expected to grow at an 8.43% CAGR to 2032.
- By end user industry, IT and telecommunications accounted for 47.65% of the Japan data center construction market size in 2025; healthcare is forecast to expand at an 8.01% CAGR between 2026-2032.
- By data center type, colocation captured 55.35% of 2025 revenue and edge or modular builds are on track for a 7.68% CAGR over the forecast window.
Note: Market size and forecast figures in this report are generated using Mordor Intelligence’s proprietary estimation framework, updated with the latest available data and insights as of 2026.
Japan Data Center Construction Market Trends and Insights
Drivers Impact Analysis*
| DRIVER | (~) % IMPACT ON CAGR FORECAST | GEOGRAPHIC RELEVANCE | IMPACT TIMELINE |
|---|---|---|---|
| Accelerating cloud, AI and big-data workloads | +1.8% | Global focus on Kanto and Kansai | Medium term (2–4 years) |
| Hyperscale campus build-outs | +1.5% | Kanto, Kansai, expanding to Kyushu | Short term (≤ 2 years) |
| Sovereign-cloud and data-residency regulations | +1.2% | National, first movers in government sectors | Long term (≥ 4 years) |
| 5G-driven edge-DC demand | +0.9% | Growth in secondary metros beyond Tokyo-Osaka | Medium term (2–4 years) |
| J-REIT capital inflows | +0.7% | Kanto, Kansai, select secondary markets | Short term (≤ 2 years) |
| Seismic base-isolation technologies | +0.4% | Nationwide, priority in earthquake-prone prefectures | Long term (≥ 4 years) |
| Source: Mordor Intelligence | |||
Accelerating Cloud, AI and Big-Data Workloads
Rising generative-AI projects lift rack densities to 100 kW plus, raising electricity demand by up to 20% and forcing operators toward liquid immersion systems.[1]SoftBank Corp., “Construction Begins on ‘Hokkaido Tomakomai AI Data Center’,” SoftBank, softbank.jp SoftBank’s 300 MW Tomakomai campus shows the new scale benchmark and targets 100% renewable power. GPU cloud providers such as Sakura Internet recorded a 476.3% profit jump in 2025, underscoring demand pull. Domestic oil major Idemitsu now supplies immersion fluids that cut cooling power 90%, anchoring a local value chain for sustainable AI infrastructure.
Hyperscale Campus Build-Outs by US and Domestic Majors
AWS has budgeted JPY 2.26 trillion through 2027, adding 30,500 annual jobs and JPY 5.57 trillion GDP impact.[2]Amazon Web Services, “AWS plans to invest 2.26 trillion yen into its Japanese cloud infrastructure by 2027,” Amazon, press.aboutamazon.com Oracle’s USD 8 billion plan centers on data sovereignty clients in Tokyo and Osaka. On the domestic front, the KDDI-Sharp alliance aims to open Asia’s largest cloud campus, while EdgeConneX is deploying 140 MW in Osaka to serve AI clusters. These multiyear programs anchor construction order books and intensify competition for skilled contractors.
Sovereign-Cloud and Data-Residency Regulations
The Economic Security Promotion Act earmarked JPY 72.5 billion in 2024 for five local cloud builds, reinforcing national control over sensitive datasets.[3]Ministry of Economy, Trade and Industry, “Approval of Plans for Ensuring a Stable Supply of Cloud Programs under the Economic Security Promotion Act,” METI, meti.go.jp Certification schemes such as ISMAP set strict design baselines for security zoning and operational resilience, pushing facilities toward Tier IV specifications. Domestic providers currently supply only 30% of baseline cloud services, creating room for expansion among companies that can meet compliance audits.
5G-Driven Edge-DC Demand in Secondary Metros
NTT Communications’ Local 5G Service Type D extends public 5G to enterprise campuses, sparking edge-node requirements in regional cities. Japan data center construction market participants now deploy 1–5 MW modular sites near smart-factory clusters to guarantee sub-10 millisecond latency. Internet Initiative Japan’s edge rollouts reinforce the hybrid architecture trend, pairing regional micro-hubs with hyperscale cores in Tokyo and Osaka.
Restraints Impact Analysis*
| RESTRAINTS | (~) % IMPACT ON CAGR FORECAST | GEOGRAPHIC RELEVANCE | IMPACT TIMELINE |
|---|---|---|---|
| Grid-power bottlenecks and tariff spikes | -1.4% | National, highest stress in Kanto and Kansai | Short term (≤ 2 years) |
| Scarcity of Tier-III/IV-certified MEP labor | -1.1% | Nationwide, acute in metro precincts | Medium term (2–4 years) |
| Environmental licensing and community pushback | -0.8% | Urban areas along Tokyo-Chiba-Kanagawa corridor | Medium term (2–4 years) |
| Escalating land prices in Kanto belt | -0.6% | Core Tokyo markets and spillover prefectures | Long term (≥ 4 years) |
| Source: Mordor Intelligence | |||
Grid-Power Bottlenecks and Surging Electricity Tariffs
Kansai Electric will invest more than JPY 150 billion from 2026 on four substations serving new campuses. Operators face extended grid-connection queues and tariff spreads that make Hokkaido the most expensive and Hokuriku the least. Higher costs strain profit margins just as liquid cooling drives power draw above historic norms. Some firms lock renewable PPAs or install on-site generation to hedge exposure.
Scarcity of Tier-III/IV-Certified MEP Labor
Construction labor shrank 20% in the past decade to 4.83 million, while 36% of workers are older than 55. Wage inflation of 16% since 2020 and legal overtime caps tighten project schedules. Complexities of high-voltage distribution, liquid cooling manifolds, and seismic base isolation demand rare skill sets, so EPC firms invest in training academies and digital twins to amplify scarce expertise.
*Our forecasts treat driver/restraint impacts as directional, not additive. The impact forecasts reflect baseline growth, mix effects, and variable interactions.
Segment Analysis
By Infrastructure: Electrical Dominance Amid Services Acceleration
Electrical infrastructure accounted for 37.62% of 2025 revenue, anchoring the Japan data center construction market share with high-voltage switchgear and busway upgrades. Services, though smaller, are forecast to achieve an 8.05% CAGR through 2032 as operators pay premiums for seismic engineering, immersion-cooling design, and AI workload layout optimization. Canon IT Solutions' West Tokyo site now supports 100 kVA liquid-cooled racks, showcasing hybrid cooling integration. Construction material inflation of 21-24% since 2021 pushes firms to modularize builds and pre-fabricate power rooms for faster delivery.
Japan data center construction market size expansion in services reflects demand for capacity-planning, commissioning, and retrofit consulting tied to generative-AI ramps. Mechanical infrastructure evolves toward dielectric fluids and direct-chip cooling, while IT infrastructure maintains steady orders for GPU servers despite enterprise cloud migration.


By Tier Standard: Tier III Stability Versus Tier IV Innovation
Tier III facilities maintained 56.42% Japan data center construction market share in 2025, serving enterprises and colocation tenants that value cost balance. Tier IV projects, though fewer, are rising at 8.43% CAGR through 2032 as hyperscale operators accept higher capital intensity for uninterrupted AI model training. Obayashi deploys active base isolation and ultra-high strength steel to secure Tier IV uptime in seismic zones.
Japan data center construction market size for Tier IV builds concentrates in the Tokyo-Osaka corridor where land costs justify high-density, high-availability designs. Tier I and Tier II legacy sites see attrition as tenants migrate workloads to cloud platforms demanding higher fault tolerance.
By Data Center Type: Colocation Maturity Versus Edge Innovation
Colocation remained at 55.35% of 2025 revenue, offering enterprises neutral interconnectivity and outsourced operations. Edge and modular sites register a 7.68% CAGR to 2032, propelled by latency-sensitive 5G, AR, and autonomous-vehicle use cases. Firms like Getworks deploy containerized rooms powered by renewables, adding flexibility for pop-up capacity in secondary metros.
Japan data center construction market share gains for edge providers stem from sub-10 millisecond latency requirements and local data-processing legislation. Hyperscale self-builds continue but cluster around core power-substation nodes, leaving opportunity for modular specialists in underserved prefectures.

By End User Industry: IT and Telecom Leadership with Healthcare Acceleration
IT and telecommunications companies contributed 47.65% of 2025 revenue due to 5G rollouts and relentless data-traffic growth. Healthcare produces the fastest-growing orders, advancing at an 8.01% CAGR as hospitals digitize records and deploy AI diagnostics linked to the Fugaku supercomputer network. Financial services clients require sovereign cloud compliance and retain sizable footprints in Kanto.
Japan data center construction market size unlocked by healthcare includes specialized suites meeting medical-data privacy codes and air-pressure zoning. Government and defense projects grow under cloud-first mandates, while manufacturing and retail deploy edge nodes for IoT analytics.
Geography Analysis
Kanto secured the highest 2025 share due to proximity to financial centers, government agencies, and Asia’s busiest internet exchanges. Tokyo capacity is projected to double within five years, yet land-price inflation and new 120-day notice rules in Koto ward raise development hurdles. Operators respond by densifying existing campuses and procuring longer-term land banks in nearby Chiba and Ibaraki.
Kansai ranks second and records the fastest upcoming growth thanks to EdgeConneX’s 140 MW Osaka campus and CapitaLand’s USD 700 million project. Kansai Electric’s grid investments mitigate historical power bottlenecks and strengthen the region’s appeal over more expensive Kanto sites. Equinix's fourth Osaka data center underscores the area’s maturation as an international hub.
Northern prefectures such as Hokkaido and Tohoku emerge as strategic AI locations, leveraging cooler climates and renewable energy to lower PUE. SoftBank’s 300 MW Tomakomai site illustrates the shift toward megascale builds outside traditional corridors. Chubu serves manufacturing clients seeking proximity to automotive clusters, while Kyushu and Okinawa gain traction for edge nodes supporting IoT in smart ports and logistics.
Competitive Landscape
Japan data center construction market shows moderate fragmentation with 38 operators running 175 live facilities. Domestic construction majors Obayashi, Taisei, Kajima, and Shimizu command seismic-engineering projects, while international colocation leaders Digital Realty and Equinix scale multi-tenant halls. Hyperscale users such as AWS, Oracle, and Google increasingly commission design-build contracts with liquid-cooling specialists.
Competitive dynamics pivot on patent portfolios for base-isolation and immersion-cooling systems, giving early movers a cost and compliance edge. J-REIT vehicles add a financial dimension, enabling quick capital recycling for brownfield and shell-ready assets. Secondary-metro strategies and modular deployments provide whitespace for smaller entrants to sidestep Kanto land premiums.
Strategic alliances—such as ESR-CloudHQ’s USD 2 billion campus partnership—signal rising joint-venture structures that blend land-owner reach with data-center operating expertise. M&A interest intensifies around edge-platform providers that hold regional power-purchase agreements and prefabrication toolsets.
Japan Data Center Construction Industry Leaders
Daiwa House Industry Co., Ltd.
HIBIYA ENGINEERING,Ltd.
Obayashi Corporation
Kajima Corporation
Fuji Furukawa Engineering and Construction
- *Disclaimer: Major Players sorted in no particular order

Recent Industry Developments
- February 2025: EdgeConneX revealed plans for a 140 MW AI data center in Osaka.
- January 2025: ESR and CloudHQ formed a USD 2 billion joint venture for a multi-building campus in Japan.
- January 2025: AWS confirmed a JPY 2.26 trillion investment program through 2027.
- January 2025: NTT DATA earmarked over USD 10 billion for global builds, with major Japanese allocations.


Japan Data Center Construction Market Report Scope
Data center construction combines physical processes used to construct a data center facility. It chains construction standards with data center operational environment requirements.
The Japanese data center construction market is segmented by infrastructure into electrical infrastructure (power distribution solutions (PDU, transfer switches, switchgear, power panels and components, and others power distribution solutions), power back-up solutions (UPS and generators), service – design & consulting, integration, support & maintenance)), mechanical infrastructure (cooling systems (immersion cooling, direct-to-chip cooling, rear door heat exchanger, in-row and in-rack cooling, racks, and other mechanical infrastructure)), and general construction. By tier type, the market is segmented into tier I and II, tier III, and tier IV. By end user, the market is segmented into (banking, financial services, and insurance, IT and telecommunications, government and defense, healthcare, and other end users. The market sizes and forecasts are provided in value terms (USD) for all the above segments.
| Electrical Infrastructure | Power Distribution Solutions | Power Distribution Units |
| Switchgears | ||
| Others | ||
| Power Backup Solutions | UPS | |
| Generators | ||
| Mechanical Infrastructure | Cooling Systems | Liquid-based Cooling |
| Air-based Cooling | ||
| Racks and Cabinets | ||
| Other Mechanical Infrastructure | ||
| IT Infrastructure | Servers | |
| Storage | ||
| Other IT Infrastructure | ||
| General Construction | ||
| Services | Design and Consulting | |
| Integration | ||
| Support and Maintenance | ||
| Tier I and II |
| Tier III |
| Tier IV |
| Colocation Data Centers |
| Hyperscale / Self-built Data Centers |
| Others (Enterprise / Edge / Modular) |
| Banking, Financial Services and Insurance |
| IT and Telecommunications |
| Government and Defense |
| Healthcare |
| Other End Users |
| By Infrastructure | Electrical Infrastructure | Power Distribution Solutions | Power Distribution Units |
| Switchgears | |||
| Others | |||
| Power Backup Solutions | UPS | ||
| Generators | |||
| Mechanical Infrastructure | Cooling Systems | Liquid-based Cooling | |
| Air-based Cooling | |||
| Racks and Cabinets | |||
| Other Mechanical Infrastructure | |||
| IT Infrastructure | Servers | ||
| Storage | |||
| Other IT Infrastructure | |||
| General Construction | |||
| Services | Design and Consulting | ||
| Integration | |||
| Support and Maintenance | |||
| By Tier Standard | Tier I and II | ||
| Tier III | |||
| Tier IV | |||
| By Data Center Type | Colocation Data Centers | ||
| Hyperscale / Self-built Data Centers | |||
| Others (Enterprise / Edge / Modular) | |||
| By End User Industry | Banking, Financial Services and Insurance | ||
| IT and Telecommunications | |||
| Government and Defense | |||
| Healthcare | |||
| Other End Users | |||


Key Questions Answered in the Report
What is the current value of the Japan data center construction market?
It stood at USD 7.59 billion in 2026 and is projected to reach USD 10.91 billion by 2032.
Which infrastructure segment captures the largest spend?
Electrical systems lead with a 37.62% revenue share in 2025.
Why are Tier IV data centers growing faster than Tier III in Japan?
Hyperscale operators require fault-tolerant environments for AI training, driving an 8.43% CAGR for Tier IV builds through 2032.
How will sovereign-cloud rules shape new construction?
Subsidies and compliance audits under the Economic Security Promotion Act favor domestic builds with higher security tiers.
Which region outside Tokyo is seeing the strongest development push?
Greater Osaka in Kansai is expanding fastest, supported by EdgeConneXs 140 MW campus and large grid investments.
What labor challenge affects project timelines?
A 20% decline in certified MEP technicians since 2013 and an aging workforce increase wage costs and schedule risk.
Page last updated on:


