
South Korea Data Center Construction Market Size and Share
Market Overview
| Study Period | 2020 - 2031 |
|---|---|
| Forecast Data Period | 2026 - 2031 |
| Base Year Market Size (2025) | USD 6.03 Billion |
| Market Size (2026) | USD 6.99 Billion |
| Market Size (2031) | USD 14.63 Billion |
| Growth Rate (2026 - 2031) | 15.92 % |
| Market Concentration | Medium |
Major Players *Disclaimer: Major Players sorted in no particular order Image © Mordor Intelligence. Reuse requires attribution under CC BY 4.0. | |
South Korea Data Center Construction Market Analysis by Mordor Intelligence
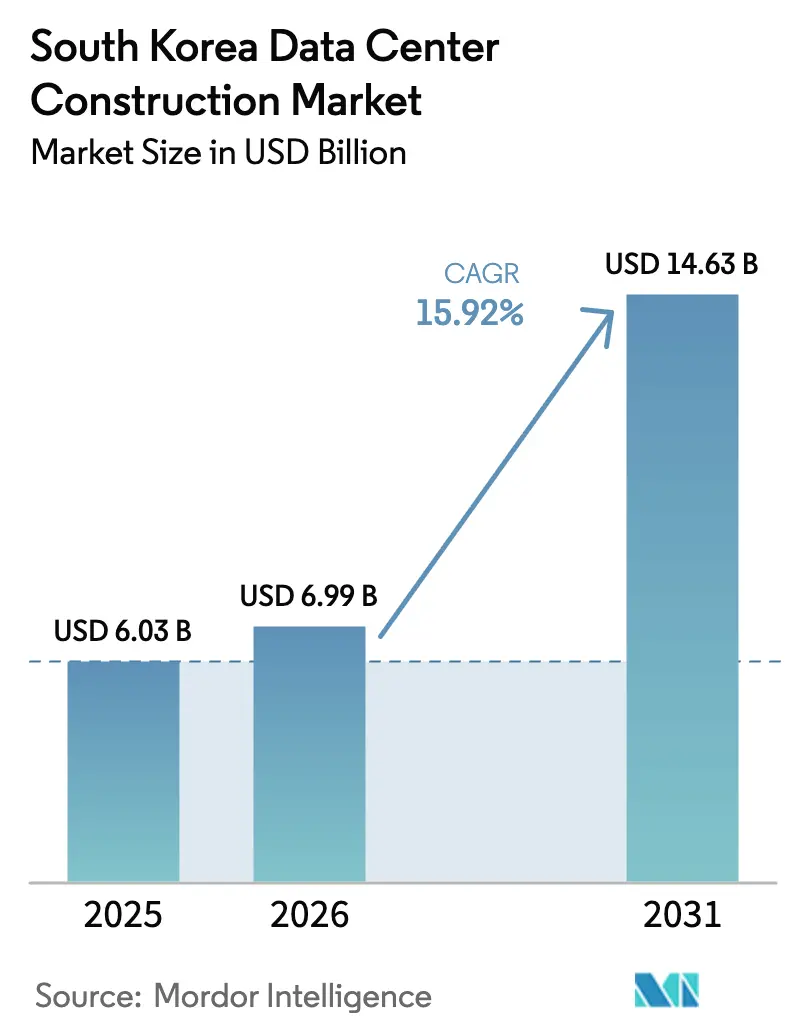
The South Korea data center construction market size was valued at USD 6.03 billion in 2025 and estimated to grow from USD 6.99 billion in 2026 to reach USD 14.63 billion by 2031, at a CAGR of 15.92% during the forecast period (2026-2031). This rapid expansion anchors South Korea’s ambition to become the primary digital infrastructure hub of Northeast Asia, supported by hyperscale capital spending, sovereign AI initiatives, and accommodative infrastructure policies. Intensifying GPU deployments, surging transformer orders, and sustained cloud-migration waves are lifting power-density benchmarks well beyond historical norms. Construction majors are shifting toward liquid-cooling expertise, while pension funds recycle long-duration capital into wholesale colocation shells. Secondary provinces are leveraging lower land costs and renewable resources to attract mega-campus projects, easing congestion in Greater Seoul. These intersecting vectors collectively propel the South Korea data center construction market toward double-digit annual growth and higher project complexity.
Key Report Takeaways
- By tier type, Tier 3 facilities held 63.72% of the South Korea data center construction market share in 2025; Tier 4 facilities are forecast to expand at a 16.88% CAGR through 2031.
- By data-center type, colocation services led with 53.35% revenue share in 2025, while hyperscaler self-builds are projected to grow at an 18.35% CAGR to 2031.
- By electrical infrastructure, power-backup solutions accounted for 55.48% share of the South Korea data center construction market size in 2025; power-distribution solutions are advancing at a 18.92% CAGR.
- By mechanical infrastructure, cooling systems commanded 41.92% share of the South Korea data center construction market size in 2025, with servers and storage infrastructure rising at a 15.78% CAGR.
- By geography, the Greater Seoul corridor retained an estimated 67.15% share of the South Korea data center construction market size in 2025, yet Jeollanam-do is pacing the fastest capacity additions at 23.05% CAGR on the back of the 3 GW AI hub commitment.
Note: Market size and forecast figures in this report are generated using Mordor Intelligence’s proprietary estimation framework, updated with the latest available data and insights as of 2026.
South Korea Data Center Construction Market Trends and Insights
Drivers Impact Analysis*
| Driver | (~) % Impact on CAGR Forecast | Geographic Relevance | Impact Timeline |
|---|---|---|---|
| Surge in hyperscale and AI-led investments (2025-) | +4.2% | National, concentrated in Greater Seoul and Jeollanam-do | Medium term (2-4 years) |
| Government plan for 3 GW "mega" AI data hub in Jeollanam-do | +3.8% | Regional, with national spillover effects | Long term (≥ 4 years) |
| Cloud-migration wave by chaebol subsidiaries | +2.9% | National, with Seoul metropolitan area focus | Short term (≤ 2 years) |
| 5G/Private-5G edge-compute build-outs | +2.1% | National, prioritizing urban centers | Medium term (2-4 years) |
| Under-reported: Hydrogen-fuel-cell micro-grids for Seoul DCs | +1.4% | Seoul metropolitan area | Long term (≥ 4 years) |
| Under-reported: Capital-recycling by Korean pension funds into DC real-estate | +1.8% | National | Medium term (2-4 years) |
| Source: Mordor Intelligence | |||
Surge in hyperscale and AI-led investments drive market transformation
Hyperscale operators and domestic conglomerates are jointly underwriting record-size campuses designed around GPU-dense clusters. SK Group’s USD 4 billion alliance with AWS in Ulsan will scale from 41 MW in 2027 to 103 MW by early 2029, illustrating phased power-envelope planning for AI inference loads. Samsung Electronics likewise finalized its Hwaseong HPC Center after investing KRW 1.5 trillion (USD 1.13 billion) to house 116,000 servers, reinforcing sovereign AI objectives.[1]Yoon-Seok Kim, “Samsung Completes Hwaseong HPC Campus,” Maeil Business Newspaper, mk.co.kr Upstream, HD Hyundai Electric has allocated USD 274 million to expand transformer output by 30% as domestic utilities race to fulfill data-center interconnect requests. These capital flows reposition the South Korea data center construction market as a preferred launchpad for regionwide AI workloads, stimulating specialized construction demand across electrical, mechanical, and security subsystems.
Government’s 3 GW AI data-hub initiative reshapes regional development
Jeollanam-do’s preliminary accord with Stock Farm Road calls for a USD 35 billion, 3-gigawatt campus that begins ground-breaking in winter 2025 and wraps by 2028.[2]Isabelle Gallagher, “Jeollanam-do Signs 3 GW Data-Hub Deal,” Capacity Media, capacitymedia.com The megaproject alleviates grid congestion in Pangyo and Songdo while creating 10,000 direct jobs and USD 3.5 billion in early-stage revenue. State support—expedited permitting, sub-station upgrades, and tax credits—signals a durable political commitment to disperse capacity beyond Seoul. Consequently, the South Korea data center construction market is witnessing a geographic re-weighting as land-hungry hyperscalers secure multi-hectare plots in secondary provinces where renewable energy pipelines are deeper and land prices are one-third of capital-area averages.
Chaebol cloud-migration accelerates enterprise infrastructure demand
Stacks blending colocation cages, native cloud, and private cores. The managed-services segment cleared KRW 7 trillion (USD 5.3 billion) in 2024 turnover, buoyed by CJ OliveNetworks and KT’s service expansions. Samsung SDS is spending KRW 21.5 billion to stand up an AI-centric facility at Gumi that will interlink directly with semiconductor production lines. This enterprise refactoring fuels rack-density upgrades, propelling the South Korea data center construction market toward higher average power allotments per square meter.
5G and private-5G networks drive edge-computing infrastructure
NAVER Cloud’s private 4.7 GHz network at Hoban Construction’s site covers 40,000 m², enabling autonomous drones and wearable safety gear. As manufacturing and logistics facilities replicate the model, demand shifts toward micro-modular data centers positioned inside industrial campuses. Contractors therefore bundle telecom shelters, battery arrays, and liquid-to-chip cooling kits in a single mobilization cycle, enlarging the serviceable obtainable market for the South Korea data center construction market.
Restraints Impact Analysis*
| Restraint | (~) % Impact on CAGR Forecast | Geographic Relevance | Impact Timeline |
|---|---|---|---|
| Grid-connection bottlenecks around Greater-Seoul | -2.8% | Greater Seoul metropolitan area | Short term (≤ 2 years) |
| Public opposition on power-intensive projects | -1.9% | National, concentrated in urban areas | Medium term (2-4 years) |
| Escalating land-prices in Pangyo and Songdo tech-valleys | -1.6% | Pangyo and Songdo tech valleys | Short term (≤ 2 years) |
| Under-reported: MoEF tax-incentive sunset for DC cooling equipment (2027) | -1.2% | National | Medium term (2-4 years) |
| Source: Mordor Intelligence | |||
Grid-connection bottlenecks constrain Seoul-metropolitan expansion
Electric demand from AI clusters is projected to double by decade-end, outpacing grid-reinforcement budgets at financially stressed KEPCO. Developers now face multi-year waits for 154 kV tie-ins, inflating project schedules and carrying costs. The 11th Basic Plan for Electricity envisions 121.9 GW of renewables by 2038, yet analysts cite a shortfall relative to data-center power trajectories.[3]Simon Nicholas, “Korea’s Grid Faces Data-Center Crunch,” IEEFA, ieefa.org As a result, operators pivot to Jeollanam-do and Ulsan, where interconnection queues are shorter and LNG-cold-energy synergies exist, thereby redefining site-selection heuristics in the South Korea data center construction market.
Public opposition emerges as significant development risk
Community groups halted a Seoul data-center build in January 2025 over energy-consumption worries. National carbon-reduction pledges—40% below 2018 baselines by 2030—catalyze scrutiny of water usage and Scope 2 emissions. Developers counter with district-heating tie-ins, on-site solar roofs, and hydrogen-fuel-cell pilots, yet permitting timelines are lengthening, raising the non-technical risk profile inside the South Korea data center construction market.
*Our forecasts treat driver/restraint impacts as directional, not additive. The impact forecasts reflect baseline growth, mix effects, and variable interactions.
Segment Analysis
By Tier Type: Mission-Critical Infrastructure Drives Premium Demand
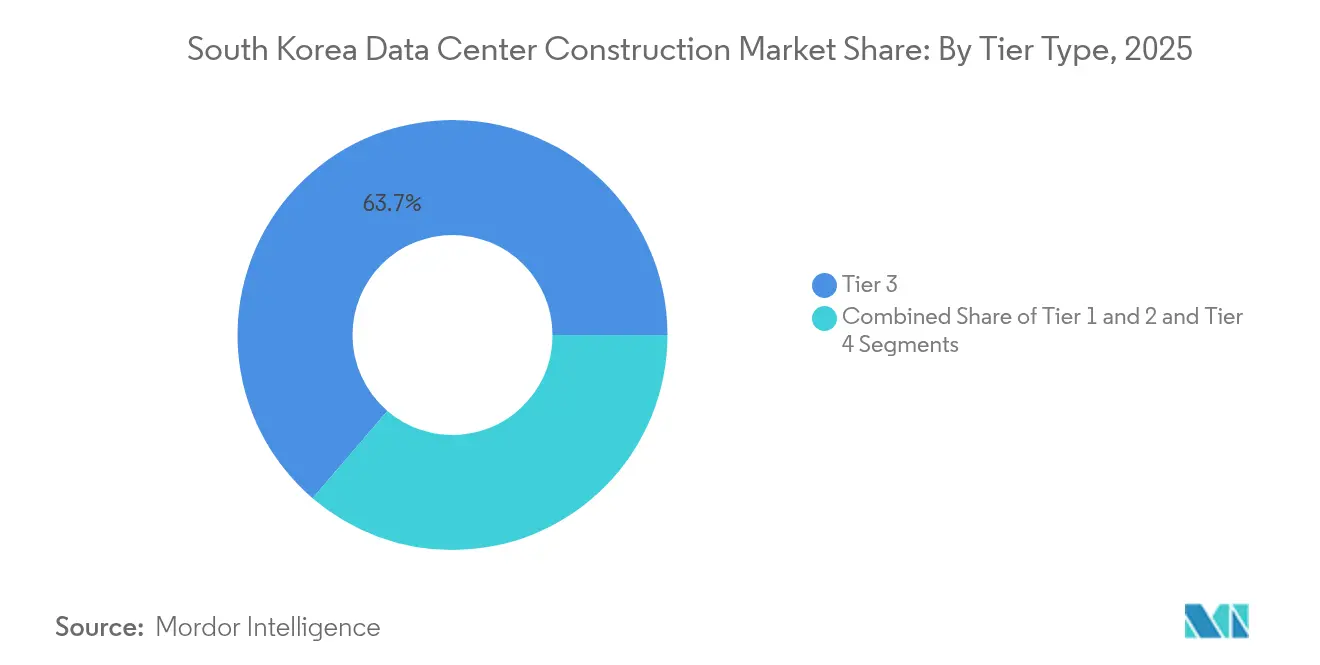
Tier 3 facilities represent the backbone of domestic fintech, cable-TV billing, and public-sector workloads, capturing 63.72% of the South Korea data center construction market share in 2025. Their concurrent-maintainability architecture aligns with local uptime regulations. As hyperscalers deploy multi-cluster AI farms, demand tilts toward Tier 4, which is expanding at a 16.88% CAGR and is forecast to absorb an additional 400 MW by 2030. The South Korea data center construction market size for Tier 4 builds is projected to swell to USD 4.88 billion by 2031. Construction majors are retooling supply chains to source 2N transformers and chilled-water ring loops, while facilities management firms adopt digital twins for predictive maintenance. Lower-tier builds still serve dev-test sandboxes and edge POPs, but their relative importance is receding.
Rising availability SLAs push Korean insurers and banks to migrate core ledgers into Tier 3+ footprints. Samsung C&T pilots submerged-server tanks to achieve PUE targets below 1.15, thereby meeting both redundancy and energy benchmarks. With demand high, some operators pre-sell capacity two years prior to go-live, locking in power tariffs amid inflationary pressures. Market observers expect Tier 4 rack densities to breach 40 kW by 2027, underscoring a power-first design ethos inside the South Korea data center construction market.



By Data Center Type: Hyperscaler Self-Build Momentum Accelerates
Colocation suites commanded 53.35% of 2025 revenue after onboarding hundreds of mid-cap enterprises facing capex constraints. However, hyperscalers prefer proprietary campus designs, pushing the self-build slice toward an 18.35% CAGR. The South Korea data center construction market size attached to hyperscaler projects is forecast at USD 7.64 billion in 2031. Design-build contractors must therefore integrate liquid-immersion cooling, 3 MW power blocks, and 48 V DC busways. Edge micro-sites, while growing, remain below 5% share.
SK-AWS Ulsan’s 60,000-GPU phase alone commands more concrete than twelve average colocation builds combined, illustrating the scale differential. Contractors are incorporating LNG cold-energy exchangers and seawater intake tunnels to hit operating-cost targets. Concurrently, enterprise CIOs negotiate hybrid burst pathways, ensuring colocation demand stays resilient. This dual-track demand keeps the South Korea data center construction market pluralistic even as hyperscalers scale vertically.
By Electrical Infrastructure: Power-Distribution Innovation Leads Growth
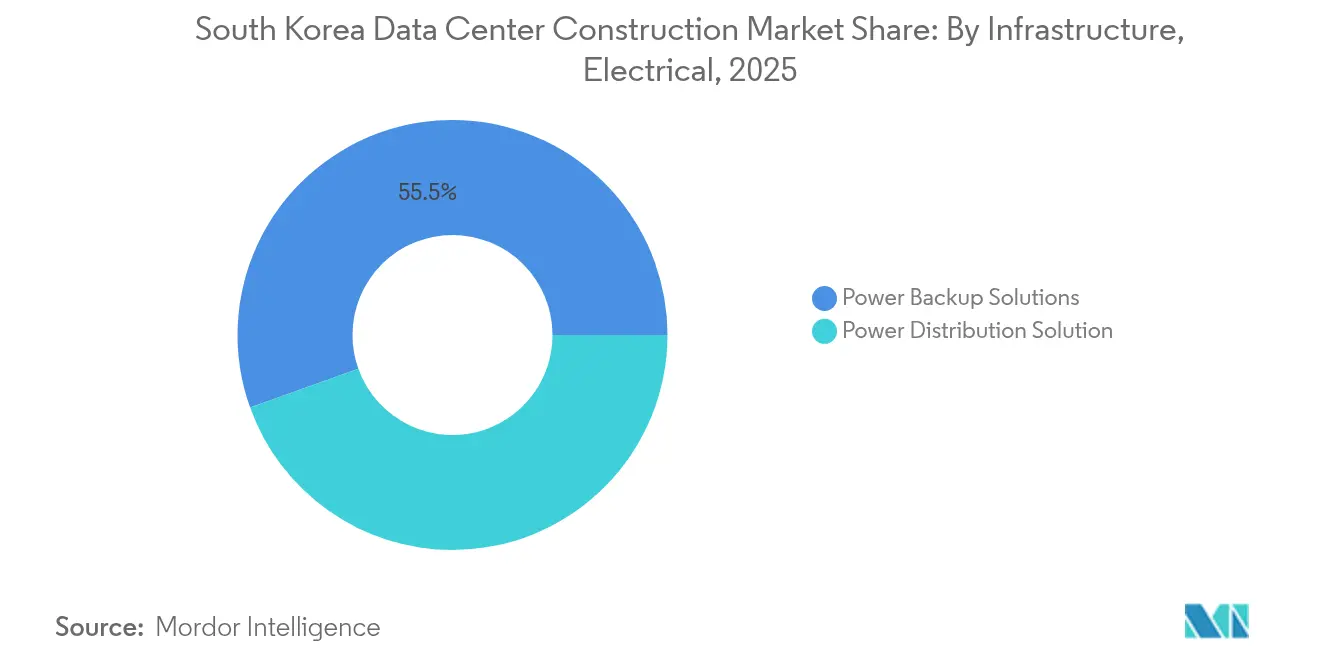
Backup systems (UPS, generators) held 55.48% share of electrical spend in 2025, reflecting high-availability mandates. Yet AI racks draw peak loads beyond 70 kW, compelling a pivot toward advanced switchgear and solid-state transformers, the fastest-growing sub-segment at 18.92% CAGR. The South Korea data center construction industry benefits from local supply depth: LS Electric ships busduct assemblies to Memphis for xAI facilities, showing export competitiveness.
HD Hyundai Electric’s added 30% transformer capacity enabling shorter lead times for domestic builds. Meanwhile, Hyosung Heavy scales Memphis plant output to 200 units by 2026, hedging against currency swings and US tariff risks. Intelligent PDUs with embedded analytics now ship standard, giving operators real-time phase-imbalance alerts. Collectively, these shifts elevate electrical capex intensity per megawatt, bolstering revenue visibility across the South Korea data center construction market.
By Mechanical Infrastructure: Cooling Innovation Addresses AI Demands
Cooling systems commanded 41.92% expenditure in 2025, with chilled-water loops and rear-door heat exchangers dominant. GPU clusters push inlet temperatures upward, accelerating adoption of direct-to-chip liquid cooling. Servers and storage cabinets, the fastest-growing slice at 15.78% CAGR, embed copper cold-plates to dissipate 800 W chips. This dynamic raises overall mechanical-to-electrical spend ratios within the South Korea data center construction market.
Samsung C&T’s underwater-cooling proof-of-concept aims to route coolant through coastal pipelines for free-cooling potential of 5 °C seawater. Rack vendors are standardizing 48U form factors that accept 1.5-inch coolant quick connects, shortening install cycles. Fire-suppression systems integrate early smoke aspirating detection due to liquid-cooling condensation risk. These mechanical innovations sharpen Korea’s value proposition versus land-constrained peers such as Singapore.
Geography Analysis
Greater Seoul retained roughly 67.15% of installed IT load in 2025, but grid queues and land inflation—KRW 30,000-50,000 per m²—are eroding its dominance. The South Korea data center construction market size for capital-area builds is projected to plateau by 2027. Grid-approved capacity is rationed, forcing some developers to consider onsite gas turbines. Municipalities are tightening zoning around Pangyo Techno Valley, adding procedural friction. Despite these obstacles, investors still prize the metro’s dense fiber rings and enterprise adjacency, ensuring a pipeline of brownfield reconversions within industrial parks.
Jeollanam-do’s 3 GW blueprint repositions the southwest as the country’s largest future power sink. Land prices under USD 150 per m² and ample renewable potential offer a compelling math for hyperscalers. Ulsan, armed with LNG import terminals, has emerged as a cold-energy hub, enabling SK-AWS to deploy heat-recovery chillers at scale. Busan pursues subsea-cable landing proximity to cultivate disaster-recovery nodes, while Daegu markets geothermal cooling advantages. Collectively, these initiatives diversify the South Korea data center construction market footprint.
Regional governments bundle workforce grants, tax holidays, and expedited 154 kV tap-lines, slashing greenfield timelines by nine months on average. Telecom carriers extend dark-fiber backbones, mitigating latency penalties for workloads replicated into Seoul. As more capacity surfaces in periphery provinces, colocation prices in Songdo have shown early signs of moderation. Investors forecast that by 2031, non-Seoul regions may collectively hold 45.60% of national IT load, underscoring structural realignment within the South Korea data center construction market.
Regulatory Landscape
South Korea’s permitting and compliance environment for AI-ready facilities tightened around energy and siting, while it also added an explicit fast-track path for designated projects. A key change is the Special Act on the Promotion of the Artificial Intelligence (AI) Data Center Industry (AIDC Special Act), promulgated on June 9, 2026, with implementation scheduled for February 2027. Under this framework, the Ministry of Science and ICT acts as a unified processing window and introduces a timeout-style approval process that consolidates cross-cutting reviews (power, fire, traffic, and landscape), which can shift construction schedules and raise or lower pre-development risk in both the Greater Seoul corridor and provincial clusters.
The same policy direction differentiates capital versus non-capital regions, aligning with the market’s move beyond Seoul where grid connection queues are a constraint. Within the AIDC Special Act construct, AI data centers in non-capital regions can receive regulatory relief such as exemption from power grid impact assessments for new builds or expansions, complementing regional development programs anchored by pipeline commitments like Jeollanam-do’s 3 GW AI hub initiative. A dedicated research group formed on June 18, 2026 to draft subordinate statutes, including definitions and eligible exceptions, adds near-term compliance work for developers, EPCs, and operators structuring projects around provincial sites and special-zone incentives.
Value Chain Analysis
The value chain covers land origination and permitting, design and engineering, civil and MEP construction, power and cooling equipment supply, fit-out and commissioning, and multi-year operations under EPC, turnkey, or DBO models. Korean EPC leaders such as Samsung C&T, Hyundai E&C, DL E&C, GS E&C, and SK ecoplant increasingly bid as end-to-end integrators, coordinating high-capacity electrical rooms, chilled-water or liquid-cooling loops, and security systems tailored for GPU-dense halls. Upstream constraints are concentrated in utility interconnection and long-lead electrical components (transformers, switchgear, busduct), increasing the importance of early procurement and vendor qualification.
Downstream, systems integration and cloud-adjacent managed service players are shaping delivery models, with Samsung SDS, LG CNS, and KT Cloud competing for DBO-style contracts that bundle lifecycle responsibility from build through operations. Equipment supply remains a differentiator: LS ELECTRIC, HD Hyundai Electric, and Hyosung Heavy Industries anchor domestic sourcing for switchgear and transformers, while energy storage and power quality needs pull in suppliers such as Samsung SDI and LG Energy Solution. On construction methods, modular approaches and immersion or liquid cooling deployments (including Samsung C&T initiatives with specialized partners) are moving from pilots to bid prerequisites for Tier 3 and Tier 4 builds, tightening coordination between designers, MEP contractors, and commissioning teams.
Competitive Landscape
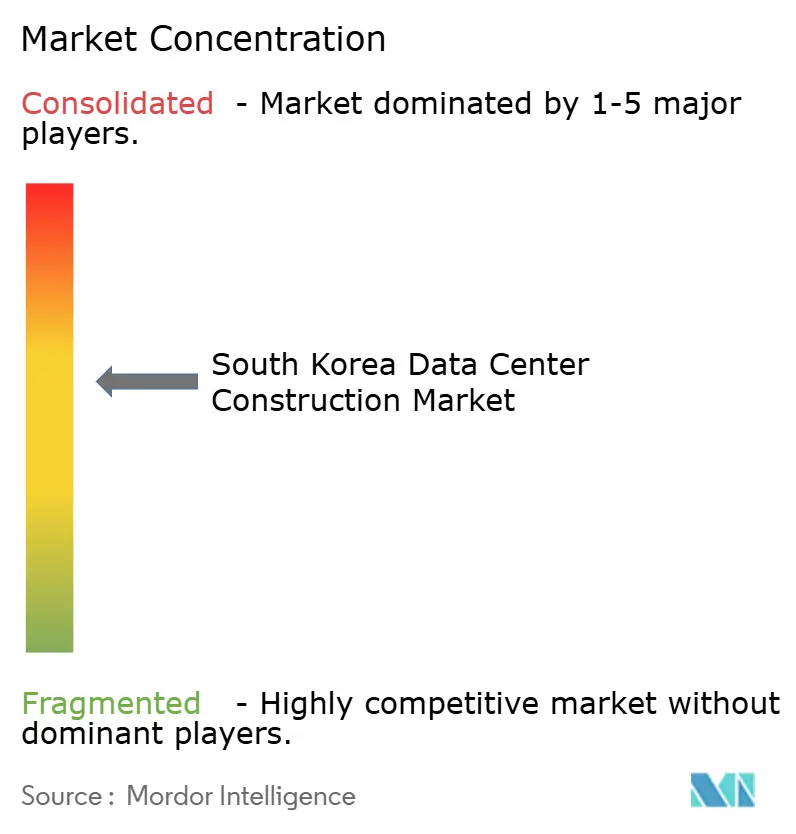
Fragmentation persists, with the top five builders holding roughly 46% combined 2024 revenue. Samsung C&T, Hyundai E&C, and GS E&C leverage multibillion-dollar balance sheets to guarantee bonded schedules but increasingly partner with niche engineering firms for liquid-cooling and DC-bus retrofits. International developers—NTT GDC, DCI Data Centers, and Equinix—expand via JV structures that de-risk local compliance. Start-ups focused on modular edge pods capture industrial IoT demand along shipping corridors. This multiplicity sustains a vibrant South Korea data center construction market.
Technology partnerships distinguish bids. Samsung C&T’s 2024 MOU with Shell Energy explores hydrogen-fuel-cell power plants to secure off-grid redundancy, a tactic resonating with municipalities eyeing decarbonization targets. GS E&C co-develops digital twins with Dassault Systèmes to compress commissioning cycles by 20%. Such differentiators win premium margins, especially.
South Korea Data Center Construction Industry Leaders
Samsung CandT Corporation
Hyundai Engineering and Construction
DL EandC (Daelim)
GS Engineering and Construction
SK ecoplant
- *Disclaimer: Major Players sorted in no particular order

Market Opportunities and Future Outlook
Whitespace is building around provincially sited AI data center campuses and the enabling infrastructure needed to make projects bankable, particularly grid-ready substations, water supply, utility tunnels, and access to renewable power. This is reinforced by the AIDC Special Act timeline (promulgated June 2026, implementation scheduled February 2027), which positions the Ministry of Science and ICT as a single permitting window and offers targeted regulatory relief for non-capital-region AI data centers, including exemption from certain grid impact assessments. Separately, South Korea’s policy narrative points to large capacity ambitions for AI data centers (8.4 GW by 2029 and 10 GW by 2035), and project momentum shows up in named provincial pipelines such as Samsung SDS-linked development activity in Gumi and multi-province site exploration reported for Chuncheon, Bucheon, and Donghae.
A second opportunity cluster centers on integrated delivery and operations contracting as more owners treat data centers as infrastructure real estate rather than core IT, increasing reliance on experienced EPC and SI consortia for design-build-operate delivery. Competitive activity provides concrete proof points: SK Group and AWS advanced a USD 4 billion AI data center plan in Ulsan, phased from 41 MW to 103 MW, while contractors and OEMs are investing to relieve electrical bottlenecks, including HD Hyundai Electric’s USD 274 million transformer capacity expansion and LS Electric’s external demand pull through US data center distribution-board wins. Together, these dynamics broaden addressable work beyond shell construction into higher-margin packages such as power distribution, backup, liquid cooling integration, and commissioning, especially in new-build regions where land availability and permitting pathways are being structured to attract large campuses.
Recent Industry Developments
- July 2026: Samsung C&T applied for a construction permit for an AI data center in Chuncheon, Gangwon Province, in partnership with Samsung SDS. The move expands regional AI capacity development in a northern corridor and aligns with ongoing hyperscale expansion plans within the country. The collaboration with Samsung SDS strengthens joint execution capabilities and improves access to a strategic mid core market for future data center builds.
- May 2026: DL E&C secured a 126.8 billion KRW contract to construct the 9.8 MW Samjeong AI Hub Center in Bucheon, Gyeonggi Province. The project adds a new large-scale AI centric data center in the Seoul metropolitan area, reinforcing the region as a focal point for AI infrastructure growth. This expands DL E&C’s AI dedicated data center portfolio and regional market access.
- January 2026: Samsung SDS announced signing of an MOU with Gyeongsangbuk-do and Gumi City to construct a 60 MW AI data center in Gumi. The agreement anchors a major regional AI deployment in a strategic growth hub, signaling a strengthened ecosystem for data center development in the province. The arrangement accelerates regional data center build-out strategy through enhanced collaboration with local authorities.


Research Methodology Framework and Report Scope
Market Definition and Coverage
For this study, the market covers the full construction spend required to build or expand a data center site in South Korea, including core building works and the main physical infrastructure installed to run the facility.
Scope exclusions: This sizing does not count ongoing operations spend after commissioning, such as facility management, power bills, network services, and colocation service revenue.
Segmentation Overview
- By Tier Type
- Tier 1 and 2
- Tier 3
- Tier 4
- By Data Center Type
- Colocation
- Self-build Hyperscalers (CSPs)
- Enterprise and Edge
- By Infrastructure
- By Electrical Infrastructure
- Power Distribution Solution
- Power Backup Solutions
- By Mechanical Infrastructure
- Cooling Systems
- Racks and Cabinets
- Servers and Storage
- Other Mechanical Infrastructure
- General Construction
- Service - Design and Consulting, Integration, Support and Maintenance
- By Electrical Infrastructure
Data Sources, Market Sizing, and Validation
Desk Research
Desk research starts by building the demand context for new data center builds and major expansions in South Korea, then linking that to construction intensity and typical build timelines. We rely on public series that show where projects concentrate, how fast capacity is added, and what drives mechanical and electrical requirements for each build phase.
Commonly used public sources include items such as Ministry of Trade, Industry and Energy releases on power and grid programs, Statistics Korea macro and construction indicators, Korea Customs Service trade statistics for equipment categories, local permitting and land use disclosures where available, and peer-reviewed papers on cooling and power density. We also review company filings, investor presentations, reputable press, and project award notes, and then use paid subscriptions for company financials and intelligence, patent databases, and shipment level import and export checks where it supports validation. This list is indicative only, and many other sources were reviewed for data collection, validation, and clarification.
Primary Interviews and Surveys
Primary work is used to confirm what is being built and priced now in South Korea, including the split between general construction and the installed electrical and mechanical scope. We speak with a mix of contractors, engineering teams, equipment integrators, developers, and operator side buyers across major hubs and secondary provinces to validate cost ranges, lead times, and typical design choices (for example, redundancy level and cooling approach).
Distribution of primary research fieldwork respondents
| Company type | Respondent position |
|---|---|
| Top tier: 27% | CXOs: 14% |
| Mid tier: 59% | Functional/Unit leaders: 39% |
| Smaller Players: 14% | Managers: 47% |
Market-Sizing & Forecasting
Sizing is built using a top-down approach where the pipeline of planned and ongoing builds is translated into annual construction value through typical cost per MW and cost per square meter logic, and then split into electrical, mechanical, and general construction shares. To keep totals realistic, selective bottom-up checks are done through sampled project budgets, supplier and contractor revenue signals, and channel feedback on current pricing for key packages.
A few inputs that materially move the model include new IT load additions and commissioning timelines, target tier and redundancy choices, shifts in rack density that change cooling and power design, local labor and material cost indices, and the mix between colocation builds and self-built campuses. When project details are not disclosed, gaps are handled by using location and scale proxies, followed by cost normalization to the same year and currency assumptions.
Forecasting uses scenario analysis supported by trend inputs, and then stress tests are run on power availability constraints, permitting pace, and the timing of large campus phases. Expert feedback is used to keep the ramp realistic before finalizing the yearly curve.
Data Validation & Update Cycle
Validation is done by triangulating model outputs against independent signals, such as announced capacity in MW, construction award momentum, and import and shipment movement for relevant equipment categories. Variance checks are run at the package level, so unusually high electrical or mechanical shares are flagged and reviewed. When the spread is not explainable, key assumptions are re-tested with follow-up calls.
Before sign-off, the build is reviewed in multiple steps by the analyst team to confirm arithmetic integrity, consistent definitions, and reasonable year-on-year movements. Reports are refreshed annually, with interim updates when large project shifts, policy changes, or supply constraints create a material change. Before delivery, a final pass is completed so clients receive the latest updated view.
Mordor Intelligence's South Korea Data Center Construction Market Size Versus Other Published Estimates
Published values for this market can look far apart because the term construction is not always used in the same way, and because some sources lean more toward investment announcements than contracted work completed in a year. Differences also show up when time windows vary, when currency conversion timing is not aligned, and when the assumed cost per MW is not refreshed for newer power density design approaches.
The main gap comes from whether general construction plus the full mechanical and electrical fit-out are counted together. Mordor Intelligence counts those packages only when they are tied to data center builds and major expansions in South Korea, instead of mixing in broader digital infrastructure or ongoing operations spend.
Benchmark comparison
| Source | Market Size | Gaps in Research Methodology |
|---|---|---|
| Mordor Intelligence | USD 6.03 B (2025) | |
| Industry Newswire A | USD 7.22 B (2029) | Uses an investment headline for a later year and can blend planned capex with committed construction value, which is not directly comparable to a base-year market size. |
| Regional Market Blog B | USD 5.00 B (2024) | Often reflects broader data center investment or facility economics rather than the construction package scope, and it may apply a single growth rate without rebuilding year-by-year project timing. |
The spread in the table is largely explained by scope alignment and timing, not just growth expectations. When the same year, currency basis, and construction package definitions are applied, the estimate becomes easier to trace back to the project pipeline, cost drivers, and realistic build schedules, which helps decision-makers compare options on a like-for-like basis.


Key Questions Answered in the Report
What is the current size of the South Korea data center construction market?
The market is valued at USD 6.99 billion in 2026 and is projected to reach USD 14.63 billion by 2031.
Which segment is growing fastest within the South Korea data center construction market?
Hyperscaler self-build deployments are expanding at an 18.35% CAGR, reflecting cloud providers’ preference for custom, AI-ready campuses.
Why are secondary provinces attracting new data centers?
Regions like Jeollanam-do and Ulsan offer lower land costs, available grid capacity, and government incentives, relieving congestion in Greater Seoul.
How are power-grid constraints affecting project timelines?
Interconnection queues around Seoul can delay large projects by several years, pushing developers to seek sites with ready access to transmission capacity.
What cooling innovations are being adopted for AI workloads?
Direct-to-chip liquid cooling, LNG cold-energy exchanges, and experimental underwater loops are emerging to manage high-density GPU clusters.
How concentrated is the competitive landscape?
The top five construction firms hold about 46% of market revenue, indicating moderate concentration with room for specialized entrants.
Page last updated on:
- Data Center Server Market Servers worldwide, split by tier, facility size and facility type.
- Artificial Intelligence (AI) Data Center Market AI facilities across the global market, covering facility type, component and tier.
- South Korea Data Center Rack Market Racks in South Korea, split by rack size, rack height and rack type.
- Japan Data Center Server Market Servers demand across Japan, covering tier, facility size and facility type.
- South Korea Data Center Storage Market Storage in South Korea, split by storage technology, storage type and facility type.
- Japan Data Center Storage Market Japan's storage, split by facility size and tier.
- Japan Data Center Power Market Power systems in Japan, split by component, facility type and facility size.
- South Korea Data Center Server Market Servers demand across South Korea, covering data-center tier, form factor and application / workload.


 Your data is secure and never sold or shared.


