Market Overview
| Study Period | 2021 - 2031 |
|---|---|
| Forecast Data Period | 2026 - 2031 |
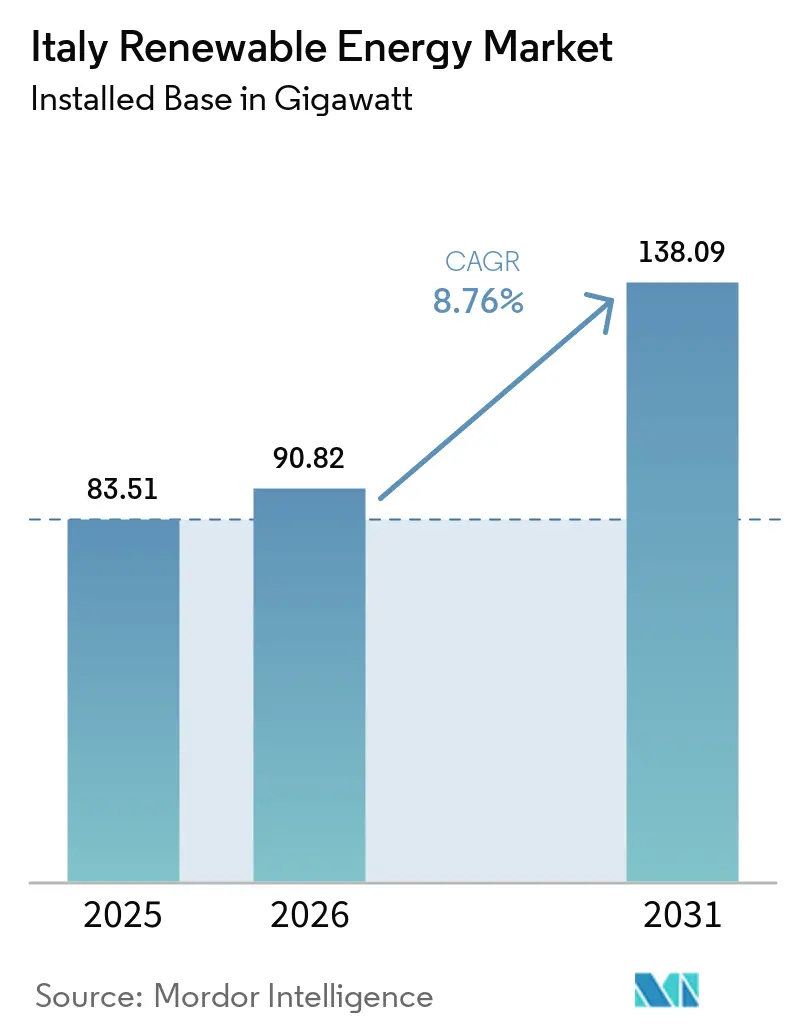
| Base Year Market Size (2025) | 83.51 gigawatt |
| Market Volume (2026) | 90.82 gigawatt |
| Market Volume (2031) | 138.09 gigawatt |
| Growth Rate (2026 - 2031) | 8.76% CAGR |
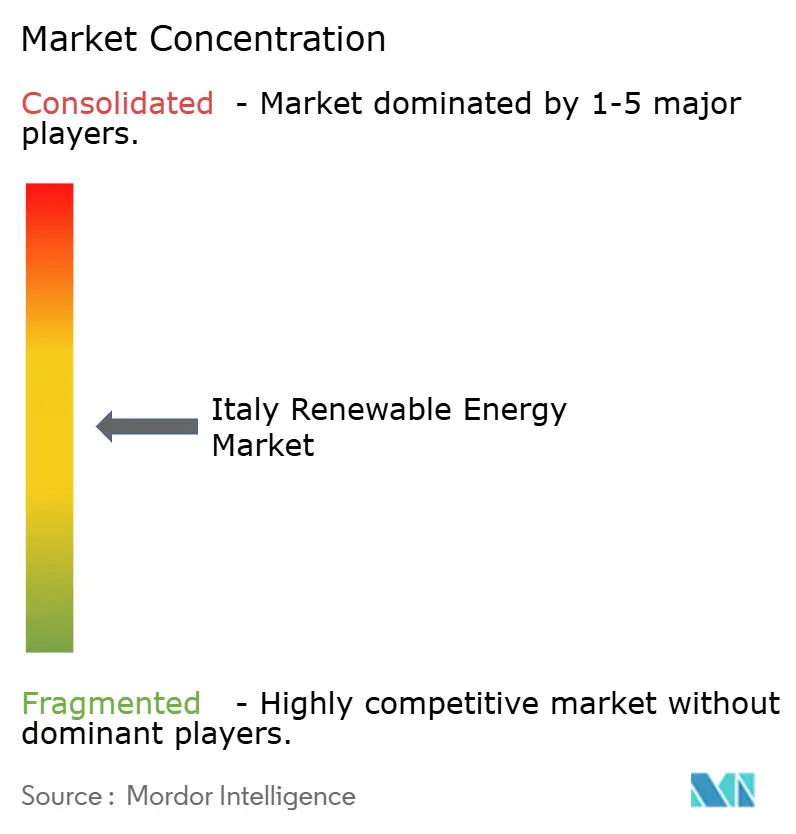
| Market Concentration | Medium |
Major Players *Disclaimer: Major Players sorted in no particular order Image © Mordor Intelligence. Reuse requires attribution under CC BY 4.0. | |
Italy Renewable Energy Market Analysis by Mordor Intelligence
Italy Renewable Energy Market size in 2026 is estimated at 90.82 gigawatt, growing from 2025 value of 83.51 gigawatt with 2031 projections showing 138.09 gigawatt, growing at 8.76% CAGR over 2026-2031.
Abundant National Recovery and Resilience Plan funding, EU Fit-for-55 mandates, and a maturing prosumer ecosystem are pulling forward project pipelines, while falling photovoltaic levelized costs of electricity keep solar power competitive against gas-fired generation. Utilities are scaling grid-connected solar farms co-located with batteries to capture Decreto FER-X tariff premiums, and corporate power purchase agreements are pushing commercial and industrial buyers into long-term renewable contracts. Offshore floating wind is emerging in waters deeper than 50 m where fixed foundations are not viable, and northern regions are turning to bioenergy and small hydropower to serve industrial loads. Grid congestion in the South, module import dependency, and protracted permitting remain the primary obstacles, yet declining solar equipment costs and storage incentives continue to sustain investment momentum.
Key Report Takeaways
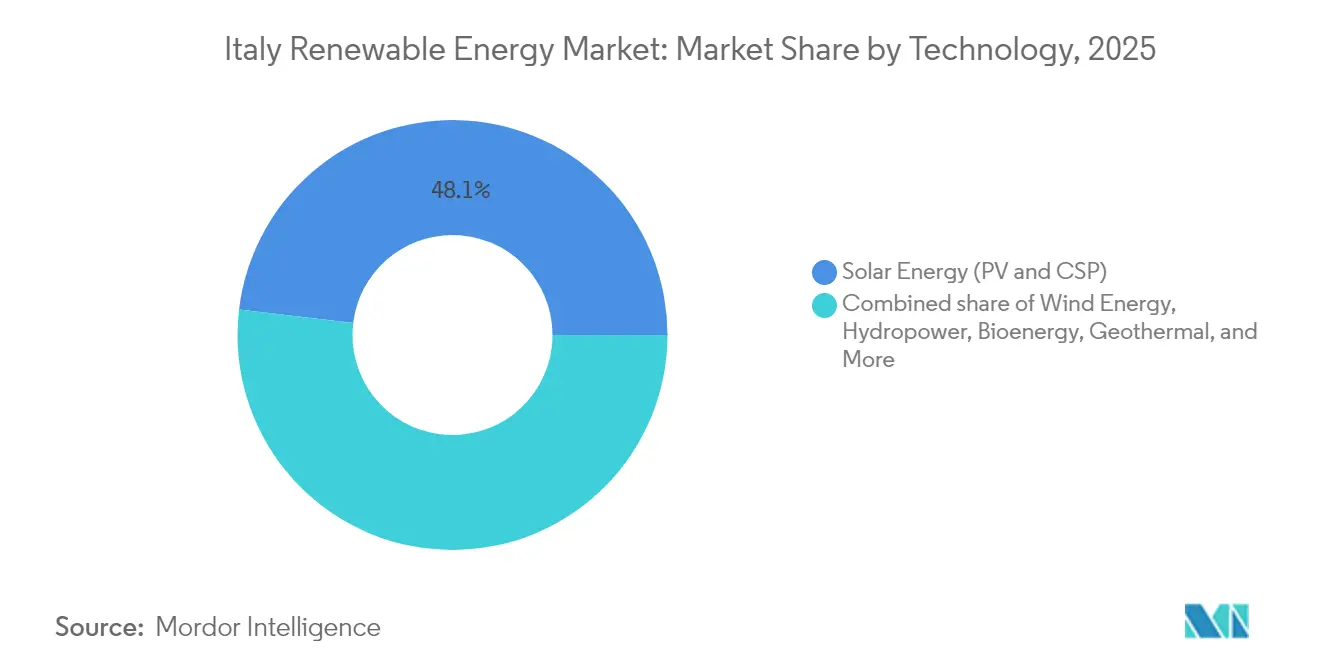
- By technology, solar energy commanded 48.10% of the Italy renewable energy market share in 2025 and is projected to post a 13.45% CAGR through 2031.
- By end-user, utilities held a 59.05% share of the Italian renewable energy market size in 2025 and are expected to advance at a 10.22% CAGR to 2031.
Note: Market size and forecast figures in this report are generated using Mordor Intelligence’s proprietary estimation framework, updated with the latest available data and insights as of 2026.
Italy Renewable Energy Market Trends and Insights
Drivers Impact Analysis*
| Driver | (~) % Impact on CAGR Forecast | Geographic Relevance | Impact Timeline |
|---|---|---|---|
| NRRP funding boost | +2.5% | Southern regions | Medium term (2-4 years) |
| EU Fit-for-55 mandate | +2.0% | National | Long term (≥ 4 years) |
| Prosumer energy communities | +1.0% | Northern regions | Medium term (2-4 years) |
| Offshore floating wind zones | +1.5% | Coastal South and Islands | Long term (≥ 4 years) |
| Storage co-location incentives | +1.2% | Grid-constrained zones | Short term (≤ 2 years) |
| Falling PV LCOE | +1.8% | High-irradiance South | Short term (≤ 2 years) |
| Source: Mordor Intelligence | |||
NRRP Funding Boost
The NRRP allocates EUR 25.36 billion directly to energy transition projects, disbursing funds through competitive auctions and concessional grants that reduce the weighted-average cost of capital for new projects. The December 2023 REPowerEU addendum adds another EUR 2.9 billion, earmarked for grid digitalization and utility-scale renewables. To date, EUR 43 billion, or 22% of the total NRRP resources, has been allocated to project sponsors, with spending expected to accelerate until the 2026 deadline as permitting reforms clear backlogs. Southern provinces and islands are prioritized because historical under-investment created transmission gaps that now coincide with Italy’s highest solar irradiation. Project developers thus gain preferential scoring in auctions when siting assets in regions with constrained economic development.[1]International Energy Agency, “Italy’s Recovery and Resilience Plan,” iea.org
EU Fit-for-55 Mandate
The Fit-for-55 package requires Italy to achieve a 40.5% renewable share in final energy consumption by 2030, equivalent to approximately 131 GW of capacity, including 80 GW of PV, reinforcing the growth trajectory of solar energy. Binding milestones extend investment horizons beyond typical project finance tenures and penalize non-compliance, ensuring aggressive build-out schedules. Because renewable electricity fuels decarbonization in heating, cooling, and transport, generators can monetize guarantees of origin and carbon prices across multiple sectors. With renewable electricity already accounting for 41% of national demand in 2024, Italy is now exploring cross-border power export contracts that leverage upcoming interconnectors to Austria and Slovenia.[2]European Parliament Research Service, “Fit-for-55 in Italy,” europarl.europa.eu
Prosumer Energy Communities
Italy’s Renewable Energy Communities (RECs) enable up to 30,000 residents to share surplus power virtually within the same primary substation. A 20-year premium of EUR 60 to 120/MWh on jointly consumed energy, plus 50% income tax deductions over 10 years, yields internal rates of return that are attractive to households and municipalities. Amendments effective in 2025 decouple membership from geographic proximity, allowing industrial users to co-optimize load with residential generation. While the North leads adoption due to higher retail tariffs and a cooperative culture, Central provinces are now streamlining permitting to attract EU social-inclusion funds tied to RECs.
Offshore Floating Wind Zones
Marine spatial planning has cleared 2.2 GW of floating-wind projects, which are necessary because Mediterranean seabed depths exceed 50 m near the shore. Early projects, such as 7 Seas Med (252 MW) and Ichnusa (504 MW), are progressing through environmental impact assessments. A tariff of EUR 185/MWh remains under review because developers argue that floating platforms increase capital costs by 30% compared to fixed-bottom turbines. Domestic engineering firms like Saipem leverage oil-and-gas experience to localize supply chains, lowering balance-of-plant costs and retaining value within Italy.[3]Saipem, “Floating Offshore Wind Projects in Italy,” saipem.com
Restraints Impact Analysis*
| Restraint | (~) % Impact on CAGR Forecast | Geographic Relevance | Impact Timeline |
|---|---|---|---|
| Permitting delays & NIMBYism | -1.50% | Tuscany, Lazio, Campania | Short term (≤ 2 years) |
| Grid congestion & curtailment | -1.20% | Sicily, Puglia, Calabria, Sardinia | Medium term (2-4 years) |
| Land-use conflict (agrivoltaic) | -0.80% | Emilia-Romagna, Veneto, Lombardy | Medium term (2-4 years) |
| Imported module dependency | -0.70% | National | Short term (≤ 2 years) |
| Source: Mordor Intelligence | |||
Permitting Delays & NIMBYism
Environmental approvals typically take 3 to 5 years, which is double the EU-recommended 24-month ceiling. Local heritage offices often require visual-impact studies, while citizen groups litigate against turbines near tourism corridors. A 2025 decree waived the environmental impact assessment requirement for PV projects below 10 MW; however, regional compliance varies, prolonging uncertainty. Courts have recently annulled blanket land-use bans, signaling a gradual improvement, but developer pipelines still carry roughly 80 GW of projects awaiting final signatures.[4]Reuters, “Italian court eases restrictions on renewables,” reuters.com
Grid Congestion & Curtailment
Solar and wind additions outpace grid reinforcement in Sicily and Sardinia. Curtailment reached 4.2% of renewable generation in 2024, resulting in negative pricing events during peak sun hours. Terna’s EUR 23 billion ten-year plan includes five new HVDC corridors, which double the South-North transfer capacity and interconnect Sicily to the mainland through the Tyrrhenian Link. Until the first pole enters service in 2028, developers must factor in discounted offtake assumptions or pair capacity with on-site storage.
*Our forecasts treat driver/restraint impacts as directional, not additive. The impact forecasts reflect baseline growth, mix effects, and variable interactions.
Segment Analysis
By Technology: Solar Dominance Reinforced by Bifacial Gains
Solar installations held 48.10% of capacity in 2025, giving them the largest slice of the Italy renewable energy market share. The segment is projected to rise at a 13.45% CAGR through 2031, supported by bifacial modules that lift output without inflating land use. Photovoltaic plants lead, while concentrated solar power remains negligible due to lower direct normal irradiance. Onshore wind provided 18.05% of the capacity, but sites in Apulia and Sicily are almost saturated, so developers are pivoting to higher-output repowering. Offshore floating wind unlocks deep-water zones and is set to add 2.1 GW by 2030. Hydropower at 21.25% of capacity, including pumped-storage hydro in the Alps, continues to stabilize frequency as intermittent assets climb.Enhanced geothermal systems, small hydro, and bioenergy round out the mix. The Italy renewable energy market size for hydropower is expected to stay largely flat, but new pumped-storage capacity will lengthen the dispatch stack. Bioenergy operators are shifting their feedstock toward agricultural waste to meet stricter EU sustainability criteria. Geothermal in Tuscany benefits from binary-cycle upgrades that tap lower-temperature reservoirs, and ocean energy remains in the pilot stage. Floating wind platforms, utilizing tension-leg and semi-submersible designs, expand the technological palette and help Italy diversify away from heavy reliance on solar energy.


By End-User: Utility-Scale Leadership Faces Prosumer Disruption
Utilities controlled 59.05% of installed capacity in 2025 and are expected to grow at a 10.22% CAGR to 2031, driven by auction allotments, brownfield coal-to-solar conversions, and integrated storage. Enel Green Power, ERG, and Edison commissioned 4.2 GW in 2024, underscoring the benefits of scale economies. Corporate procurement is accelerating in the commercial and industrial segment, which accounted for 29.35% of capacity. Multinationals inked 1.8 GW of PPAs in 2024, tripling the activity seen in 2022. Demand stems from the EU Corporate Sustainability Reporting Directive, which is driving firms toward 24/7 carbon-free electricity blocks.Residential installations accounted for 11.60% of the market in 2025, primarily due to permitting complexity and fragmented building ownership. Prosumer energy communities lower entry hurdles by pooling generation behind medium-voltage substations, stimulating peri-urban uptake. The Italy renewable energy industry faces a dual-track future in which utility-scale projects capture bulk capacity while distributed rooftops build social acceptance and grid resilience. Storage pairing gains favor across all end-user groups as curtailment and peak pricing volatility grow more acute.

Geography Analysis
Southern Italy delivered 61.35% of new capacity in 2025, thanks to an average yearly irradiance of 1,600-1,800 kWh per m² and access to deep-water sites suitable for floating wind. Sicily alone added 1.4 GW of solar capacity, buoyed by NRRP grants and the repurposing of coal plants. Curtailment, however, reached 8.3% in Sicily and 7.1% in Sardinia, prompting the fast build-out of 280 MW of batteries in Sardinia to absorb midday surpluses. Puglia is transitioning from crowded onshore wind corridors to marine platforms, with 540 MW lined up for the 2025 auction.
Northern regions contributed 24.55% of the 2025 additions by focusing on bioenergy, rooftop solar, and small hydro projects that align with industrial demand clusters. Lombardy leverages agricultural waste streams for 340 MW of bioenergy, while Piedmont hosts 1.1 GW of pumped-storage hydro that dampens frequency swings. Agrivoltaic restrictions limit the use of large ground-mount arrays, steering developers toward elevated panels over crops. Central Italy added 14.10% of capacity in 2025, anchored by Tuscany’s 620 MW geothermal fleet and Lazio’s nascent floating wind ambitions. Maritime spatial planning and heritage preservation create siting friction in these regions, delaying the development of 180 MW of proposed offshore wind projects.
The asymmetric pattern leaves resource-rich southern zones short on transmission, while the industrial north owns stronger grids but less available land. Terna’s EUR 21 billion network plan aims to bridge the gap by 2029; however, until then, project developers must factor in higher congestion risk in the southern Italy renewable energy market.
Competitive Landscape
The competitive field remains moderately concentrated. Enel Green Power leads with a EUR 43 billion plan through 2027 to add 12 GW of capacity, 30% of which pairs on-site batteries. A2A follows with EUR 22 billion earmarked for photovoltaics and network efficiency upgrades, while Plenitude targets 15 GW globally by 2030, leveraging corporate PPAs and overseas acquisitions. Domestic engineering major Saipem pivots its offshore expertise toward floating wind, co-developing a 756 MW project across Sicily and Sardinia. International developers, including GE Vernova, enter joint ventures exceeding 1 GW, importing turbine technology while relying on Italian partners for land acquisition and permitting.
Product differentiation focuses on hybridization, with players adding storage, green hydrogen, or agrivoltaic elements to distinguish bids in crowded auctions. Financing innovation also matters: merchant solar farms secure 10-year hedging contracts with investment-grade offtakers, reducing exposure to cannibalization in midday hours. Medium-sized developers often sell shovel-ready projects to utilities, monetizing early-stage risk management skills. Regulatory complexity in the Italian renewable energy market shields incumbents yet encourages consolidation as EU taxonomy rules favor large balance sheets that can document sustainability performance.
Demand for local content shapes supply-chain strategies. An NRRP-funded incentive top-up launched in January 2025 rewards PV arrays that use EU-made modules, prompting Enel’s 3 GW panel factory in Sicily to expand capacity. Meanwhile, transmission operator Terna invests in grid-forming inverters, awarding multi-year contracts to technology providers that guarantee dynamic stability. The Italian renewable energy market, therefore, balances scale advantages with niche specialization, suggesting moderate concentration but room for disruptive entrants to drive cost or technology breakthroughs.
Italy Renewable Energy Industry Leaders
Enel Green Power SpA
ERG SpA
EF Solare Italia SpA
Falck Renewables (Renantis) SpA
A2A Rinnovabili SpA
- *Disclaimer: Major Players sorted in no particular order

Recent Industry Developments
- March 2025: Saipem and Divento partnered on 756 MW of floating wind off Sicily and Sardinia, leveraging offshore engineering capabilities.
- February 2025: The government issued the Transitional FER-X Decree, directing EUR 490 million annually to support approximately 17 GW of new capacity until a permanent auction framework is in place.
- December 2024: Italian state railways have committed EUR 1.3 billion to on-site solar energy, illustrating the momentum behind cross-sector decarbonization.
- December 2024: RWE has inaugurated one of its largest onshore wind farms in Italy. The San Severo wind farm, boasting a capacity of 54 megawatts (MW), is equipped with 12 turbines, each rated at 4.5 MW. Situated in the municipality of San Severo, within the province of Foggia, this wind farm is set to provide green electricity to approximately 55,000 households across Italy.


Italy Renewable Energy Market Report Scope
The Italian renewable energy market report includes:
By Technology
| Solar Energy (PV and CSP) |
| Wind Energy (Onshore and Offshore) |
| Hydropower (Small, Large, PSH) |
| Bioenergy |
| Geothermal |
| Ocean Energy (Tidal and Wave) |
By End-User
| Utilities |
| Commercial and Industrial |
| Residential |
| By Technology | Solar Energy (PV and CSP) |
| Wind Energy (Onshore and Offshore) | |
| Hydropower (Small, Large, PSH) | |
| Bioenergy | |
| Geothermal | |
| Ocean Energy (Tidal and Wave) | |
| By End-User | Utilities |
| Commercial and Industrial | |
| Residential |


Key Questions Answered in the Report
How large is the Italy renewable energy market in 2026?
Installed capacity stands at 90.82 GW, and targets point to 138.09 GW by 2031.
What is the main growth driver for new projects?
National Recovery and Resilience Plan grants paired with EU Fit-for-55 mandates create stable revenue pathways that accelerate build-outs.
Which technology leads capacity additions?
Solar power dominates with 48.10% share in 2025 and a 13.45% projected CAGR through 2031.
Why is floating wind important for Italy?
Deep Mediterranean waters preclude fixed foundations, so floating turbines open new zones and diversify resource supply.
How are utilities coping with grid congestion in the South?
They co-locate batteries with solar farms to store midday peaks and qualify for Decreto FER-X premiums.
What limits rooftop solar progress?
Lengthy permitting, condominium ownership complexity, and fragmented distribution grid standards extend installation timelines and raise costs.
Page last updated on:


