
Monoclonal Antibody Therapeutics Market Size and Share
Market Overview
| Study Period | 2020 - 2031 |
|---|---|
| Market Size (2026) | USD 326.38 Billion |
| Market Size (2031) | USD 619.38 Billion |
| Growth Rate (2026 - 2031) | 13.67 % |
| Fastest Growing Market | Asia-Pacific |
| Largest Market | North America |
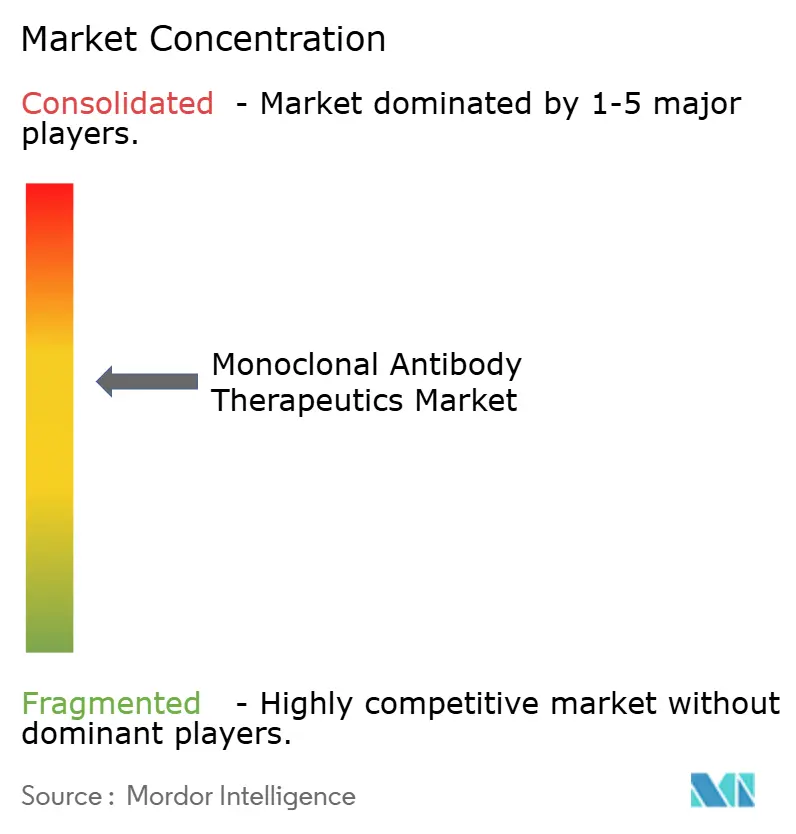
| Market Concentration | Medium |
Major Players *Disclaimer: Major Players sorted in no particular order Image © Mordor Intelligence. Reuse requires attribution under CC BY 4.0. | |

Monoclonal Antibody Therapeutics Market Analysis by Mordor Intelligence
The Monoclonal Antibody Therapeutics Market size is expected to increase from USD 287.13 billion in 2025 to USD 326.38 billion in 2026 and reach USD 619.38 billion by 2031, growing at a CAGR of 13.67% over 2026-2031.
Investment is shifting toward precision biologics that displace broad-spectrum small molecules, while multi-target constructs reach patients faster under accelerated review routes. Providers see clinical and economic value in home-administration formats that cut hospital days and lower readmission penalties. Sustained biosimilar pressure means innovators hedge with antibody-drug conjugates that defend premium price bands. Production footprints are also consolidating in Asia-Pacific, where new capacity trims per-gram cost to under USD 120, opening large addressable pools.
Key Report Takeaways
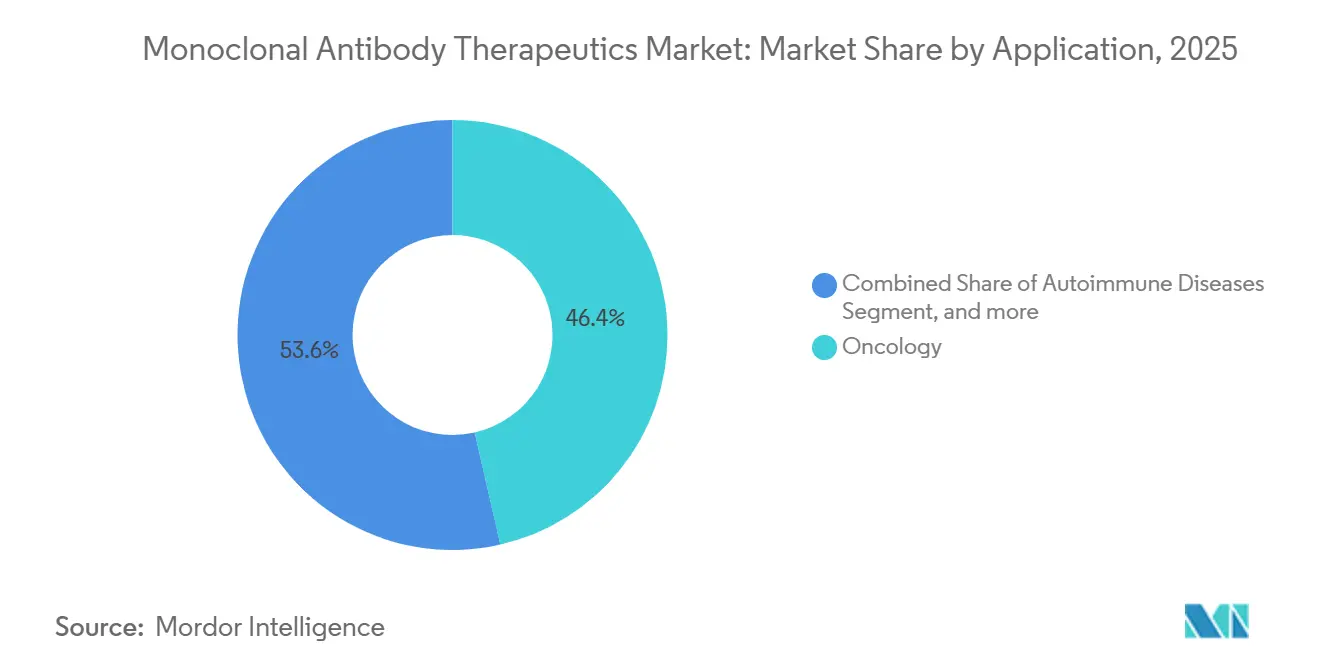
- By application, oncology led with 46.43% revenue in 2025, while infectious diseases are forecast to climb at 15.76% CAGR through 2031.
- By source, humanized antibodies held a 49.54% share in 2025, yet bispecific formats are set to advance at a 15.89% CAGR to 2031.
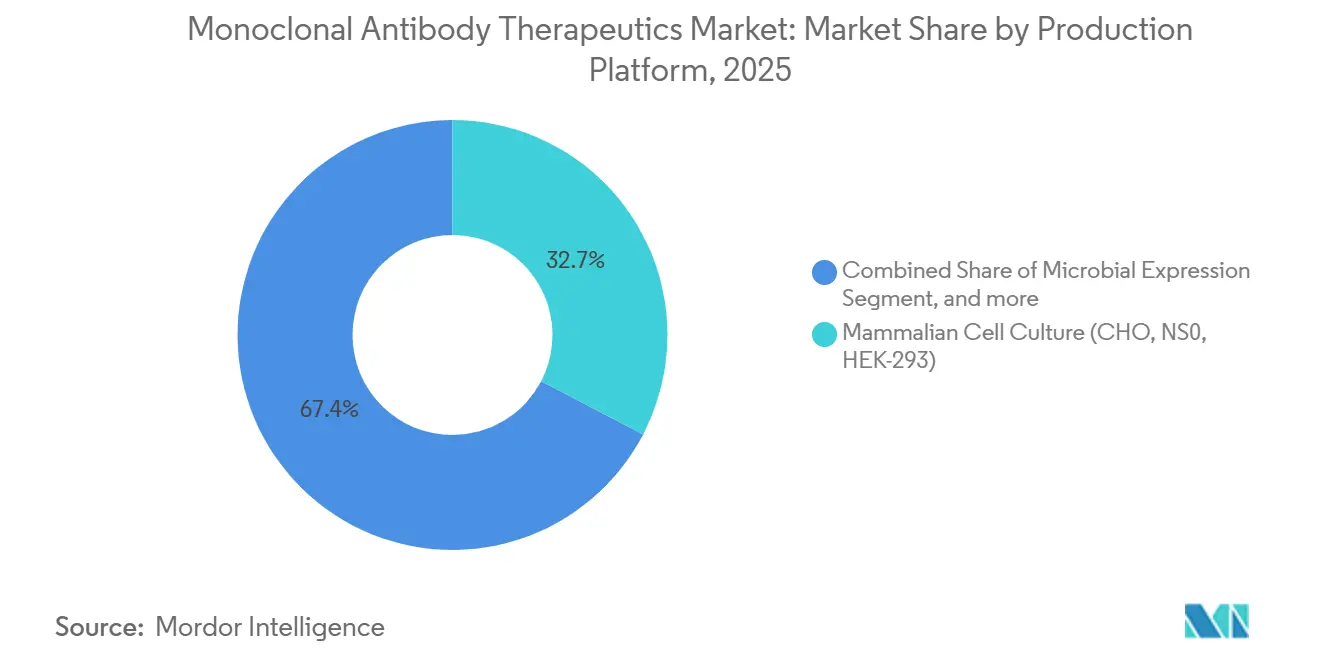
- By production platform, mammalian cell culture accounted for 32.65% of the 2025 base, whereas transgenic systems are projected to post a 15.32% CAGR over the outlook.
- By end user, hospitals accounted for 62.65% of 2025 spending, but home-care channels are growing at a 16.43% CAGR through 2031.
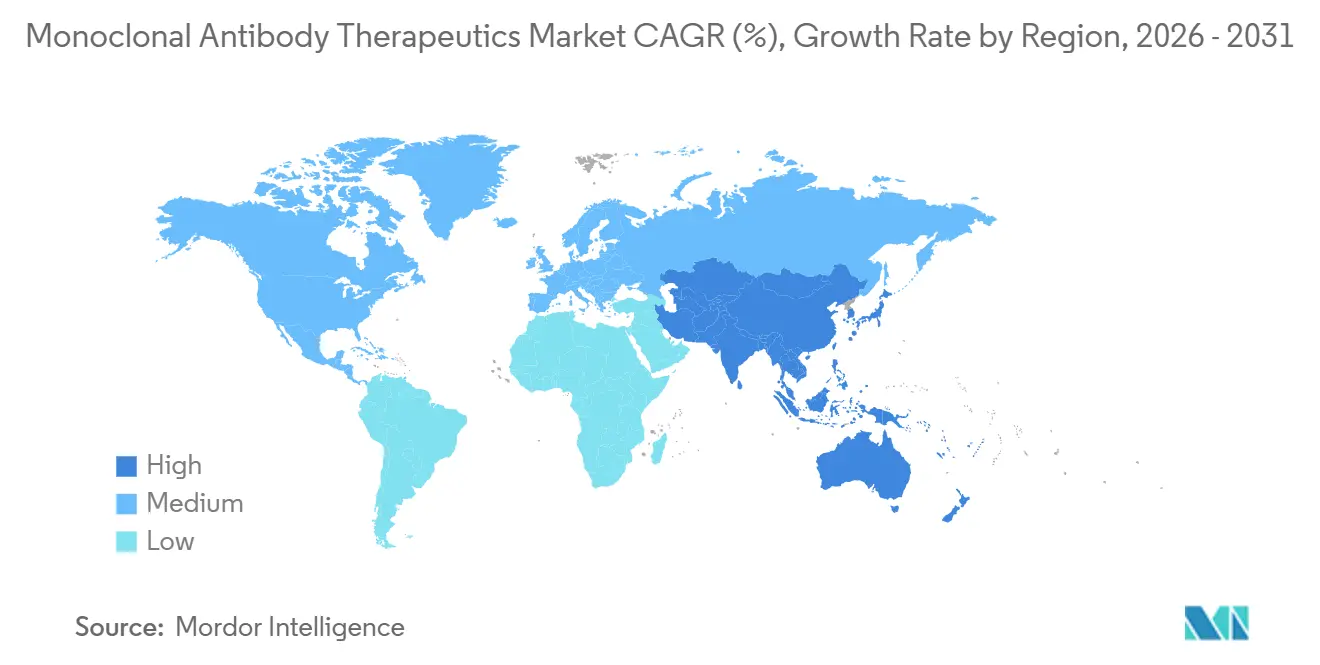
- By geography, North America captured the largest share at 42.76% in 2025, and Asia-Pacific is anticipated to deliver the fastest 14.65% CAGR through 2031.
Note: Market size and forecast figures in this report are generated using Mordor Intelligence’s proprietary estimation framework, updated with the latest available data and insights as of 2026.
Global Monoclonal Antibody Therapeutics Market Trends and Insights
Drivers Impact Analysis*
| Driver | (~) % Impact on CAGR Forecast | Geographic Relevance | Impact Timeline |
|---|---|---|---|
| Rising Global Disease Burden of Cancer and Autoimmune Disorders | +2.8% | Global, with peak incidence in North America and Europe | Long term (≥ 4 years) |
| Expanding Geriatric Population Base | +2.1% | Global, concentrated in Japan, Germany, Italy, South Korea | Long term (≥ 4 years) |
| Accelerated Regulatory Approval Pathways for Biologics | +2.3% | North America, Europe, APAC (China, Japan) | Medium term (2-4 years) |
| Increasing Preference for Targeted Therapies Over Small Molecules | +2.5% | Global, led by North America and Europe | Medium term (2-4 years) |
| Advancements in Antibody Engineering and Delivery Technologies | +2.0% | Global, R&D concentrated in North America, Europe, China | Medium term (2-4 years) |
| Growing Biologics Manufacturing Capacity in Emerging Markets | +1.8% | APAC core (China, India, South Korea), spill-over to MEA | Short term (≤ 2 years) |
| Source: Mordor Intelligence | |||
Rising Global Disease Burden of Cancer and Autoimmune Disorders
Cancer incidence grew to 20 million new cases in 2024, and autoimmune diagnoses now top 80 million worldwide. Eight novel oncology antibodies cleared the U.S. market in 2025, cementing multi-step sequencing that extends survival but raises per-patient costs. Standard regimens now rely on PD-1, PD-L1, and TNF-alpha blockade that outranks historical chemotherapy in efficacy and tolerability. Autoimmune care follows a similar arc as IL-23 inhibitors, with eight-week dosing to lift adherence among chronic patients. Given this macro backdrop, the monoclonal antibody therapeutics market continues to scale through volume expansion, even before price effects are factored in.
Expanding Geriatric Population Base
Individuals aged 65 and above will represent 22% of global citizens by 2030[1]United Nations, “World Population Prospects 2025,” un.org. Older cohorts carry a higher prevalence of cancers, immune disorders, and age-related ophthalmic conditions that rely on biologic modulation. Medicare spending on infused antibodies reached USD 48 billion in 2025, despite emerging price controls, showing double-digit growth. Convenience remains paramount; subcutaneous versions of legacy infusions achieved 35% penetration among osteoporosis patients aged 70+ within 18 months. The demographic swell safeguards demand for the monoclonal antibody therapeutics market even if unit prices face negotiated reductions.
Accelerated Regulatory Approval Pathways for Biologics
Fourteen antibodies received U.S. breakthrough or accelerated tags in 2025, slashing the median review time to 6.5 months. Europe and China mirror the velocity, cutting queues to under 200 days for qualifying submissions. Sponsors gain an early-mover benefit that locks in a 60% share before rivals appear, and revenue accrues during confirmatory study windows. However, three agents lost approval when their survival data fell short, illustrating the calculated risk developers accept. Speed to shelf, therefore, remains a two-edged sword within the monoclonal antibody therapeutics market.
Increasing Preference for Targeted Therapies Over Small Molecules
A 2025 ASCO survey found that 68% of U.S. oncologists now select checkpoint inhibitors first-line for metastatic melanoma. Payers reinforce that tilt by slotting leading antibodies in preferred tiers while raising copays for older chemotherapies. Autoimmune prescribers adopt a similar hierarchy, with IL-17 and IL-23 agents displacing methotrexate in newly diagnosed patients. Once clinicians observe durable remission with biologics, therapeutic inertia favors continuation, even amid biosimilar entry that cuts prices by 40%. That clinical confidence anchors long-term volume for the monoclonal antibody therapeutics market.
Restraints Impact Analysis*
| Restraint | (~) % Impact on CAGR Forecast | Geographic Relevance | Impact Timeline |
|---|---|---|---|
| High Treatment Costs and Reimbursement Challenges | -1.9% | Global, acute in Europe and emerging markets with constrained budgets | Medium term (2-4 years) |
| Complex Manufacturing and Supply Chain Requirements | -1.2% | Global, bottlenecks in North America and Europe | Short term (≤ 2 years) |
| Safety Concerns and Adverse Event Profiles | -0.8% | Global, heightened scrutiny in North America and Europe | Medium term (2-4 years) |
| Intensifying Biosimilar Competition Post-Patent Expiries | -1.5% | North America, Europe, APAC | Medium term (2-4 years) |
| Source: Mordor Intelligence | |||
High Treatment Costs and Reimbursement Challenges
Wholesale prices run from USD 80,000 to USD 250,000 per course, and Germany cut oncology antibody reference prices by 22% in 2025[2]Gemeinsamer Bundesausschuss, “Benefit Assessment Decisions Q4 2025,” g-ba.de. The U.S. Inflation Reduction Act placed three antibodies into negotiation for 2026 rebates that can slice 40% off list, trimming manufacturer yield. Emerging economies apply even harsher caps which dilute multinational revenue but boost local access. To safeguard gross margin, firms lean on value-based contracts that refund payers if endpoints falter. Successful real-world datasets become crucial evidence as stakeholders scrutinize budget impact.
Complex Manufacturing and Supply Chain Requirements
Campaigns last up to 21 days, and contamination at any step forces multi-month shutdowns, as seen with a Swiss facility outage in 2025. Three suppliers control most media inputs, allowing an 18% price rise that added USD 25,000 per kilogram to the cost of goods. Cold-chain mishaps spoiled USD 12 million of finished inventory after a mid-2025 logistics outage. Regulatory bodies issued 38% more citations in 2025, underscoring that cGMP compliance is not optional. These realities limit immediate scale and drive cost inflation in the monoclonal antibody therapeutics market.
*Our forecasts treat driver/restraint impacts as directional, not additive. The impact forecasts reflect baseline growth, mix effects, and variable interactions.
Segment Analysis
By Application: Infectious Diseases Outpace Oncology Growth
Oncology accounted for 46.43% of 2025 revenue, yet infectious diseases are forecast to have the fastest 15.76% CAGR, driven by state stockpiles and pandemic insurance programs. The monoclonal antibody therapeutics market size for infectious applications is slated to swell as BARDA awards exceed USD 1.2 billion for pre-purchase of respiratory virus countermeasures. Government procurement secures volumes independent of insurer dynamics, giving newcomers a dependable launchpad.
Oncology still grows due to widening eligibility of checkpoint inhibition, but saturation in mature tumors tempers the pace. Autoimmune conditions add stable repeat dosing, while ophthalmology slows as extended-interval injectables limit vial turns. Neurology remains small today, yet gains mindshare with disease-modifying success in Alzheimer’s. Each subfield illustrates the broadening canvas that propels the monoclonal antibody therapeutics market.



By Source: Bispecific Formats Redefine Treatment Paradigms
Humanized antibodies delivered 49.54% of 2025 sales and stay prominent due to low immunogenicity and known processes. Still, bispecific constructs, though only 8% today, book a rapid 15.89% CAGR. Their dual-target action bypasses resistance, and early launches already seize share in refractory hematologic lines. The monoclonal antibody therapeutics market share for bispecifics is set to widen as 62% of Phase I entrants now carry multi-specific geometry.
Chimeric products lose steam under biosimilar assault, while fully human antibodies defend blockbuster franchises like pembrolizumab. Murine assets fall to niche imaging use where single-dose exposure sidesteps immune buildup. The shift forces manufacturing innovation, since only fifteen global sites can assemble heterodimers at scale, giving incumbents a supply advantage.
By Production Platform: Transgenic Systems Gain Traction
Mammalian cell culture remained the workhorse at 32.65% of 2025 output, prized for authentic glycosylation. Transgenic animals and plants will, however, post 15.32% CAGR because they cut capex and align with low-income disease targets. The monoclonal antibody therapeutics market size generated by these platforms increases as regulatory agencies approve plant-derived products that meet current quality guidance.
Microbial and cell-free systems cater to fragments lacking glycans and serve exploratory pipelines that need rapid milligram lots. Continuous bioprocess pilots show 70% footprint savings and hint at decentralized manufacturing near demand loci. Together, platform pluralism diversifies risk and expands supply flexibility for the monoclonal antibody therapeutics market.
By End User: Home-Care Channels Reshape Delivery Models
Hospitals still absorb 62.65% of 2025 spending because many agents need crash-cart support during the first infusions. Home self-injection channels, though currently at only 9%, will expand at a 16.43% CAGR. Payers reward migration away from inpatient care, and subcutaneous launches feature patient-friendly applicators vetted through human factors guidance. The monoclonal antibody therapeutics market size is driven by home care, as specialty pharmacies coordinate cold-chain drops directly to users.
Specialty clinics bridge the hospital and home through initial monitoring, while academic hubs consume investigational supply. Digital adherence tools track dose timing and feeding, and trigger value-based payment refunds for unmet outcomes. These dynamics align all stakeholders toward decentralized delivery.
Geography Analysis
North America commanded 42.76% of 2025 revenue, benefiting from Medicare co-insurance coverage and a dense trial network. Yet the Inflation Reduction Act introduces managed pricing from 2026, tightening net yields though not likely dampening volume. Canada negotiated 18% to 25% cuts that widened provincial access, and Mexico listed six oncology antibodies on its public formulary, albeit with lower per-capita utilization.
Asia-Pacific is the standout growth engine at 14.65% CAGR. China approved eleven novel antibodies in 2025 and pooled them into the national reimbursement list that covers 1.3 billion residents. India’s low-cost CDMO build-out combines with export-friendly regulation, letting local firms capture value from biosimilar orders across emerging regions. South Korea’s capacity surge rounds out a regional manufacturing corridor that underpins the monoclonal antibody therapeutics market.
Europe accounted for 28% of 2025 turnover. Health technology assessments in Germany, France, and the UK force manufacturers to meet strict cost-effectiveness thresholds, prompting 22% average price cuts on select oncology agents. Automatic substitution rules fast-track biosimilar share near 50% within a year of launch. Despite these headwinds, Western Europe remains central for early launches that cascade to global uptake once national payers conclude negotiations.

Regulatory Landscape
Regulation of monoclonal antibody (mAb) therapeutics centers on biologics quality, comparability, and pharmacovigilance, with major regulators using accelerated and conditional pathways alongside stricter post-approval obligations. In the United States, the FDA published draft guidance, "Monoclonal Antibodies: Streamlined Nonclinical Safety Studies" (December 2025), indicating greater use of weight-of-evidence and analytical characterization to limit redundant animal testing for certain mAb programs, while keeping expectations for robust CMC and clinical safety packages.
In Europe, the EMA and European Commission continue to expand biosimilar and novel mAb access through centralized approvals. This has intensified competition and pushed manufacturers to generate interchangeability-relevant data and demonstrate supply reliability. Examples include EMA marketing authorizations for Exdensur (February 2026) and Tuyory, a tocilizumab biosimilar (April 2026). Globally, standard-setting bodies such as the WHO Expert Committee on Biological Standardization (ECBS) reinforce common measurement standards and quality expectations for biologicals, supporting cross-market alignment for assays, reference standards, and lot-release practices.
Value Chain Analysis
The value chain covers target discovery and antibody engineering, cell line and process development, GMP drug substance production (often in CHO-based mammalian culture), downstream purification, fill-finish, cold-chain distribution, and administration through hospitals, specialty clinics, and growing home-care channels. Critical inputs such as cell-culture media and certain single-use components are concentrated among a small supplier base, and the market has already shown fragility from manufacturing disruptions (for example, facility outages) and cold-chain failures that can spoil finished inventory and delay patient access.
Manufacturing and quality oversight shape throughput and cost across the chain, particularly for complex formats (bispecifics and some next-generation constructs) and high-concentration subcutaneous formulations that increase viscosity and aggregation risks during ultrafiltration and fill-finish. In the United States, FDA facility oversight for CDER-regulated biological products is being reinforced through formal inspection frameworks, increasing the operational premium on data integrity and cGMP execution for both innovators and CDMOs. On the capacity side, Asia-Pacific continues to attract investment in large-scale bioreactor footprints, supporting regional manufacturing hubs and greater reliance on specialized CDMOs for platform processes, tech transfer, and scale-up.
Competitive Landscape
Top players Roche, AbbVie, Merck, Bristol Myers Squibb, and Johnson & Johnson together held 52% of global revenue in 2025. Their lead stems from proven franchises, but it is narrowing as regional innovators capture domestic share at lower list prices. Incumbents invest heavily in bispecific T-cell engagers and antibody-drug conjugates that offer fresh exclusivity and defend brand equity even after core patents expire.
Strategy now blends vertical supply acquisition with digital discovery engines that compress design cycles. Roche committed USD 2.8 billion to new bioreactors in California to shore up captive capacity and trim external fees. Samsung Bioepis and other biosimilar specialists accelerate erosion of incumbents’ margins, yet the monoclonal antibody therapeutics market overall expands as biosimilars democratize access and grow the total treated population.
Regulatory quality remains a moat. Eleven FDA warning letters in 2025 illustrate how lapses can derail output for months. Companies with strong data-integrity cultures maintain customer trust and keep pharmacy shelves stocked reliably. Competitive footing, therefore, rests on both scientific novelty and unbroken compliance discipline.
Monoclonal Antibody Therapeutics Industry Leaders
Daiichi Sankyo Company Limited
Johnson & Johnson
Abbvie Inc
Amgen Inc
UCB S.A., Belgium (UCB Inc)
- *Disclaimer: Major Players sorted in no particular order

Market Opportunities and Future Outlook
Product lifecycle strategies that improve convenience and site-of-care economics create near-term whitespace, especially through subcutaneous reformulations and device-enabled delivery that reduce chair time and staffing burden. A concrete proof point is the FDA approval of Sanofi's subcutaneous Sarclisa (isatuximab-irfc) Escena in July 2026 using an on-body injector, which reinforces the commercial value of differentiated administration for established oncology antibodies. Home-care and self-administration expansion also increases demand for high-concentration formulations, human factors validation, and specialty pharmacy-enabled cold-chain distribution.
Manufacturing localization and scale additions in Asia-Pacific create opportunities for both biosimilar players and innovators to secure drug substance supply, shorten lead times, and compete on total cost of goods. Celltrion's March 2026 announcement of a KRW 1.2 trillion investment to expand drug substance capacity in Songdo by 180,000 liters (to 570,000 liters total internal capacity) illustrates the continued build-out of large hubs that can support multi-product portfolios and export supply. Process intensification and continuous bioprocess development also represent opportunity areas, as firms pursue higher titers, improved consistency, and faster changeovers to accommodate broader pipelines that include bispecifics and antibody-drug conjugates.
Recent Industry Developments
- July 2026: AbbVie announced that the European Commission approved TEPKINLY (epcoritamab) in combination with lenalidomide and rituximab for relapsed or refractory follicular lymphoma. The decision expands access to a CD20xCD3 bispecific-based regimen in a major market and strengthens AbbVie's position in hematologic oncology where multi-specific antibodies are gaining share.
- November 2025: AbbVie reported that the US FDA approved EPKINLY (epcoritamab-bysp) in combination with rituximab and lenalidomide for relapsed or refractory follicular lymphoma. The approval supports broader adoption of off-the-shelf T-cell engaging antibodies and raises competitive pressure on incumbent lymphoma regimens by moving combination use into later-line practice.
- March 2024: AbbVie announced full US FDA approval for ELAHERE (mirvetuximab soravtansine-gynx) for certain ovarian cancer patients. Converting to full approval underscores the maturing regulatory path for antibody-drug conjugates and reinforces investment into targeted antibody payload platforms within oncology portfolios.


Research Methodology Framework and Report Scope
Market Definition and Coverage
This market is defined as the annual revenue generated from monoclonal antibody based therapeutic drugs used to prevent, treat, or manage diseases across inpatient and outpatient care, measured at manufacturer level sales value in USD across major regions.
Scope exclusions: Diagnostic antibodies, research-use-only reagents, and contract manufacturing services are excluded when they are sold as services rather than finished therapeutic products.
Segmentation Overview
- By Application
- Oncology
- Autoimmune Diseases
- Hematological Diseases
- Infectious Diseases
- Ophthalmology
- Neurology
- Other Applications
- By Source
- Human
- Humanized
- Chimeric
- Murine
- Bispecific / Multispecific
- By Production Platform
- Mammalian Cell Culture (CHO, NS0, HEK-293)
- Microbial Expression (E. Coli, Yeast)
- Transgenic Animals & Plants
- Cell-Free / Continuous Manufacturing
- By End-User
- Hospitals
- Specialty Clinics
- Home-Care / Self-Administration
- Research & Academic Institutes
- Geography
- North America
- United States
- Canada
- Mexico
- Europe
- Germany
- United Kingdom
- France
- Italy
- Spain
- Rest of Europe
- Asia-Pacific
- China
- Japan
- India
- Australia
- South Korea
- Rest of Asia-Pacific
- Middle East & Africa
- GCC
- South Africa
- Rest of Middle East & Africa
- South America
- Brazil
- Argentina
- Rest of South America
- North America
Data Sources, Market Sizing, and Validation
Desk Research
Desk work starts by building the disease and treatment context, then moves into a pricing and access view for the main geographies. Public sources, such as the US FDA biologics approvals and safety labels, the US National Institutes of Health clinical trial registry, the World Health Organization disease and health system datasets, and the World Bank macro indicators, are used to anchor what gets commercialized and where demand can form.
We also review sources such as OECD health statistics, national reimbursement and payer publications, peer reviewed journals covering biologics utilization and biosimilar adoption, plus company filings and investor decks for revenue splits and therapy area exposure. Where needed, paid subscriptions for company financials and intelligence are used to standardize reported revenues, and a patent database is used to track innovation intensity and timing (for example, biosimilar and next wave antibody formats). This list is not exhaustive, and many other public sources were used for data collection, cross-checking, and clarification.
Primary Interviews and Surveys
Primary work is used to pressure test the model inputs that typically vary by therapy area and region, such as average treatment duration, access restrictions, and expected net price movement after rebates and tenders. We speak with a mix of manufacturers, distributors, hospital pharmacy stakeholders, clinicians, and reimbursement focused experts across APAC, EMEA, and the Americas to confirm secondary signals, close gaps, and adjust assumptions when field reality differs from desk estimates.
Distribution of primary research fieldwork respondents
| Company type | Respondent position | Region |
|---|---|---|
| Top tier: 36% | CXOs: 14% | APAC: 44% |
| Mid tier: 45% | Functional/Unit leaders: 36% | EMEA: 37% |
| Smaller Players: 19% | Managers: 50% | Americas: 19% |
Market-Sizing & Forecasting
The sizing starts with a top-down demand pool build where treated patients are approximated by major indications and then translated into value using typical dosing, cycles, and an average net price by region. Results are reconciled against revenue disclosures and therapy area mixes.
To keep totals realistic, selective bottom-up approximations are used as a check, such as sampled product level sales patterns from public filings, channel feedback on mix shifts, and volume times ASP sanity tests in high use indications.
Key inputs used in the model include biologics approval and launch timing, biosimilar entry and adoption pace, share of hospital versus specialty clinic use, reimbursement coverage breadth, and region level net price pressure from tenders and negotiated discounts. Where country level data is thin, we use proxy markets with similar access conditions and then scale by population, diagnosis rates, and healthcare spend signals.
Forecasts are built using scenario analysis supported by simple regression style relationships between demand drivers and historical growth. These are then aligned to expert expectations on upcoming launches and biosimilar waves. Assumptions are kept explicit so a reader can trace each step from patient pool to volume to value without relying on hidden datasets.
Data Validation & Update Cycle
Outputs are validated through several checks, including year over year growth reasonableness by region, implied patient and vial consumption logic, and price movement consistency with published policy changes. When a number looks off, we re-check the inputs, revisit secondary documents, and re-contact relevant experts to confirm whether the change is real or a modeling artifact.
Before sign-off, the model and narrative go through multi-step internal review so inconsistencies across sections are caught and corrected. Reports are refreshed annually, and interim updates are made when material events occur, such as major approvals, large reimbursement changes, or unusual price resets. Right before delivery, a final pass is performed so the latest public signals are reflected in the estimates.
Mordor Intelligence's Monoclonal Antibody Therapeutics Market Size Versus Other Published Estimates
Published market sizes for monoclonal antibody therapeutics often vary, even when the topic name looks the same. The differences usually come from what is counted as a therapeutic monoclonal antibody, how net pricing is treated versus list pricing, what year is used as the base, and how quickly assumptions are refreshed.
The main gap comes from whether adjacent modalities are folded in. In the scope for Mordor Intelligence, monoclonal antibody therapeutics are counted as drug revenues, while antibody drug conjugates and other linked biologic formats are kept out unless they are explicitly sold and classified as mAb therapies in the addressed scope. Other variation drivers include aggressive versus conservative uptake curves for biosimilars, different handling of rebates and tender discounts across regions, and the choice of currency conversion timing when multi-country revenues are normalized.
Benchmark comparison
| Source | Market Size | Gaps in Research Methodology |
|---|---|---|
| Mordor Intelligence | USD 287.13 B (2025) | |
| Trade Publisher A | USD 293.92 B (2025) | Includes adjacent antibody-linked formats (such as antibody drug conjugates) and uses broader distribution-channel coverage, which can lift the counted revenue pool versus a therapy-only cut. |
| Healthcare Insights B | USD 265.17 B (2024) | Uses an earlier base year and a different price basis, and it appears to rely on faster long-term growth assumptions that are not always reconciled to region-level access limits and net price pressure. |
The spread across the three figures is mainly explained by scope edges and price treatment, not by a disagreement that demand is growing. When the counted products are kept consistent and the net price logic is checked against access conditions, the outcome becomes easier to reproduce and defend in planning discussions.


Key Questions Answered in the Report
What is the 2031 revenue forecast for the monoclonal antibody therapeutics market?
The market is expected to reach USD 619.4 billion by 2031, reflecting a CAGR of 13.7% from 2026.
Which therapeutic area is expected to grow fastest within monoclonal antibodies?
Infectious diseases are projected to expand at a 15.76% CAGR-driven by government stockpiling and emerging pathogen threats.
How will home administration affect spending on monoclonal antibodies?
Subcutaneous and autoinjector formats that support home care are growing at 16.43% CAGR, shifting costs away from hospitals and expanding patient access.
Which region will deliver the highest growth rate through 2031?
Asia-Pacific is set to advance at 14.65% CAGR as China, India, and South Korea build capacity and widen reimbursement.
What competitive strategies are innovators using to offset biosimilar erosion?
Companies invest in antibody-drug conjugates, bispecific T-cell engagers, and vertical manufacturing integration to sustain pricing power and ensure reliable supply.
How concentrated is the supplier base for critical raw materials?
Three vendors control roughly 72% of cell-culture media, contributing to cost inflation and supply vulnerability for biologic manufacturers.
Page last updated on:


 Your data is secure and never sold or shared.


