
3D Cell Culture Market Size and Share
Market Overview
| Study Period | 2020 - 2031 |
|---|---|
| Market Size (2026) | USD 2.67 Billion |
| Market Size (2031) | USD 5.37 Billion |
| Growth Rate (2026 - 2031) | 15.02% CAGR |
| Fastest Growing Market | Asia-Pacific |
| Largest Market | North America |
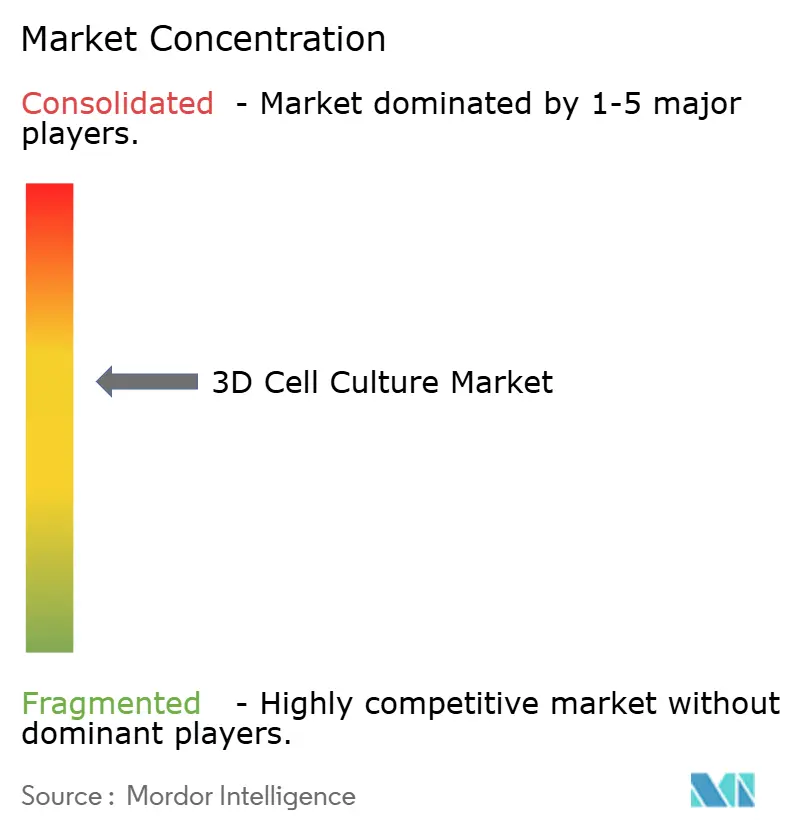
| Market Concentration | Medium |
Major Players *Disclaimer: Major Players sorted in no particular order Image © Mordor Intelligence. Reuse requires attribution under CC BY 4.0. | |
3D Cell Culture Market Analysis by Mordor Intelligence
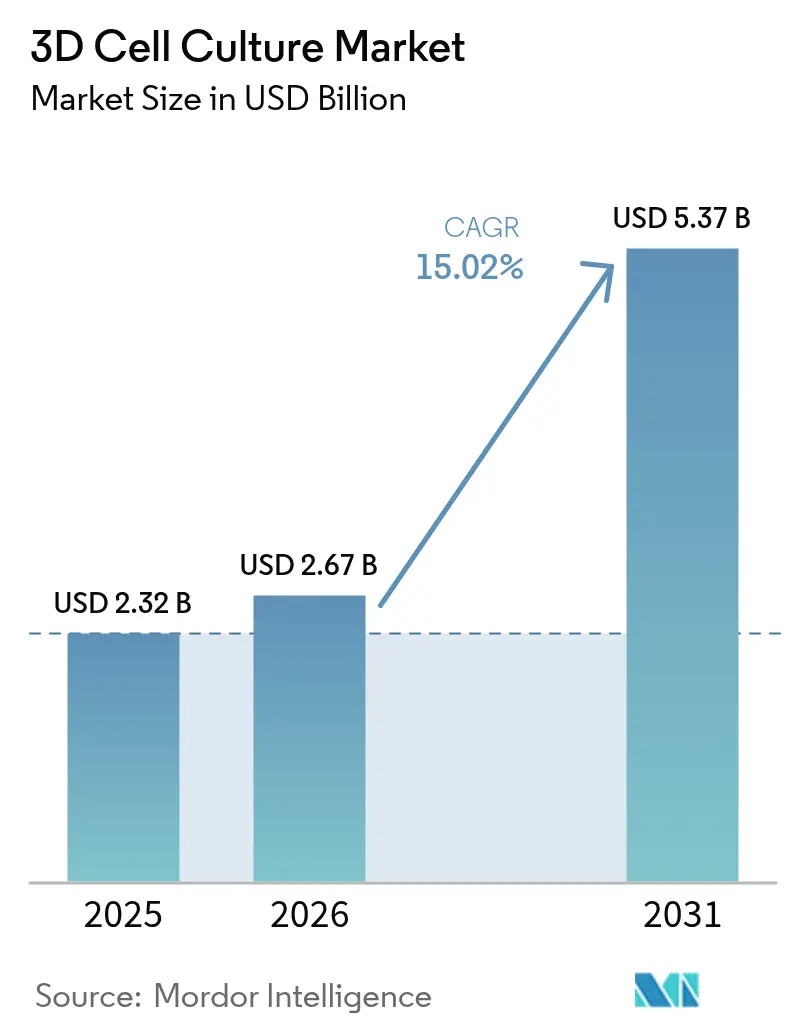
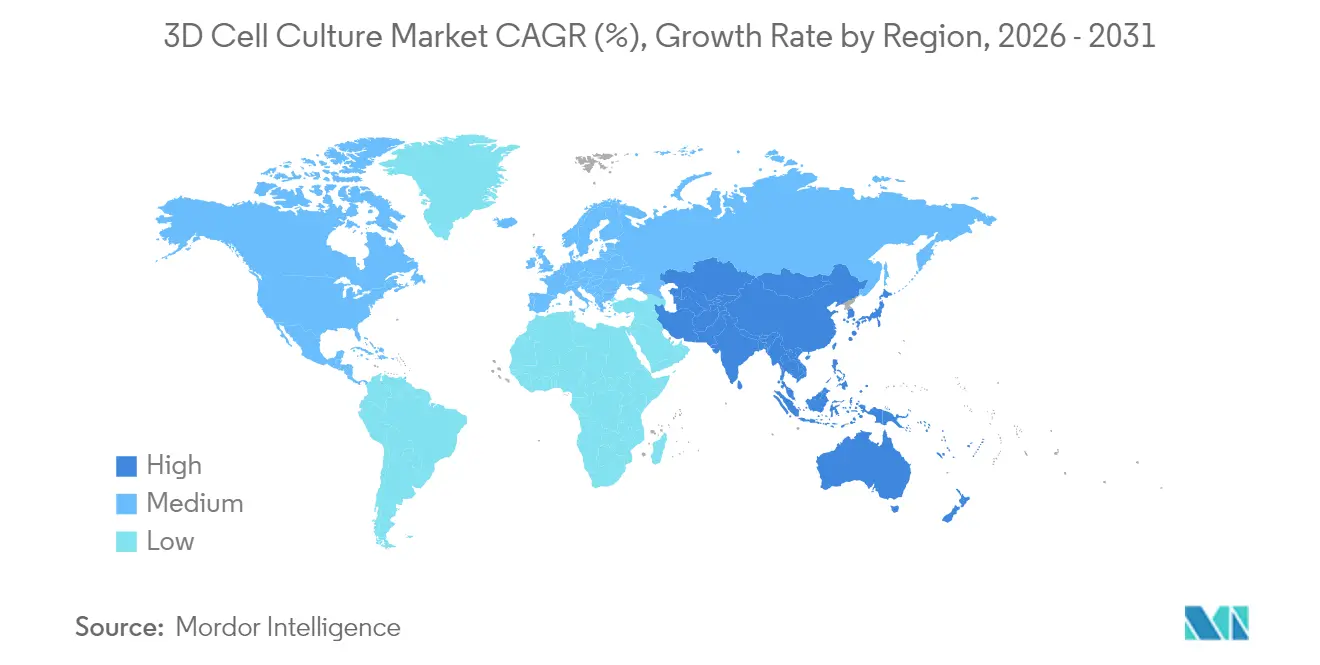
3D cell culture market size in 2026 is estimated at USD 2.67 billion, growing from 2025 value of USD 2.32 billion with 2031 projections showing USD 5.37 billion, growing at 15.02% CAGR over 2026-2031. North America sustains leadership because of deep pharmaceutical pipelines, abundant venture funding and FDA encouragement of non-animal assays. Asia-Pacific shows the steepest trajectory as governments embed biotechnology in national industrial policies and expand translational medicine clusters. Scaffold-based formats still dominate because of turnkey protocols, yet microfluidic organ-on-chip devices are scaling fastest as they reproduce tissue-tissue crosstalk and flow-driven shear essential for reliable toxicity screening. Artificial-intelligence add-ons that automate image analytics and multi-omics readouts are turning 3D culture systems into high-content discovery engines, closing historic data gaps between bench and clinic.
Key Report Takeaways
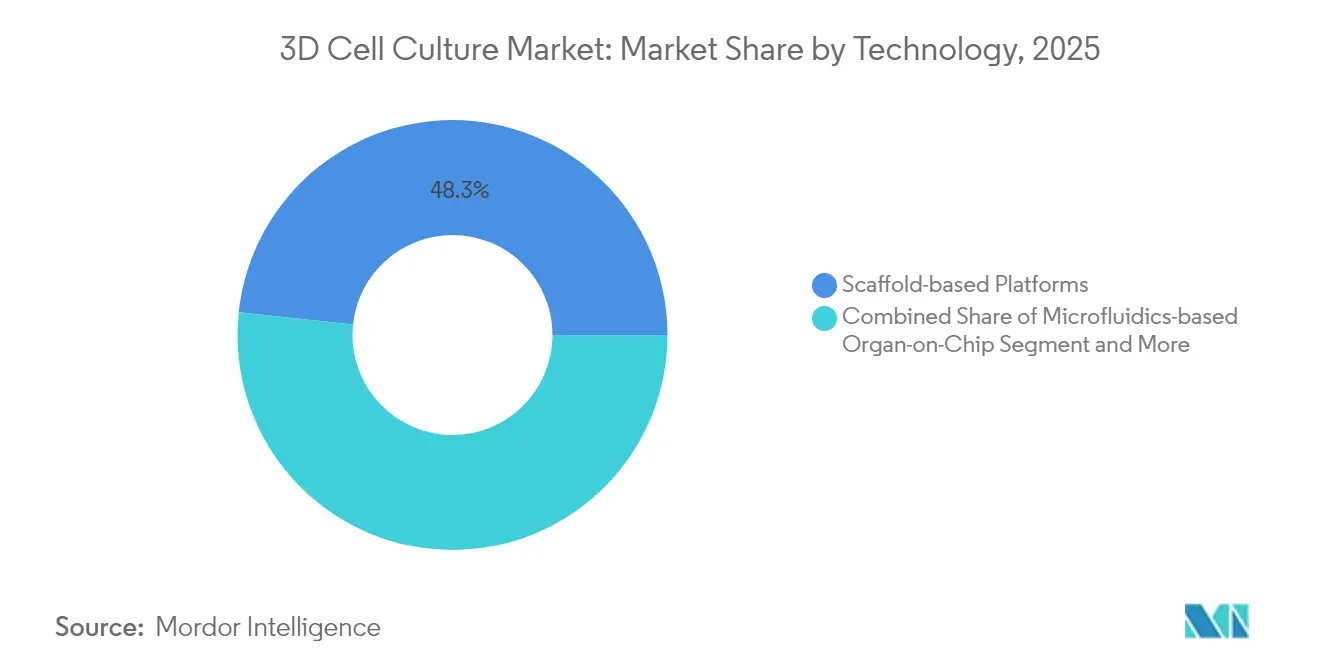
- By technology, scaffold-based platforms led with a 48.32% share of the 3D cell culture market in 2025. Microfluidic organ-on-chip systems are advancing at an 18.25% CAGR through 2031.
- By application, cancer research captured 44.62% of the 3D cell culture market share in 2025. Regenerative medicine is expanding at a 16.74% CAGR to 2031.
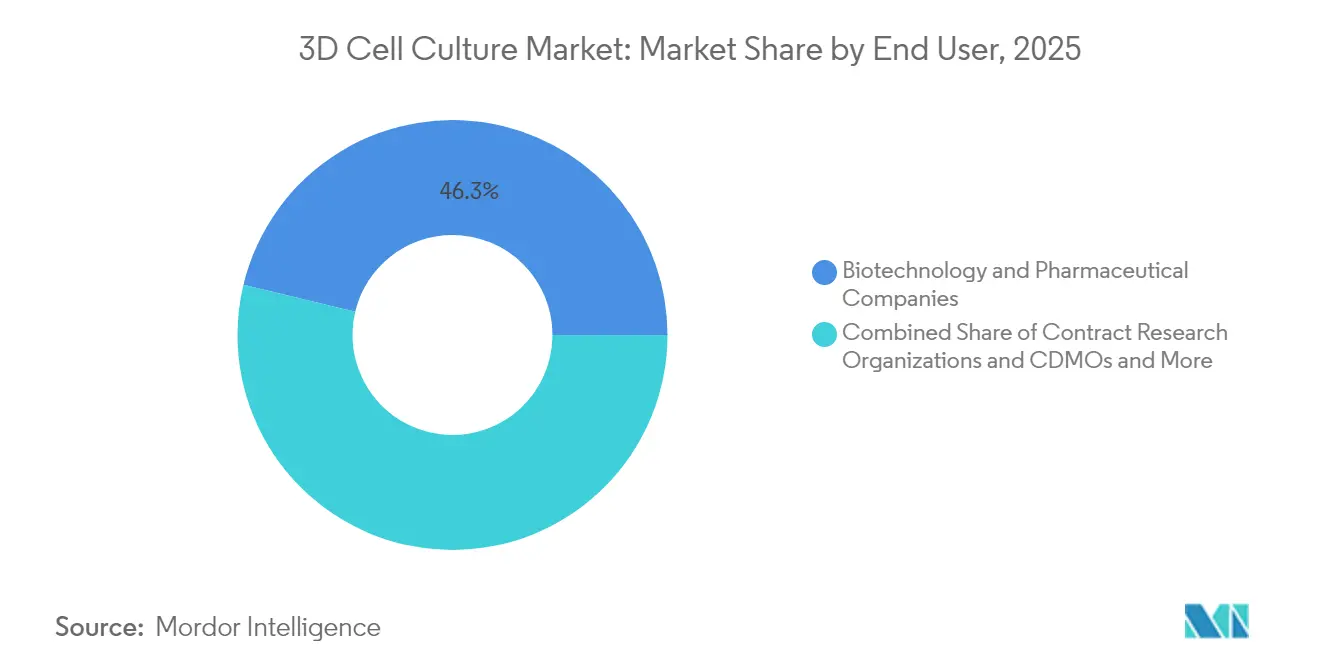
- By end user, biotechnology and pharmaceutical companies held 46.25% of the 3D cell culture market in 2025. CROs and CDMOs are projected to grow at a 16.12% CAGR between 2026-2031.
- By geography, North America controlled 41.55% of the global 3D cell culture market in 2025. Asia-Pacific is predicted to post a 16.32% CAGR through 2031.
Note: Market size and forecast figures in this report are generated using Mordor Intelligence’s proprietary estimation framework, updated with the latest available data and insights as of 2026.
Market Trends and Insights
Drivers Impact Analysis of 3D Cell Culture Market*
| Driver | (~) % Impact on CAGR Forecast | Geographic Relevance | Impact Timeline |
|---|---|---|---|
| Demand for physiologically relevant pre-clinical models | +4.2% | North America, Europe | Medium term (2-4 years) |
| Investment surge in regenerative & personalized medicine | +3.8% | North America, Europe, Japan, South Korea | Long term (≥4 years) |
| Regulatory pressure to replace animal testing | +3.1% | Europe, North America, Asia-Pacific | Medium term (2-4 years) |
| Rapid advances in scaffold materials & bioinks | +2.5% | Global | Short term (≤2 years) |
| Pharma–CRO turnkey partnerships | +1.7% | North America, Europe, China, India | Short term (≤2 years) |
| Source: Mordor Intelligence | |||
Expanding Demand for Physiologically Relevant Pre-clinical Models to Cut Late-Stage Drug Failures
The 90% attrition of drug candidates at phase II and phase III has made predictive fidelity an R&D imperative. Three-dimensional tissues that recapitulate extracellular matrix stiffness, oxygen gradients and multicellular interactions yield toxicity signatures frequently missed in 2D plates. FDA Modernization Act 3.0 now permits investigational new drug submissions anchored on non-animal data, accelerating corporate validation cycles. Bioprinted patient-derived organoids allow real-time stratification of responders and non-responders, reducing costly trial redesigns. Pharmaceutical teams that deployed liver-on-chip arrays reported a 30% drop in candidate withdrawal related to hepatotoxicity in 2024 filings. Together these improvements shrink clinical risk and justify higher up-front spending on advanced culture platforms.
Escalating Global Investment in Regenerative & Personalized Medicine Accelerating 3D Culture Uptake
Private and public capital directed to regenerative therapeutics exceeded USD 30 billion globally in 2025, with 35% earmarked for tissue-engineering toolkits. Because autologous implants demand patient-specific microenvironments, companies integrate 3D bioprinting with induced pluripotent stem cells to fabricate immune-compatible grafts. China’s National Natural Science Foundation doubled grants for hydrogel-based organ patches, spurring domestic suppliers of bioinks. Parallel investments in CRISPR-edited organoids are creating pre-clinical blueprints for single-gene disorders once deemed untreatable. These translational workflows rely on customizable scaffold chemistries and perfusion bioreactors, embedding 3D culture hardware into the core of precision-medicine value chains.
Intensifying Regulatory & Ethical Pressure to Replace Animal Testing in Cosmetics and Pharma
The EU cosmetics directive’s total ban on animal testing coupled with REACH updates forces manufacturers to source alternative toxicology pipelines. ISO, CEN and ASTM are standardizing organ-on-chip terminology, sensor calibration and endpoint reporting, thereby giving regulators a robust checklist for dossier submission[1]Joint Research Centre, “Setting Out a Roadmap for Standardisation of Organ-on-Chip Technology,” ec.europa.eu. Korea’s Ministry of Food and Drug Safety issued guidance in 2025 allowing dermal-on-chip assays as standalone irritation screens. Paper-based microfluidic epidermal models drop consumable costs by 40% and fit within existing high-throughput imaging setups. As compliance deadlines converge, demand intensifies for ready-to-validate 3D constructs that shorten dossier preparation and lower litigation risk tied to animal welfare.
Rapid Advances in Scaffold Materials & Bioinks Enabling Commercial-Scale 3D Production
Next-generation hydrogels use modular peptide sequences that regulate stiffness, degradation and cell adhesion motifs, letting scientists tailor matrices to cardiac, hepatic or neural phenotypes without retooling facilities. Hybrid scaffolds combining polyethylene glycol with collagen increase tensile strength three-fold while retaining low immunogenicity, supporting long-term perfusion cultures. Smart biomaterials that release growth factors in response to pH or enzymatic triggers enable temporal control of differentiation pathways. Coupled with low-cost extrusion bioprinters, these materials push volumetric throughput to levels compatible with batch manufacture of spheroid libraries for screening campaigns. Vendors scaling lyophilized hydrogel cartridges report 25% lower operating costs versus custom mixes, removing a key economic barrier for mid-size labs.
Restraints Impact Analysis of 3D Cell Culture Market*
| Restraint | (~) % Impact on CAGR Forecast | Geographic Relevance | Impact Timeline |
|---|---|---|---|
| High capital & operating costs | -2.8% | Global (stronger in emerging markets) | Short term (≤2 years) |
| Lack of harmonized validation standards | -2.3% | Global | Medium term (2-4 years) |
| Scarcity of specialized technical talent | -1.5% | Asia-Pacific, Latin America, MEA | Medium term (2-4 years) |
| Source: Mordor Intelligence | |||
High Capital & Operating Costs of Advanced 3D Culture Platforms vs. Conventional 2D Systems
Commercial flow-controlled organ-on-chip rigs list between USD 80,000 and USD 150,000, dwarfing the USD 15,000 entry point for stackable 2D incubators. Operating outlays rise further once microfluidic pumps, inline sensors and multiplex image capture are included. Smaller institutes postpone upgrades, limiting regional penetration in South America and Africa. Manufacturers are responding with modulable chips produced on desktop stereolithography printers, slicing per-run costs by 35%[2]Dasgupta I. et al., “Microfluidic Organ-on-Chip Technology,” mdpi.com. Bulk supply agreements for photo-curable resins and open-source control software reduce ownership expenses and could neutralize the restraint within two budget cycles for many labs.
Lack of Harmonized Global Standards for Validation & Reproducibility
Divergent reporting formats impede cross-site data pooling and complicate regulatory filings that span jurisdictions. The European Commission’s Joint Research Centre published a 2025 roadmap outlining reference materials, viability endpoints and inter-laboratory ring tests for organ-on-chip systems. U.S. National Institute of Standards and Technology is coordinating with ISO TC 276 to unify terminology on barrier integrity and fluidic shear. Until consensus protocols reach maturity, sponsors must underwrite extra verification studies to meet national regulators, inflating project timelines. The situation should ease as first-wave standards convert into recognized compendial methods by 2027.
*Our forecasts treat driver/restraint impacts as directional, not additive. The impact forecasts reflect baseline growth, mix effects, and variable interactions.
3D Cell Culture Market Segment Analysis
By Technology:
Microfluidics Reshapes Established PlatformsScaffold platforms held a 48.32% slice of the 3D cell culture market share in 2025 and remained indispensable for long-term cultures that require extracellular-matrix mimicry. This legacy category benefited from decades of published protocols, which made validation straightforward inside regulated quality systems. Yet the microfluidic organ-on-chip sub-segment is outpacing all rivals with an 18.25% CAGR tied to its capacity for laminar flow, real-time imaging windows and multi-organ networking that unlock translational pharmacokinetics. Vendors are integrating peristaltic-pump-free gravity flow and magnetically coupled valves, trimming maintenance downtime and increasing experiment reproducibility. Further momentum stems from cloud-connected sensors that stream metabolic flux to machine-learning models, turning raw images into dose–response curves in minutes rather than days. This efficiency resonates with discovery teams pressured by aggressive milestone timelines, encouraging substitution away from static hydrogel inserts. As costs fall, the 3D cell culture market size for microfluidics is projected to double its 2024 baseline before 2029 without cannibalizing all scaffold demand, because hybrid protocols mix hydrogel droplets within chips to simulate stromal compartments.
Scaffold-free spheroid generators leverage acoustic or magnetic forces to assemble cellular aggregates, appealing to high-throughput screening groups that need 384-well throughput. 3D bioprinting workstations, once confined to engineering departments, now ship with GMP-grade enclosures, positioning the technology for commercial autologous tissue fabrication. Bioreactors married to perfusion sensors deliver homogeneous nutrient gradients required for milliliter-scale tissue constructs aimed at cell-therapy manufacturing. Service providers offering full-stack model design, validation, and data interpretation compete on turnaround speed and depth of molecular annotation, a differentiation that resonates with small biotech firms with lean internal capacities. Collectively, these technological advances expand the addressable user base and cement 3D culture as a staple rather than an exploratory add-on.



By Application:
Personalized Oncology Drives InnovationCancer research captured 44.62% of total spending in 2025 because heterotypic tumor organoids reveal resistance mechanisms masked in monolayer assays. Hypoxic gradients and immune-cell co-cultures inside 3D matrices permit screening of checkpoint inhibitors and adoptive cell transfers against micro-tumor niches. The positive correlation between patient-derived organoid drug responses and clinical outcomes reached 85% in 2024 validation studies, underscoring the translational value. Consequently, oncology groups reallocate budget from murine xenografts to high-throughput tumor chip arrays, accelerating lead prioritization.
Regenerative-medicine and personalized-therapeutics workflows advance at a 16.74% CAGR because 3D scaffolds guide stem-cell fate decisions that 2D substrates cannot support. Engineered cartilage patches reached first-in-human implantation milestones in 2025 trials, propelled by zonal stiffness gradients achieved only through 3D printing. Beyond therapeutic uses, hepatic and neural organoids deliver disease models for rare disorders, drawing orphan-drug developers that need limited yet mechanistically rich assay systems. Drug-discovery and toxicology labs appreciate that 3D constructs deliver four-fold higher concordance with adverse-event databases than flat cultures, cutting attrition in high-value chemical series. Cosmetic and virology testing are niche but rising niches, especially as legislation pushes animal alternatives and outbreaks highlight the need for human-tissue-relevant infection models.
By End User:
CRO Engagement SurgesBiotechnology and pharmaceutical enterprises consumed 46.25% of all 2025 orders because the economics of late-stage failures justify premium expenditure. Their internal adoption accelerated after corporate ESG pledges incorporated animal-reduction targets. Yet CROs and CDMOs clock the highest growth rate at 16.12% because they aggregate specialized hardware and multidisciplinary staff, amortizing costs across many sponsors. Strategic alliances enable pharma clients to offload method development, freeing internal scientists for lead-optimization tasks. Academic and research institutes remain crucibles of innovation, driving novel hydrogel chemistries and analytical modalities that later migrate to commercial kits. Hospitals and diagnostic centers pilot patient-derived organoid programs that inform therapeutic selection in refractory cases, hinting at a future where point-of-care culture stations enter clinical pathology labs. The hybrid service-plus-hardware business model underpinning many startups converts capital outlays into operational expenditures that align with CFO budgeting norms, encouraging broader engagement.
Geography Analysis
North America 3D Cell Culture Market
North America accounted for 41.55% of global revenue in 2025, supported by NIH translational grants, venture-capital depth and expedited FDA pathways for non-animal data. United States laboratories accumulated 85% of regional turnover, particularly within Massachusetts and California clusters that concentrate organ-chip innovators and sequencing providers. Canada and Mexico increased funding pools for biotech incubators, broadening user access and supplementing import flows of consumables.
Europe 3D Cell Culture Market
Europe ranked second and fortified growth through stringent animal-testing bans and Horizon Europe grants earmarked for alternative methods. Germany’s Fraunhofer institutes and the United Kingdom’s Catapult centers collaborate with SMEs to commercialize vascularized bone models that tackle musculoskeletal-disorder pipelines. Regulators collaborate with standard-development bodies to harmonize validation frameworks, smoothing cross-border study comparisons and reinforcing demand confidence.
APAC, MEA and South America 3D Cell Culture Market
Asia-Pacific logs the fastest CAGR at 16.32% as China, Japan and South Korea integrate 3D culture into national precision-medicine roadmaps. China’s Ministry of Science and Technology subsidizes organ-on-chip pilots in state key laboratories, while Japanese consortia target brain-on-chip solutions for neurodegeneration. India’s Council of Scientific and Industrial Research sponsors indigenous hydrogel startups to cut import dependency. Elsewhere, the Middle East, Africa and South America register nascent but rising orders as academic-industry clusters form around university hospitals. Brazil funds 3D bioprinting centers focused on dermal toxicity tests to align with new cosmetic regulations. The growing global footprint magnifies the 3D cell culture market size in regional breakouts and propels the technology into mainstream adoption cycles.

Regulatory Landscape
Regulatory acceptance is increasingly organized around New Approach Methodologies (NAMs) and fit-for-purpose validation rather than blanket replacement of in vivo studies. In the United States, FDA programs used for tool and methodology engagement (including its Drug Development Tool framework) and its nonclinical expectations across biologics development underpin greater use of human-relevant 3D models in safety and efficacy packages, aligning with the report context that FDA encouragement of non-animal assays is supporting adoption in North America. In Europe, the European Medicines Agency (EMA) has formal mechanisms that directly touch organoids and organ-on-chip, including its Qualification of Novel Methodologies (QoNM) guidance for applicants and its specialised expert community for non-clinical NAMs. EMA also consulted on the use of virtual control groups to reduce animal use, reinforcing the 3R direction that drives demand for 3D cell culture-based assays.
Standardization activity is tightening expectations around reproducibility, materials quality, and reporting, which is central to regulated deployment of microphysiological systems and bioprinted tissues. ISO workstreams addressing bioprinting process requirements (including bioink quality and reproducibility) and processing of decellularized extracellular matrices (dECM) provide anchors for scaffold and hydrogel suppliers to align documentation and manufacturing controls with downstream pharma needs. At the same time, the report context that ISO, CEN, and ASTM are standardizing organ-on-chip terminology and endpoint reporting is reflected in ongoing harmonization efforts referenced in the study period, reducing friction in cross-jurisdiction submissions while increasing the burden on vendors to provide consensus-ready validation packages.
Competitive Landscape
Market concentration remains moderate because differentiated niches coexist within a broader adoption wave. Thermo Fisher Scientific and Merck KGaA anchor portfolios that span plastics, reagents and software, capturing synergy across workflows. Corning leverages glass substrate expertise to supply ultra-low attachment plates that seed spheroids with minimal batch variance[3]Corning, “3D Cell Culture Models,” corning.com. InSphero and MIMETAS exploit microfluidic intellectual property layered with disease-specific biology, winning share inside oncology and metabolic-disease programs. Emerging players such as Emulate, CN Bio and TissUse pioneer multi-organ chips, positioning for systemic-exposure modelling.
Patent filings expanded 35% between 2023-2025, especially around shear-resistant microchannels and photo-cross-linkable bioinks. Strategic moves include Merck KGaA’s USD 420 million acquisition of OrganoTech Biosciences to integrate patient-derived organoid services. Thermo Fisher launched an AI-enabled imaging suite that pairs with its perfusion chips for automated endpoint scoring. Partnerships with analytics-software vendors simplify data pipelines, a key adoption driver. Vendors that bundle chips, media and analysis into subscription contracts build recurring-revenue streams, shielding cashflow from cyclical capital budgets.
White-space opportunities revolve around turnkey validation kits and GMP-grade materials compatible with cell-therapy manufacture. Vendors who provide consensus-ready documentation will benefit as ISO and ASTM finalize standards. The entry of cloud-native analytics firms accelerates interpretation of multiplex readouts, forging cross-sector collaborations between life-science toolmakers and data-science specialists.
3D Cell Culture Industry Leaders
Merck KGaA
MIMETAS BV
Lonza Group AG
Thermo Fisher Scientific Inc.
Corning Incorporated
- *Disclaimer: Major Players sorted in no particular order
3D Cell Culture Market Companies Covered in this Report
- Thermo Fisher Scientific
- Corning
- Merck
- Lonza Group
- Sartorius
- Becton Dickinson & Co.
- InSphero
- Mimetas
- CN Bio Innovations Ltd.
- BiomimX
- Hurel
- Nortis
- PromoCell
- Kirkstall Ltd.
- TissUse
- Synthecon Inc.
- QGel SA
- Prellis Biologics Inc.
- Advanced Solutions Life Sciences
- CELLINK AB

Market Opportunities and Future Outlook
White-space remains in industrializing 3D culture from discovery workflows into scalable, quality-controlled inputs for translational and manufacturing use, particularly where stem cells, organoids, and perfused microphysiological systems intersect. A concrete signal is Fujifilm Cellular Dynamics opening a 175,000-square-foot facility in Madison, Wisconsin (May 2026) to quadruple capacity for iPSC-based research products and services. This expansion increases availability of consistent human cell inputs that underpin organoid and complex co-culture models. It also complements the report trend of growing CRO and CDMO participation, since standardized cell supply can help external partners run higher-throughput 3D assays with lower batch variance and clearer documentation.
A second opportunity area is GMP-aligned 3D model production and cell expansion toolchains that connect scaffold materials, media, and bioprocess know-how to reproducible outputs. Made Scientifics partnership with RoosterBio (May 2026) to incorporate proprietary MSC expansion media and bioprocess expertise into GMP operations, and the Applied StemCell and RoosterBio collaboration (July 2026) on scalable iPSC-based bioprocess solutions, highlight ongoing efforts to link upstream cell manufacturing with downstream 3D culture applications in drug discovery, toxicology, and regenerative medicine. On the technology roadmap, advances in controllable, high-throughput 3D matrices and stereolithography-printed intestinal scaffolds during 2026 support a materials and fabrication path toward higher assay reproducibility, directly addressing the restraint around lack of harmonized validation and buyer demand for reliable cross-site comparability.
Recent Industry Developments in 3D Cell Culture Market
- May 2026: Fujifilm Cellular Dynamics opened a 175,000-square-foot facility in Madison, Wisconsin to quadruple capacity for iPSC-based research products and services supporting drug discovery and cell therapy manufacturing. The added scale strengthens availability of standardized human cell inputs that are foundational for organoid and complex 3D co-culture workflows. It also supports wider deployment of reproducible 3D models by CROs and biopharma teams that need consistent starting materials across sites.
- October 2025: Merck KGaA (MilliporeSigma) partnered with Promega to co-develop 3D cell culture assays designed to track cellular activity in real time. The collaboration links 3D biology with established assay and detection toolsets, improving the practicality of running higher-content readouts in routine screening. It also reinforces competitive differentiation through integrated workflows that pair models, reagents, and analytics.
- September 2024: MIMETAS launched OrganoReady Colon Organoid, a ready-to-use 3D colon model derived from adult stem cells for drug discovery and high-throughput applications. Packaging a standardized, off-the-shelf organoid model lowers adoption barriers for labs that need faster setup and consistent performance. The release also supports the broader shift toward microphysiological and organoid systems as alternatives to lower-fidelity 2D assays in toxicity and efficacy screening.


3D Cell Culture Market Report Scope and Research Methodology
Market Definition and Coverage
For this study, the 3D cell culture market covers revenues generated from products and solutions that enable cells to be grown in three dimensions for research, development, and testing workflows, and includes commonly used consumables, systems, and related platforms used in labs.
Scope exclusions: We exclude contract research service revenues, clinical procedure costs, and broad upstream cell culture media that is not primarily purchased for 3D workflows.
Segments Covered in This Report
- By Technology
- Scaffold-based Platforms
- Micropatterned Surface Microplates
- Hydrogels (Natural, Synthetic, Hybrid)
- ECM-Derived Scaffolds
- Porous Microcarriers
- Scaffold-free Platforms
- Hanging Drop Plates
- Magnetic Levitated Spheroids
- Microfluidics-based Organ-on-Chip Systems
- 3D Bioreactors (Spinner, Perfusion, Rotating-Wall)
- 3D Bioprinting Systems & Reagents
- Services (Custom Assay Development, Outsourced Models)
- Scaffold-based Platforms
- By Application
- Cancer Research & Oncology Drug Screening
- Stem Cell Research & Tissue Engineering
- Drug Discovery & Toxicology Screening
- Regenerative Medicine / Personalized Therapeutics
- Other Applications (Virology, Cosmetics Safety)
- By End User
- Biotechnology & Pharmaceutical Companies
- Academic & Research Institutes
- Contract Research Organizations & CDMOs
- Hospitals & Diagnostic Centers
- Geography
- North America
- United States
- Canada
- Mexico
- Europe
- Germany
- United Kingdom
- France
- Italy
- Spain
- Rest of Europe
- Asia-Pacific
- China
- Japan
- India
- South Korea
- Australia
- Rest of Asia-Pacific
- Middle East and Africa
- GCC
- South Africa
- Rest of Middle East and Africa
- South America
- Brazil
- Argentina
- Rest of South America
- North America
Data Sources, Market Sizing, and Validation
Desk Research
Desk work starts by mapping the demand pool and the supply ecosystem so the market boundary stays consistent across regions. We rely on public and official sources such as US FDA databases for relevant guidance and approvals, US NIH funding data, OECD health and R&D indicators, and World Bank macro series to anchor inflation and spending context.
To keep assumptions realistic, we also review company annual reports, investor decks, regulatory filings, peer reviewed articles, and association websites that discuss adoption of 3D models in drug discovery and disease research. In selected cases, paid subscriptions are used for company financials and intelligence, news and financials tracking, and patent databases to confirm activity levels and product direction without overcounting adjacent categories. These desk sources are illustrative only, and other public references were also used for data collection, validation, and clarification.
Primary Interviews and Surveys
Primary work is used to pressure test pricing and adoption, especially where public sources remain qualitative. We speak with a mix of suppliers, distributors, lab managers, and end users in pharma and biotech, academic labs, and research organizations, and we spread coverage across major regions so usage patterns are not treated as one-size-fits-all.
Distribution of primary research fieldwork respondents
| Company type | Respondent position | Region |
|---|---|---|
| Top tier: 28% | CXOs: 12% | APAC: 44% |
| Mid tier: 50% | Functional/Unit leaders: 40% | EMEA: 34% |
| Smaller Players: 22% | Managers: 48% | Americas: 22% |
Market-Sizing & Forecasting
Sizing is built using a top-down approach where life science R&D activity, lab consumables intensity, and the shift from 2D to 3D workflows are used to reconstruct the addressable spend by region, and then split into relevant 3D culture enablement categories. Once the demand pool is formed, we corroborate totals using selective bottom-up checks, such as sampled average selling prices multiplied by typical run rates, and channel feedback on mix shifts, which is then used to tune the final number.
Key inputs include public R&D funding direction, drug discovery throughput signals, the penetration of advanced in vitro models, typical consumables per experiment, and equipment replacement cycles, along with exchange-rate timing for non-USD billing. Forecasts lean on scenario analysis supported by variable-level expectations from interviews. Adoption can move faster when new assays standardize, and it can slow when budgets get tight. Where supplier disclosure is limited, gaps are handled using proxy ratios (such as spend per active lab and per funded program), followed by a reasonableness check against observed pricing bands.
Data Validation & Update Cycle
Outputs are checked against independent signals, such as R&D spending direction, publication momentum in 3D models, and reported category growth in public filings, and then reviewed for outliers before sign-off. If a major variance shows up by region or by implied pricing, we re-contact participants and re-check the assumption that caused the jump.
The model and narrative are refreshed annually, and interim updates are made when material events affect adoption, pricing, or supply. Before delivery, a final analyst pass is completed so clients receive an updated view based on the latest available data.
Mordor Intelligence's 3d Cell Culture Market Size Versus Other Published Estimates
Published market sizes for 3D cell culture can look far apart even when they use similar words, largely because timing and pricing choices differ in small but meaningful ways. The year picked for currency conversion, the way average selling prices are trended, and how often assumptions are refreshed can all shift the number.
In this study, the refresh cadence and currency timing are kept consistent across regions and then cross-checked through interview-based pricing bands and usage rates. This helps prevent a single fast-moving country from distorting the global rollup, a modeling choice applied by Mordor Intelligence.
Benchmark comparison
| Source | Market Size | Gaps in Research Methodology |
|---|---|---|
| Mordor Intelligence | USD 2.67 B (2026) | |
| Global Consultancy A | USD 2.83 B (2025) | Uses an earlier base year and a different forecast window, and the USD conversion timing can lift the stated value if exchange rates are taken from a different month or annual average. |
| Industry Publisher B | USD 1.26 B (2025) | Tends to keep a narrower product boundary and may treat some 3D enabling consumables and platforms as part of broader cell culture spend, which reduces the counted 3D-specific revenue pool. |
The spread is mainly explained by base-year selection, what is counted as 3D-specific revenue, and how ASP progression is handled over time. By keeping each input traceable to clear demand signals and re-validating pricing and adoption assumptions, our estimate stays practical to reproduce and easier to compare year to year.


Key Questions Answered in the Report
What revenue does North America generate from 3D cell culture in 2026?
North America delivers 41.55% of global sales, translating to about USD 1.11 billion based on the 2026 market size.
Which segment is growing fastest within the technology category?
Microfluidic organ-on-chip platforms, forecast to advance at an 18.25% CAGR through 2031.
How do 3D cultures improve oncology drug discovery?
They reproduce tumor microenvironment factors such as hypoxia and stromal contact, producing 85% concordance with clinical outcomes reported in 2024 studies.
Why are CROs pivotal for adoption?
CROs bundle specialized hardware, protocols and AI analytics, letting sponsors access advanced models without heavy capital investments, driving a 16.12% CAGR.
What is the primary restraint hindering uptake in emerging markets?
High upfront device costs relative to 2D systems reduce adoption where research budgets are limited; new low-cost printable chips are easing this gap.
How are standards evolving?
ISO, ASTM and the European Commission are drafting harmonized validation norms that should mature by 2027, simplifying global regulatory submissions.
Page last updated on:






