Size and Share of IT Market In Real Estate Industry
Market Overview
| Study Period | 2020 - 2031 |
|---|---|
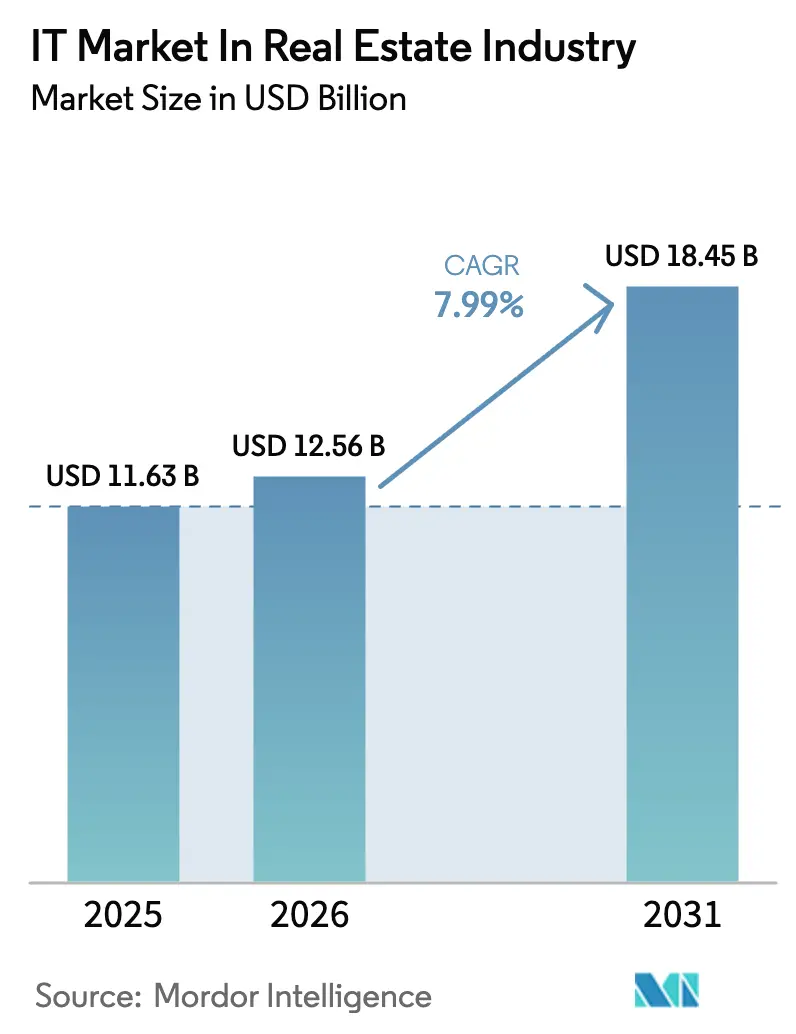
| Market Size (2026) | USD 12.56 Billion |
| Market Size (2031) | USD 18.45 Billion |
| Growth Rate (2026 - 2031) | 7.99% CAGR |
| Fastest Growing Market | Asia Pacific |
| Largest Market | North America |
| Market Concentration | Medium |
Major Players *Disclaimer: Major Players sorted in no particular order Image © Mordor Intelligence. Reuse requires attribution under CC BY 4.0. | |
Analysis of IT Market In Real Estate Industry by Mordor Intelligence
The IT Market in Real Estate Industry market is expected to grow from USD 11.63 billion in 2025 to USD 12.56 billion in 2026 and is forecast to reach USD 18.45 billion by 2031 at 7.99% CAGR over 2026-2031. Heightened demand for cloud-native microservice platforms, predictive analytics, and integrated ESG reporting tools underpins this expansion as property owners prioritize scalable systems that trim operating costs and accelerate leasing cycles. Widespread IoT deployment strengthens AI-driven predictive maintenance programs that cut unexpected downtime and lengthen asset lifecycles, while digital-first tenant experience suites improve lead conversion and shorten vacancy periods. Institutional investors boost spending on real-time portfolio analytics that meet evolving sustainability mandates in Europe and North America.[1]CRETI, “Q1 2024 Proptech Venture Capital Insight: Navigating Through Changing Tides,” creti.vc Competitive intensity remains moderate because large enterprise software vendors continue to safeguard installed bases even as fast-moving PropTech specialists introduce differentiated mobile-first products.
Key Report Takeaways
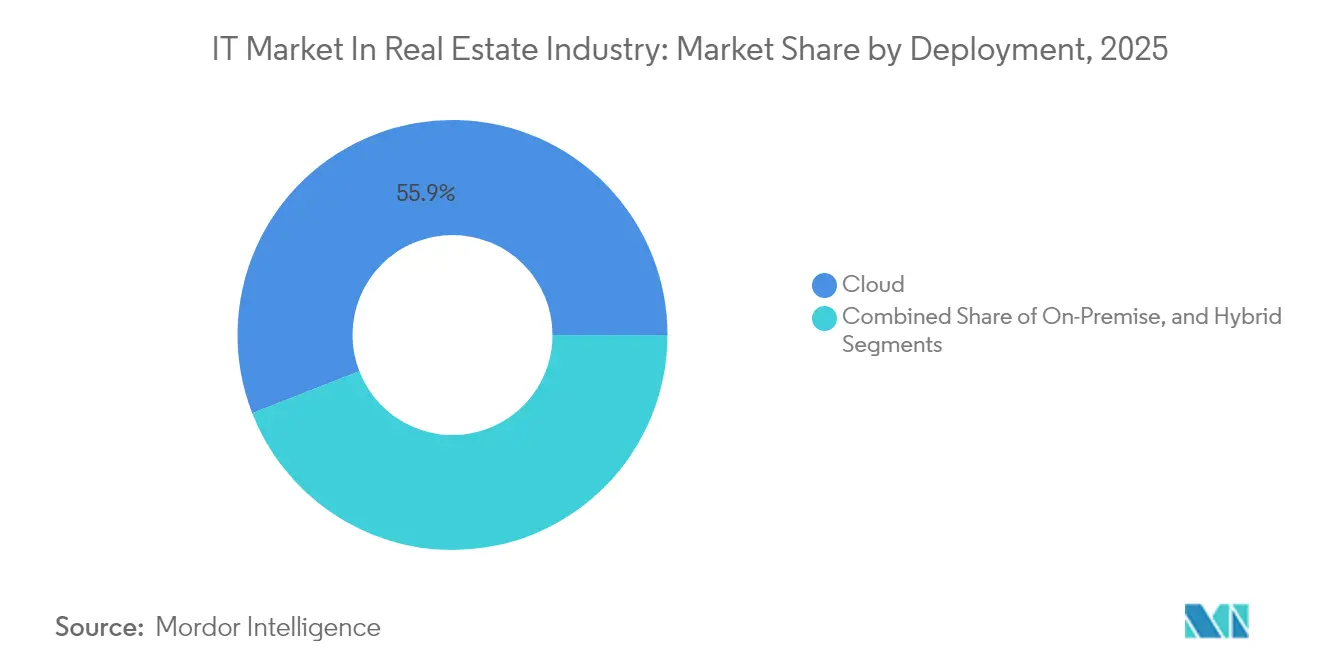
- By deployment, cloud solutions captured 55.92% of IT Market in Real Estate Industry market share in 2025, and they are expanding at an 8.56% CAGR through 2031.
- By solution type, business intelligence and analytics is advancing at an 8.01% CAGR and is the fastest-growing segment to 2031.
- By end user, commercial real estate companies held 45.10% revenue share in 2025, whereas real estate investors and REITs record the highest projected CAGR at 8.78% through 2031.
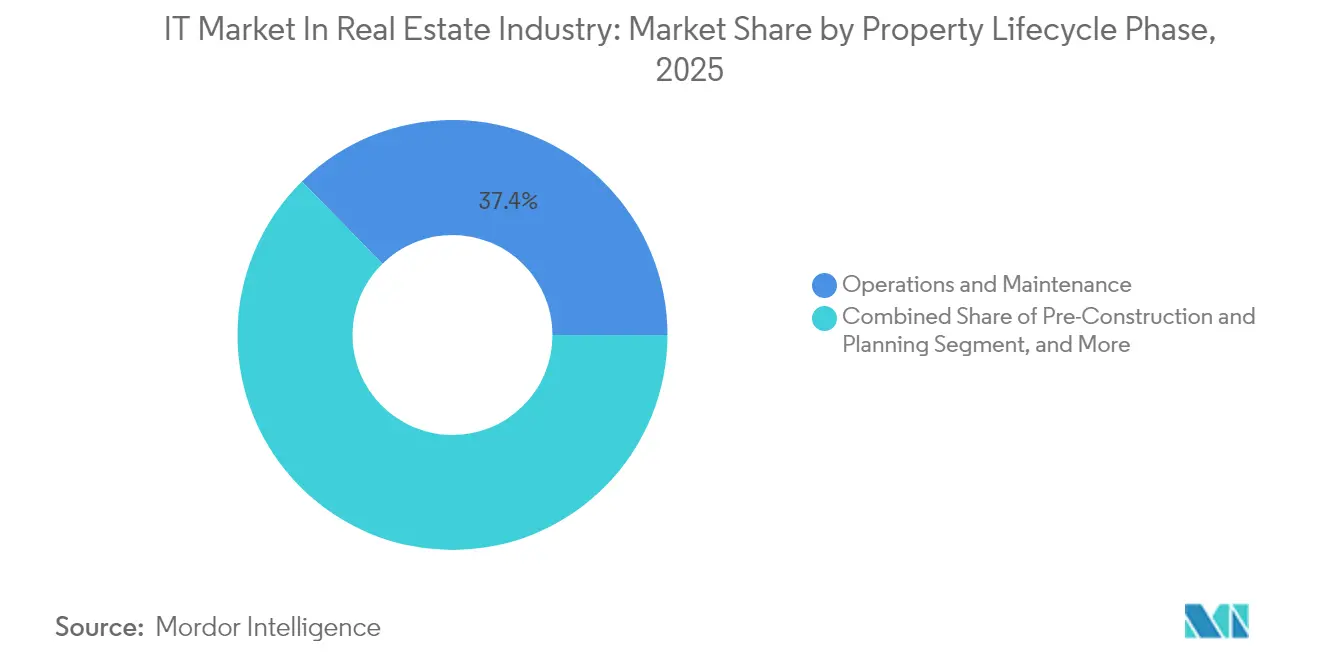
- By property lifecycle phase, operations and maintenance commanded 37.35% of the IT Market in Real Estate Industry market size in 2025; sales and marketing platforms are forecast to rise at a 9.02% CAGR between 2026-2031.
- By organization size, large enterprises led with 62.55% revenue share in 2025, while small and medium enterprises are projected to expand at an 8.66% CAGR through 2031.
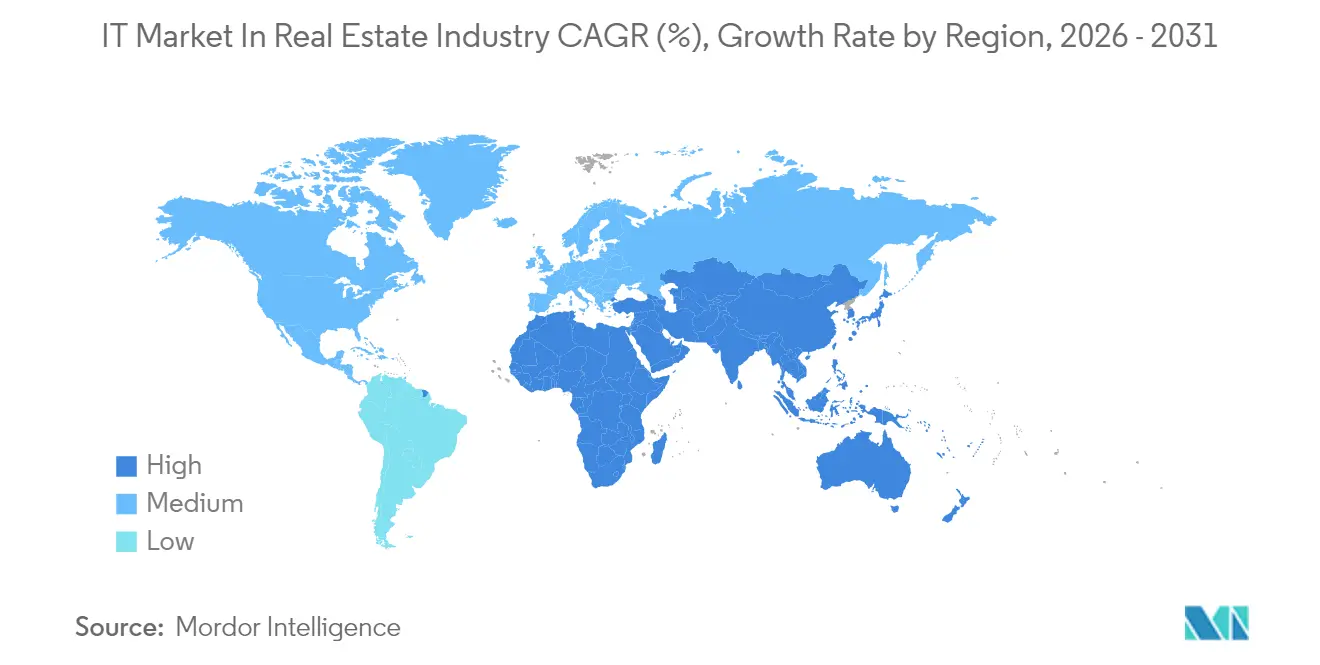
- By geography, North America accounted for 40.78% revenue share in 2025, whereas Asia Pacific is poised for the fastest growth at a 8.76% CAGR to 2031.
Note: Market size and forecast figures in this report are generated using Mordor Intelligence’s proprietary estimation framework, updated with the latest available data and insights as of January 2026.
Insights and Trends of IT Market In Real Estate Industry
Drivers Impact Analysis
| Driver | (~) % Impact on CAGR Forecast | Geographic Relevance | Impact Timeline |
|---|---|---|---|
| Accelerated digital-first tenant experience platforms | +1.8% | Global – early gains in North America and Asia Pacific | Short term (≤ 2 years) |
| Cloud-native microservice architectures replacing monoliths | +2.1% | Global – led by North America and Europe | Medium term (2-4 years) |
| AI-driven predictive maintenance for facilities | +1.5% | Global – concentrated in developed markets | Medium term (2-4 years) |
| Growing institutional appetite for real-time ESG reporting | +1.3% | Global – regulatory driven in EU and North America | Long term (≥ 4 years) |
| Government smart-city incentives funnelled into PropTech | +1.0% | Asia Pacific core, spill-over to Middle East and Africa and Latin America | Long term (≥ 4 years) |
| Tokenisation and fractional real-estate ownership models | +0.7% | North America and EU – emerging in Asia Pacific | Long term (≥ 4 years) |
| Source: Mordor Intelligence | |||
Accelerated Digital-First Tenant Experience Platforms
Mobile-centric leasing applications now let prospects schedule tours, submit documentation, and execute leases without face-to-face contact, shortening average leasing cycles by nearly 30% according to platform user reports. Integrated communication portals sustain continuous engagement, boosting renewal rates as tenants handle payments, maintenance requests, and community events through a single dashboard. AI chatbots embedded in these suites handle high-volume inquiries 24/7, freeing on-site teams for value-added tasks. Predictive lead-scoring tools identify top-quality applicants and suggest optimized concessions that protect net operating income. Demand for frictionless digital experiences encourages portfolio owners to consolidate standalone CRM, marketing, and leasing tools into unified cloud subscriptions, trimming duplicate data entry and elevating customer satisfaction.
Cloud-Native Microservice Architectures Replacing Monoliths
Real estate enterprises are dismantling legacy systems in favor of modular cloud environments that allow services to be added or removed without impacting core functionality. A 1,500-unit multifamily operator can spin up purpose-built marketing, maintenance, or resident-portal services in weeks rather than months, slashing professional-service fees and accelerating time-to-value. Continuous delivery pipelines push new features into production daily, ensuring constant security patching and regulatory compliance. Standardized API layers simplify integrations with accounting, payroll, and document-management suites, eliminating the brittle point-to-point connectors that plagued earlier deployments. Lower infrastructure overhead and predictable pay-as-you-grow pricing make advanced functionality accessible to small and medium portfolios, broadening the IT Market in the Real Estate Industry market footprint.
AI-Driven Predictive Maintenance for Facilities
IoT sensors now stream vibration, pressure, and temperature data from elevators, HVAC chillers, and pumps into AI engines that forecast component failure days before it occurs. Field pilots demonstrate 35% reductions in unplanned downtime and 17% savings in annual maintenance spending.[2]Hexagon, “Building Smarter: How Digital Transformation Tackles Today’s Biggest Challenges in Construction,” bdcnetwork.com Automated work-order triggers ensure just-in-time part procurement, avoiding costly expedited delivery charges. Intelligent dispatching assigns nearby technicians whose skill profiles best match the predicted repair, raising first-time-fix rates. Energy consumption dashboards highlight anomalous usage patterns, enabling fine-tuned equipment scheduling that supports corporate Net Zero commitments. Scalable cloud infrastructure allows these capabilities to be rolled out portfolio-wide without on-premise gateways, a critical factor for geographically dispersed assets.
Growing Institutional Appetite for Real-Time ESG Reporting
Investors now require carbon-emission, water-usage, and indoor-air-quality analytics at the asset and fund level to meet upcoming disclosure mandates in the European Union and several U.S. states. Digital twins fuse BIM files with live sensor data to create a single source of truth for sustainability metrics, streamlining third-party assurance requests. Automated dashboards benchmark building performance against ENERGY STAR and GRESB scores, allowing asset managers to prioritize retrofits that generate the highest ROI. Some property owners achieve 20-50% carbon-footprint reductions within two budget cycles through data-driven HVAC optimization and lighting controls. Integrating ESG insight into investor portals strengthens access to green financing instruments that command lower coupon rates.
Restraints Impact Analysis
| Restraint | (~) % Impact on CAGR Forecast | Geographic Relevance | Impact Timeline |
|---|---|---|---|
| Legacy data silos and interoperability gaps | -1.4% | Global – acute in North America and Europe | Medium term (2-4 years) |
| Cyber-security liabilities in SaaS multi-tenant stacks | -0.8% | Global – heightened in developed markets | Short term (≤ 2 years) |
| Shortage of domain-specific data-science talent | -0.6% | Global – concentrated in major tech hubs | Long term (≥ 4 years) |
| Regulatory uncertainty around real-estate tokenisation | -0.3% | North America and EU primarily | Long term (≥ 4 years) |
| Source: Mordor Intelligence | |||
Legacy Data Silos and Interoperability Gaps
Many owners still rely on disconnected accounting, leasing, and maintenance tools that share no standardized data model, forcing staff to reconcile spreadsheets manually and delaying reporting cycles by up to two weeks. Large diversified portfolios face hurdles standardizing chart-of-accounts structures across office, multifamily, and industrial assets. Integration projects frequently stretch to six months as IT teams create custom adapters, driving cost overruns and user frustration. Governance issues emerge when source-of-truth disputes arise between property-level systems and corporate ERPs. Until common data schemas and open API standards become universal, these interoperability barriers will moderate IT Market in Real Estate Industry market adoption rates.
Cyber-Security Liabilities in SaaS Multi-Tenant Stacks
Shared-infrastructure models expose tenant payment cards, lease documents, and personally identifiable information to threat actors seeking a single large haul. Real estate companies experienced a 40% jump in cyber incidents between 2023 and 2024. Attack surfaces widen when vendors integrate third-party payment gateways or smart-building devices without rigorous penetration testing. Breach notification rules under GDPR and multiple U.S. state privacy laws amplify financial exposure through heavy fines and class-action suits. While zero-trust frameworks and SOC 2 audits mitigate risk, uneven security maturity among mid-tier SaaS vendors remains a pressing concern that can stall procurement decisions.
Segment Analysis
By Deployment - Cloud Dominance Accelerates Digital Migration
Cloud solutions controlled 55.92% of IT Market in Real Estate Industry market share in 2025 and are growing at an 8.56% CAGR, reflecting decisive momentum toward subscription models that cut upfront capital expense. The IT Market in Real Estate Industry market size attributed to cloud deployments is projected to cross USD 10.6 billion by 2031 as even regulated portfolios receive clearance to store sensitive lease data in SOC 2-compliant environments. On-premise installations persist for entities requiring sovereign hosting or extensive bespoke workflows, but their growth plateaus as maintenance costs outstrip perceived control benefits. Hybrid configurations serve as transitional bridges, but their share diminishes each year as migration projects compress from six months to as little as 45 days. Vendors bundle migration utilities and sandbox testing environments to accelerate the shift.
Cloud adoption surged after 2020 when remote-work mandates highlighted the limitations of site-bound servers. Multi-tenant architectures now deliver automatic feature rollouts, high availability SLAs, and rapid vertical-specific enhancements, giving smaller firms access to best-in-class tools once limited to large enterprises. Role-based mobile apps empower field technicians and leasing agents with real-time property data, reinforcing the cloud value proposition. Rising cyber insurance premiums for self-hosted stacks also push boards toward professionally managed cloud infrastructure.
Note: Segment shares of all individual segments available upon report purchase
By Solution Type - Analytics Emerges as Growth Driver
Property management software retained 28.35% share in 2025, underscoring its anchor role in rent collection, work-order tracking, and resident communication. Business intelligence and analytics platforms, however, represent the fastest-moving category at an 8.01% CAGR, propelled by investor demand for up-to-the-minute portfolio insights. The IT Market in Real Estate Industry market size related to analytics is expected to eclipse USD 3.2 billion by 2031 as funds integrate predictive vacancy forecasting, rent elasticity modeling, and carbon benchmarking into their dashboards. Integrated suites now pipe data to ERP systems, payment processors, and ESG portals, reducing manual spreadsheet wrangling.
Customer relationship management modules deliver AI-based lead nurturing that adjusts ad spend automatically when occupancy dips, while lease-administration extensions incorporate automated valuation-model controls mandated by U.S. banking regulators. Document-management tools embed advanced OCR to index historical leases, accelerating due diligence during acquisitions. Compliance and risk modules gain traction as property managers prepare for anti-money-laundering reporting obligations that take effect in December 2025. Integrated platform suites bundle these capabilities, shrinking vendor lists and improving user adoption.
By End User - Institutional Capital Drives Technology Adoption
Commercial real estate companies contributed 45.10% of 2025 revenue, leveraging enterprise-grade suites to manage complex rent rolls and regional regulatory frameworks. The IT Market in Real Estate Industry market is seeing the investor and REIT cohort climb at a 8.78% CAGR as pension funds and sovereign wealth vehicles demand granular performance analytics for diversified global portfolios. This cohort’s embrace of technology tightens data-collection standards, cascading best practices down to operating partners. Residential operators deploy mobile resident portals to improve retention amid rising turnover, while industrial landlords integrate warehouse-automation telemetry to optimize racking layouts and dock-door scheduling.
Institutional players dictate vendor roadmaps, requesting near real-time ESG metrics, dynamic hold-sell recommendations, and automated capital-planning tools. Smaller syndicators follow suit, benefiting from feature trickle-down once platforms achieve scale. Across user groups, consolidation accelerates as acquisitions force disparate portfolios onto common stacks, often triggering fresh implementation projects that expand the IT Market in Real Estate Industry market.
By Property Lifecycle Phase - Operations Technology Leads Investment
Operations and maintenance captured 37.35% of outlays in 2025, and this slice of the IT Market in Real Estate Industry market continues to expand as owners seek cost advantages over the multi-decade operational horizon. AI-optimized preventive schedules and energy dashboards slash recurring spend, freeing cash for capital projects. Sales and marketing applications exhibit the highest growth at 9.02% CAGR, thanks to digital advertising automations and virtual-tour engines that boost lease-up velocity in competitive metros. Pre-construction models leverage BIM and digital twins to test multiple design scenarios that minimize long-term operating expense, while construction administration platforms deliver real-time quality-control imagery and schedule analytics.
Lifecycle convergence gains steam: data generated during design stages feeds maintenance planning, and sensor streams inform asset-replacement schedules and renovation budgets. Platform vendors now embed circular economy calculators that quantify embodied carbon savings when components are refurbished rather than replaced, dovetailing with green-loan covenants.
Note: Segment shares of all individual segments available upon report purchase
By Organization Size - SMEs Accelerate Cloud Adoption
Large enterprises held 62.55% of spending in 2025 as multinational owners standardized technology across continents. Still, the SME segment is outpacing overall market expansion at an 8.66% CAGR, underpinned by entry-level SaaS tiers starting below USD 1.50 per door monthly. These plans bundle online payment, bulk messaging, and basic analytics, granting small landlords tools once exclusive to institutional portfolios. A sharper focus on usability and in-app onboarding narrows the training gap that historically hampered technology uptake in smaller firms.
Vendor ecosystems cater to SMEs with pre-built integrations to QuickBooks, Stripe, and DocuSign, enabling end-to-end digitization without dedicated IT staff. As SME portfolios mature, seamless tier upgrades maintain platform continuity, preserving customer lifetime value for providers and sustaining IT Market in Real Estate Industry market momentum.
Geography Analysis
North America generated 40.78% of global revenue in 2025 as the most mature PropTech ecosystem attracted USD 2.2 billion of venture capital in October 2024 alone. Rapid innovation cycles in California and New York feed continuous feature enhancements, while incoming FinCEN rules drive fresh demand for compliance automation. Canada mirrors U.S. adoption patterns, although provincial privacy regimes require data-residency assurances that steer some clients toward regional data centers.
Asia Pacific is the fastest-growing territory at 8.76% CAGR through 2031, led by Singapore’s smart-estate mandates, Australia’s PropTech grants, and China’s push to integrate “quality productive forces” into construction. High-rise densification in Tokyo and Hong Kong prioritizes predictive maintenance to avoid costly elevator downtime, while India’s real estate investment trusts deploy cloud suites to satisfy cross-border investor transparency expectations. Government-backed green-building codes speed adoption of ESG dashboards, reinforcing IT Market in Real Estate Industry market expansion.
Europe advances steadily as Net Zero trajectories spur widespread sensor rollouts and energy-optimization platforms. The European Union’s taxonomy framework and new CSRD reporting obligations make real-time emissions tracking a must-have, prompting landlords to integrate digital twins that provide auditable data trails. Germany’s multifamily sector adopts tenant apps that streamline rent payment under tight rent-control regulations, whereas the United Kingdom’s institutional funds emphasize risk analytics to navigate post-Brexit liquidity shifts. Southern Europe, once technology-lagging, accelerates uptake through EU stimulus linked to building-renovation milestones.
Competitive Landscape
The market exhibits moderate concentration, with enterprise software incumbents defending entrenched ERP integrations while nimble PropTech challengers scale through vertical innovation. Oracle, SAP, and Microsoft cross-sell property modules into existing finance clouds, leveraging single-vendor procurement advantages. Yardi, RealPage, and AppFolio, meantime, refine vertical depth, embedding utility-billing reconciliations, affordable-housing compliance, and student-housing roommate matching that larger suites lack. Cloud-native architectures enable rapid feature shipping, giving challengers time-to-market advantages despite smaller R&D budgets.
Strategic moves highlight the shifting terrain. CoStar’s USD 5.9 billion acquisition of Matterport marries data and immersive 3D visualization to create market-wide digital twins. RealPage’s purchase of Rexera expands lease-administration capabilities for institutional multifamily operators. Capital inflows remain robust: PropTech funding surpassed USD 2 billion in a single month during 2024, underwriting AI-centric applications that feed differentiation. Yet cyber-security rigor emerges as a competitive litmus test; vendors boasting FedRAMP or ISO 27001 certifications win larger enterprise bids. Implementation timelines become another battleground, with cloud specialists completing rollouts in fewer than 45 days against legacy vendors averaging 120 days.
Incumbents respond by opening API marketplaces that let partners add specialized micro-services, mitigating fears of vendor lock-in. Meanwhile, regional players localize interfaces and compliance modules for language and regulatory nuance, carving footholds in Europe and Asia Pacific. Overall, success hinges on blending breadth, depth, and frictionless user experience in a single cohesive stack that aligns with tenant expectations and investor reporting mandates.
Leaders of IT Market In Real Estate Industry
IBM Corporation
SAP SE
Oracle Corporation
Salesforce.com Inc.
Microsoft Corporation
- *Disclaimer: Major Players sorted in no particular order
Recent Industry Developments
- March 2025: Findable secured EUR 9 million (USD 10.17 million) Series A funding led by Point Nine Capital to expand its AI-driven property-management platform across Europe.
- January 2025: CoStar Group completed its USD 5.9 billion acquisition of Matterport, combining commercial real estate data with 3D visualization technology.
- December 2024: FinCEN issued final rules requiring electronic reporting of residential real-estate transfers to legal entities, effective Dec 2025.
- October 2024: U.S. banking regulators adopted quality-control standards for automated valuation models, effective Oct 2025.
Scope of Report on IT Market In Real Estate Industry
IT solutions in the real estate industry provide real estate agents and firms with accurate data software and business intelligence tools with which customers can use technologies. The IT market in real estate is segmented by deployment (on-premise, cloud), by solution (documentation, accounting, compliance, business intelligence, enterprise resource planning, customer relationship management, and asset management), by end-user (residential and commercial), and by geography.
The market sizes and forecasts are provided in terms of value (USD million) for all the above segments.
| On-Premise |
| Cloud |
| Hybrid |
| Property Management Software |
| Customer Relationship Management |
| Enterprise Resource Planning |
| Business Intelligence and Analytics |
| Document Management |
| Accounting and Finance |
| Compliance and Risk |
| Asset Lifecycle Management |
| Integrated Platform Suite |
| Residential Real Estate Companies |
| Commercial Real Estate Companies |
| Industrial and Logistics |
| Real Estate Investors and REITs |
| Pre-Construction and Planning |
| Construction |
| Sales and Marketing |
| Operations and Maintenance |
| Small and Medium Enterprises |
| Large Enterprises |
| North America | United States |
| Canada | |
| Mexico | |
| South America | Brazil |
| Argentina | |
| Rest of South America | |
| Europe | Germany |
| United Kingdom | |
| France | |
| Italy | |
| Spain | |
| Russia | |
| Rest of Europe | |
| Asia Pacific | China |
| Japan | |
| India | |
| South Korea | |
| Australia | |
| Rest of Asia Pacific | |
| Middle East | Saudi Arabia |
| United Arab Emirates | |
| Turkey | |
| Rest of Middle East | |
| Africa | South Africa |
| Nigeria | |
| Egypt | |
| Rest of Africa |
| By Deployment | On-Premise | |
| Cloud | ||
| Hybrid | ||
| By Solution Type | Property Management Software | |
| Customer Relationship Management | ||
| Enterprise Resource Planning | ||
| Business Intelligence and Analytics | ||
| Document Management | ||
| Accounting and Finance | ||
| Compliance and Risk | ||
| Asset Lifecycle Management | ||
| Integrated Platform Suite | ||
| By End User | Residential Real Estate Companies | |
| Commercial Real Estate Companies | ||
| Industrial and Logistics | ||
| Real Estate Investors and REITs | ||
| By Property Lifecycle Phase | Pre-Construction and Planning | |
| Construction | ||
| Sales and Marketing | ||
| Operations and Maintenance | ||
| By Organization Size | Small and Medium Enterprises | |
| Large Enterprises | ||
| By Geography | North America | United States |
| Canada | ||
| Mexico | ||
| South America | Brazil | |
| Argentina | ||
| Rest of South America | ||
| Europe | Germany | |
| United Kingdom | ||
| France | ||
| Italy | ||
| Spain | ||
| Russia | ||
| Rest of Europe | ||
| Asia Pacific | China | |
| Japan | ||
| India | ||
| South Korea | ||
| Australia | ||
| Rest of Asia Pacific | ||
| Middle East | Saudi Arabia | |
| United Arab Emirates | ||
| Turkey | ||
| Rest of Middle East | ||
| Africa | South Africa | |
| Nigeria | ||
| Egypt | ||
| Rest of Africa | ||
Key Questions Answered in the Report
How large is the IT Market in Real Estate Industry market in 2026?
The market stands at USD 12.56 billion in 2026 with an 7.99% CAGR outlook to 2031.
Which segment shows the fastest revenue growth through 2031?
Business intelligence and analytics solutions expand at an 8.01% CAGR as owners pursue data-driven asset strategies.
Why are cloud deployments dominating technology budgets?
Cloud solutions captured 55.92% share in 2025 because they reduce upfront capital outlays and cut rollout times to under 45 days.
What drives investor demand for ESG reporting modules?
Emerging disclosure laws in Europe and the United States compel real-time tracking of emissions, water use, and other sustainability metrics.
Which region offers the highest growth potential?
Asia Pacific leads with a 8.76% CAGR, propelled by smart-city funding, rapid urbanization, and expanding institutional ownership.
What is the primary cyber-security risk facing property-technology stacks?
Multi-tenant SaaS environments consolidate sensitive data, and rising breach incidents highlight the need for rigorous zero-trust safeguards.


