Iran Agriculture Market Size and Share
Iran Agriculture Market Analysis by Mordor Intelligence
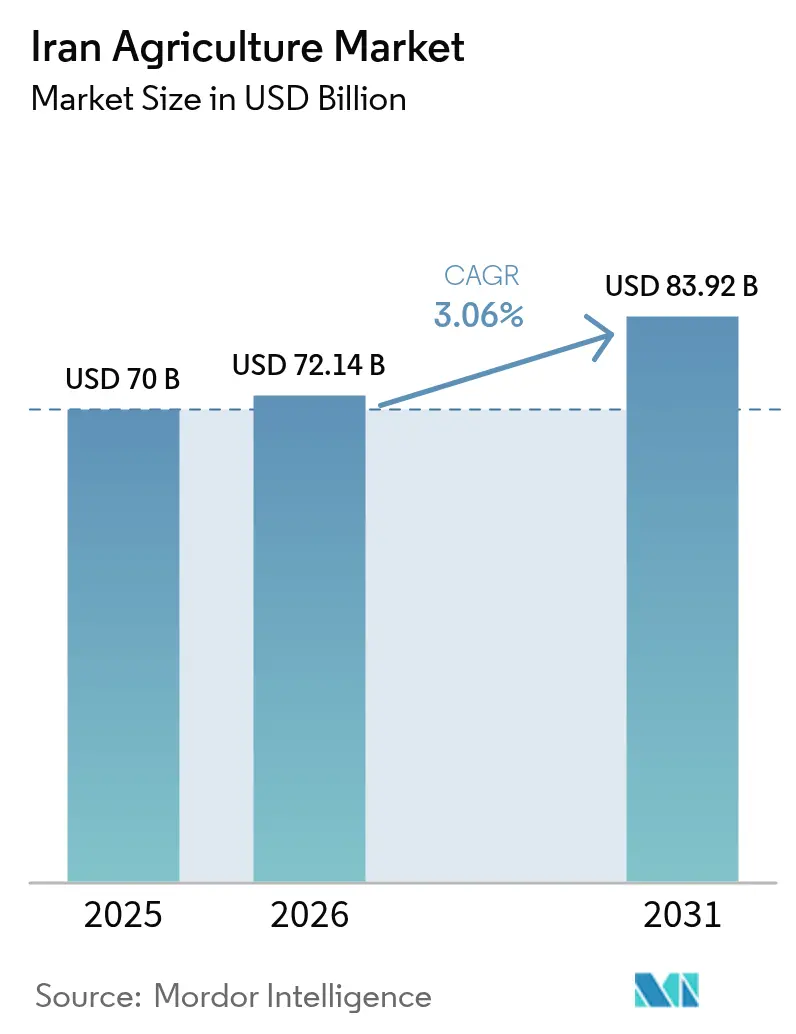
The Iran agriculture market size was valued at USD 70 billion in 2025 and estimated to grow from USD 72.14 billion in 2026 to reach USD 83.92 billion by 2031, at a CAGR of 3.06% during the forecast period (2026-2031). Solid government investment, valued at USD 35 million for irrigation modernization, anchors stable expansion even as water scarcity and sanctions complicate day-to-day farming operations[1]Source: Ali Rezaei, “Water Scarcity and Modern Irrigation Adoption in Iran,” Shenasname, shenasname.ir. Cereals hold the largest Iran agriculture market share, yet decisive policy shifts now favor high-value fruits, vegetables, and specialty crops destined for export, cushioning farmers against domestic price volatility. New trade corridors negotiated with China and BRICS partners expand market reach for pistachios, saffron, and fresh citrus, creating fresh income streams that reinforce rural livelihoods. Fragmented farm structures limit large-scale mechanization, but targeted subsidy schemes, technology transfers, and precision irrigation are steadily narrowing productivity gaps.
Key Report Takeaways
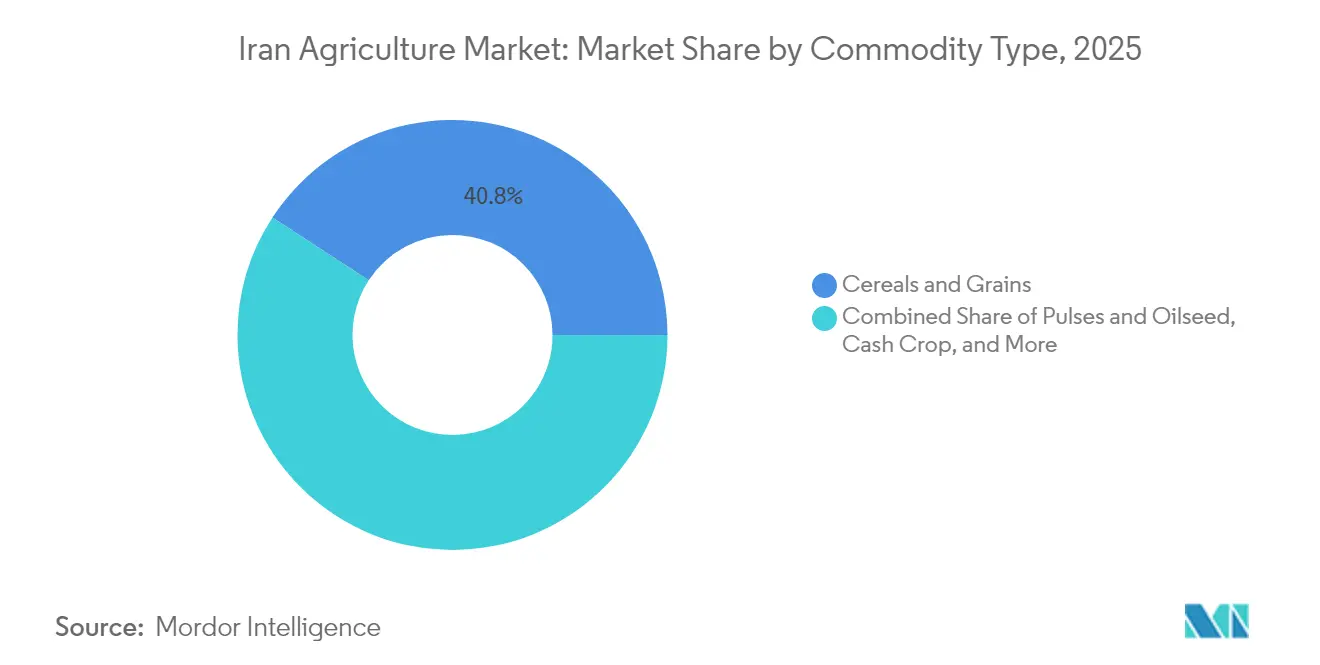
- By commodity type, cereals and grains led with 40.80% of Iran agriculture market share in 2025, while fruits and vegetables are forecast to expand at a 5.48% CAGR through 2031.
Note: Market size and forecast figures in this report are generated using Mordor Intelligence’s proprietary estimation framework, updated with the latest available data and insights as of 2026.
Iran Agriculture Market Trends and Insights
Drivers Impact Analysis*
| Driver | (~) % Impact on CAGR Forecast | Geographic Relevance | Impact Timeline |
|---|---|---|---|
| Digital irrigation and on-farm IoT adoption | +0.8% | National, concentrated in Fars and Tehran provinces | Medium term (2-4 years) |
| Expansion of domestic high-tech greenhouses | +0.6% | National, with early gains in Kerman and Yazd | Long term (≥ 4 years) |
| Government wheat-price guarantees and input subsidies | +0.4% | National, the strongest impact in grain-producing regions | Short term (≤ 2 years) |
| Growing demand for high-value horticulture exports | +0.7% | National, export-oriented provinces | Medium term (2-4 years) |
| Rise of agrifood e-commerce platforms | +0.3% | National, urban-adjacent agricultural zones | Short term (≤ 2 years) |
| Ag-startup financing via National Innovation Fund | +0.2% | National, technology hubs in major cities | Long term (≥ 4 years) |
| Source: Mordor Intelligence | |||
Digital Irrigation and On-Farm IoT Adoption
Water scarcity has catalyzed the rapid adoption of precision irrigation technologies, with the government allocating USD 35 million specifically for modern irrigation infrastructure in 2024. Government mandates requiring smart water meters on all legal wells are accelerating farmer adoption, creating a USD 200-300 million annual market for irrigation technology providers. The convergence of water scarcity and digital solutions positions Iran as a testing ground for next-generation precision agriculture technologies adapted to arid climates.
Expansion of Domestic High-Tech Greenhouses
Iran's greenhouse sector has emerged as a critical component of agricultural modernization, with controlled environment agriculture offering yields up to 10 times higher than traditional field cultivation while using 90% less water[2]Source: Hossein Darvish, “Greenhouse Performance under Semi-Arid Conditions,” MDPI, mdpi.com. The sector benefits from Iran's abundant natural gas resources, providing cost-effective heating for year-round production cycles that can generate 3-4 harvests annually compared to single outdoor seasons. Integration of AI-powered environmental control systems enables precision management of temperature, humidity, and CO2 levels to optimize plant growth and resource utilization.
Government Wheat-Price Guarantees and Input Subsidies
Iran's agricultural subsidy framework provides critical income stability for grain producers through guaranteed minimum prices and input cost support, with the 2024 budget allocating substantial resources for wheat procurement at predetermined rates. The government's commitment to purchasing domestic wheat at guaranteed prices shields farmers from volatile international commodity markets while supporting food security objectives through strategic grain reserves. Fertilizer subsidies have become increasingly important as international sanctions limit access to imported agricultural inputs, with domestic production facilities receiving government support to maintain farmer access to essential nutrients.
Growing Demand for High-Value Horticulture Exports
Iran's strategic shift toward high-value agricultural exports has accelerated following recent trade agreements, particularly the landmark approval for citrus exports to China, which opens access to a market consuming over 70 million tons of citrus annually[3]Source: Zahra Vakili, “Post-Harvest Losses in Iranian Horticulture,” Acta Horticulturae, actahort.org. Post-harvest technology investments, including advanced drying systems for pistachios that reduce processing time by 40% while maintaining product quality, are enhancing export competitiveness. Trade facilitation through digital platforms and improved logistics networks are reducing export transaction costs and enabling smaller producers to access international markets.
Restraints Impact Analysis*
| Restraint | (~) % Impact on CAGR Forecast | Geographic Relevance | Impact Timeline |
|---|---|---|---|
| Severe aquifer depletion and water-bankruptcy zones | -1.2% | National, critical in the central and southern regions | Long term (≥ 4 years) |
| Sanctions restricting access to farm inputs | -0.7% | National, affecting technology and input imports | Medium term (2-4 years) |
| Fragmented land holdings limiting mechanization scale-up | -0.8% | National, particularly affecting smallholder regions | Long term (≥ 4 years) |
| Post-harvest loss due to cold-chain gaps | -0.5% | National, concentrated in fruit and vegetable regions | Medium term (2-4 years) |
| Source: Mordor Intelligence | |||
Severe Aquifer Depletion and Water-Bankruptcy Zones
Iran confronts an unprecedented water crisis with major reservoirs operating at critically low levels, including the Amir Kabir and Latyan dams serving Tehran at only 13% capacity, forcing consideration of emergency water rationing measures. The crisis has forced fundamental changes in cropping patterns, with farmers abandoning water-intensive crops and shifting toward drought-resistant varieties, though this transition constrains overall agricultural output. Emergency measures, including deep well drilling, risk contaminating remaining groundwater supplies, creating potential public health disasters that could further destabilize rural agricultural communities.
Fragmented Land Holdings Limiting Mechanization Scale-Up
Iran's agricultural sector is characterized by extreme land fragmentation, with average farm sizes below 2 hectares creating fundamental barriers to mechanization adoption and economies of scale realization. Research in Fars Province indicates that household income, per capita arable land, and family size significantly influence fragmentation patterns, with social and cultural factors often preventing consolidation efforts.
*Our forecasts treat driver/restraint impacts as directional, not additive. The impact forecasts reflect baseline growth, mix effects, and variable interactions.
Segment Analysis
By Commodity Type: Cereals Lead While Fruits Accelerate
Cereals and Grains commanded the largest market share at 40.80% in 2025, reflecting Iran's strategic emphasis on food security through domestic grain production supported by government price guarantees and input subsidies. The segment benefits from established infrastructure and farmer expertise, though productivity constraints from aging machinery and water limitations constrain growth potential.
Fruits and Vegetables represent the fastest-growing segment with a 5.48% CAGR through 2031, driven by export market expansion and higher profit margins that incentivize farmer adoption despite increased production complexity. Recent market access agreements with China for citrus exports and strengthened trade relationships with BRICS partners are accelerating this segment's growth trajectory.


Geography Analysis
Iran's agricultural geography reflects diverse climatic zones and water availability patterns that fundamentally shape production capabilities and market dynamics across the country. The northern provinces, including Mazandaran and Gilan, benefit from higher precipitation levels and more favorable growing conditions, supporting rice production and diverse horticultural crops despite facing projected temperature increases of 0.82-1.1°C and precipitation decreases of 7.1-31.3 mm through 2050.
Central provinces, particularly Fars and Isfahan, serve as major grain production centers with mechanization levels significantly above national averages, though they face acute water stress from depleted aquifers and reduced river flows. The Zayandeh Rud basin in central Iran exemplifies the challenges facing agricultural regions, with population growth from 420,000 in 1956 to 2.3 million by 2000, creating unsustainable water demand that threatens long-term agricultural viability.
Southern and eastern provinces are adapting to extreme water scarcity through the adoption of drought-resistant crops and advanced irrigation technologies, with some regions exploring fog water harvesting as an alternative water source capable of yielding 25-65 liters per square meter daily. Climate change projections indicate southern regions may face extreme heat and drought conditions that could force fundamental shifts in agricultural land use, while northern areas might experience increased precipitation and flood risks requiring adaptive management strategies.
Recent Industry Developments
- May 2025: Iran and Turkmenistan have reached an agreement to collaborate on artificial intelligence initiatives aimed at satellite-based crop monitoring and optimizing water resources.
- September 2022: China has officially opened its market to Iranian oranges, mandarins, and sweet lemons, adhering to protocols that include orchard registration and cold-treatment standards.


Research Methodology Framework and Report Scope
Market Definitions and Key Coverage
Our study defines the agriculture market in Iran as the cumulative farm-gate and first-stage processing value of all crop, livestock, fishery, and forestry output produced inside the country, expressed in constant 2025 U.S. dollars. The figure therefore reflects genuine sector value added rather than simple gross output.
Scope exclusion: craft beverages, tobacco, and fully processed foods beyond the primary stage are left outside the boundary.
Segmentation Overview
- By Commodity Type
- Cereals and Grains
- Production Analysis (Volume)
- Consumption Analysis (Value and Volume)
- Export Analysis (Value and Volume)
- Import Analysis (Value and Volume)
- Price Trend Analysis
- Pulses and Oilseed
- Production Analysis (Volume)
- Consumption Analysis (Value and Volume)
- Export Analysis (Value and Volume)
- Import Analysis (Value and Volume)
- Price Trend Analysis
- Fruits and Vegetables
- Production Analysis (Volume)
- Consumption Analysis (Value and Volume)
- Export Analysis (Value and Volume)
- Import Analysis (Value and Volume)
- Price Trend Analysis
- Cash Crop
- Production Analysis (Volume)
- Consumption Analysis (Value and Volume)
- Export Analysis (Value and Volume)
- Import Analysis (Value and Volume)
- Price Trend Analysis
- Cereals and Grains
Detailed Research Methodology and Data Validation
Primary Research
Mordor analysts held structured calls with agronomists, irrigation-equipment distributors, cold-chain operators, and provincial farm unions across Tehran, Kerman, Fars, and East Azerbaijan. These conversations tested subsidy pass-through rates, typical farm margins, and expected yield shifts, letting us challenge desk assumptions and fine-tune elasticities.
Desk Research
We began by mapping supply volumes through non-paywalled sources such as FAOSTAT harvest statistics, the Statistical Center of Iran's quarterly agriculture GDP series, Customs ledgers, and Ministry of Energy irrigation bulletins. News archives on Dow Jones Factiva and budget releases provided price floors, subsidy shifts, and drought alerts that might distort the time series. Company filings gathered on D&B Hoovers added cost benchmarks, while trade association notes sharpened export trends. The sources cited here are illustrative only; many additional documents were reviewed to confirm patterns and close gaps.
Market-Sizing & Forecasting
We apply a top-down reconstruction that multiplies official production tonnage by average realized farm-gate prices to arrive at the 2025 baseline. Then we corroborate the result with selective bottom-up supplier roll-ups and channel checks. Key variables like cropland under irrigation, fertilizer application intensity, government guaranteed-price budgets, precipitation anomalies, and horticulture export receipts drive model sensitivity. Forecasts employ multivariate regression with scenario overlays so we can stress water scarcity or sanction relief cases. Missing cells are imputed using three-year moving averages vetted during expert interviews.
Data Validation & Update Cycle
We run outputs through peer review, variance scans against satellite crop health indices, and cross-checks with the latest FAO revisions. Models refresh annually, with interim updates whenever tariff changes, extreme weather, or currency swings materially alter a key driver.
Why Mordor's Iran Agriculture Baseline Earns Investor Trust
Published figures often differ because each firm selects its own scope, price stack, and refresh cadence, which can easily skew totals.
Key gap drivers include narrower commodity coverage, exclusion of post-farm-gate uplift, and older base years used by some publishers, all of which pull their estimates away from the ground reality that we observe.
Benchmark comparison
| Market Size | Anonymized source | Primary gap driver |
|---|---|---|
| USD 70 B (2025) | Mordor Intelligence | |
| USD 70 B (2024) | Regional Consultancy A | Uses unadjusted nominal prices and omits on-ground price verification |
| USD 51.9 B (2023) | Data Portal B | Counts only producer value added; exits primary processing and inventory revaluation |
| USD 0.07 B (2023) | Boutique Analyst C | Samples revenues of registered agro-corporates, ignoring informal and smallholder output |
The comparison shows that our step-wise build, live expert inputs, and yearly refresh offer a balanced, transparent baseline that decision-makers can reproduce and trust.


Key Questions Answered in the Report
How large is the Iran agriculture market today?
The Iran agriculture market reached USD 72.14 billion in 2026 and is forecast to reach USD 83.92 billion by 2031, expanding at a 3.06% CAGR.
Which commodity holds the largest share within the Iran agriculture market?
Cereals and grains led with 40.80% of Iran agriculture market share in 2025 due to government price guarantees and input subsidies.
What is the fastest-growing segment in Iran agriculture market?
Fruits and vegetables are projected to grow at a 5.48% CAGR through 2031, supported by greenhouse expansion and new export agreements.
Why are high-tech greenhouses important for Iran agriculture market?
Greenhouses boost yield up to ten times, cut water use by 90%, and enable year-round production, making them central to export growth and water conservation goals.
How do water shortages affect Iran agriculture market growth?
Aquifer depletion and reservoir shortages exert a −1.2% drag on CAGR, forcing crop shifts, irrigation upgrades, and stricter groundwater regulations.
What role do subsidies play in Iran’s cereal production?
Guaranteed wheat procurement prices and fertilizer subsidies stabilize farmer income, support domestic grain reserves, and maintain cereal dominance despite resource constraints.
Page last updated on:


