Israel Agriculture Market Analysis by Mordor Intelligence
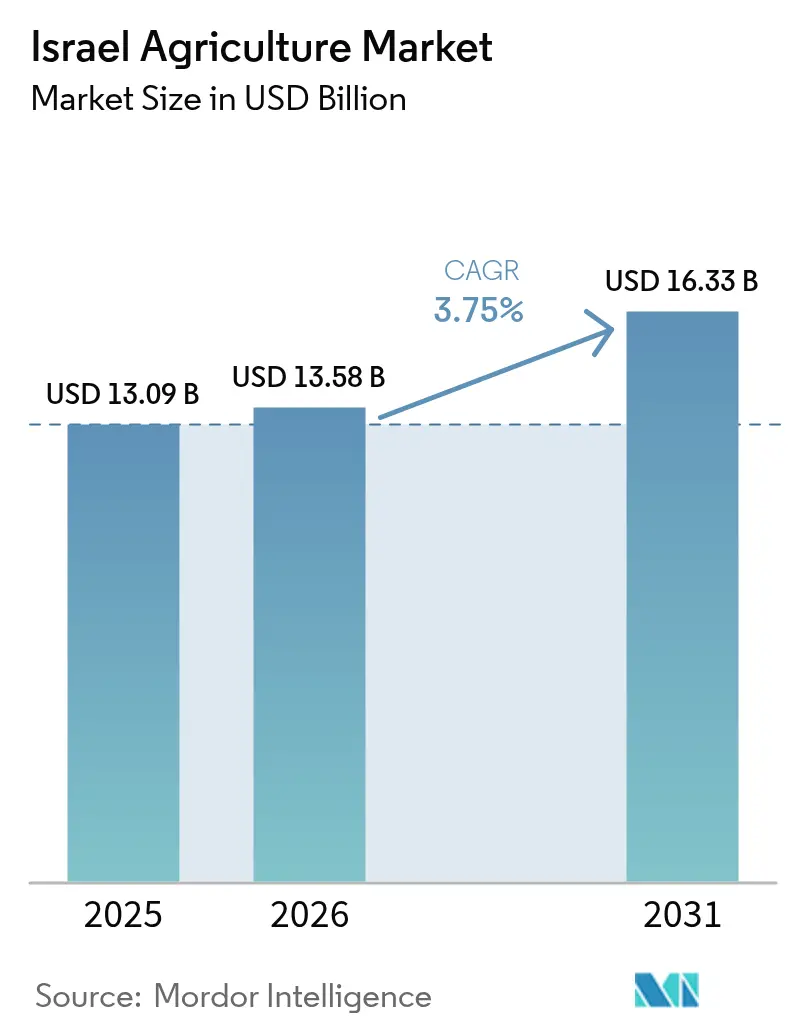
The Israel Agriculture Market size was valued at USD 13.09 billion in 2025 and estimated to grow from USD 13.58 billion in 2026 to reach USD 16.33 billion by 2031, at a CAGR of 3.75% during the forecast period (2026-2031). Accelerating investment in agrifood technology, abundant desalinated water, and a renewed national focus on food security create favorable tailwinds for the Israel agriculture market. Precision irrigation uptake, government Research and Development subsidies, and rising specialty-crop exports collectively lift margins even as producers confront high labor costs. Capital inflows of USD 2.80 billion into more than 400 Israeli agrifood-tech companies in 2023 underscore investor confidence. Desalinated water priced near USD 0.40 per metric ton gives growers a cost-predictable input base, while the rapid scale-up of sensor-guided fertigation curbs fertilizer waste. Together, these forces position the Israel agriculture market for stable yet innovation-led expansion through 2030.
Key Report Takeaways
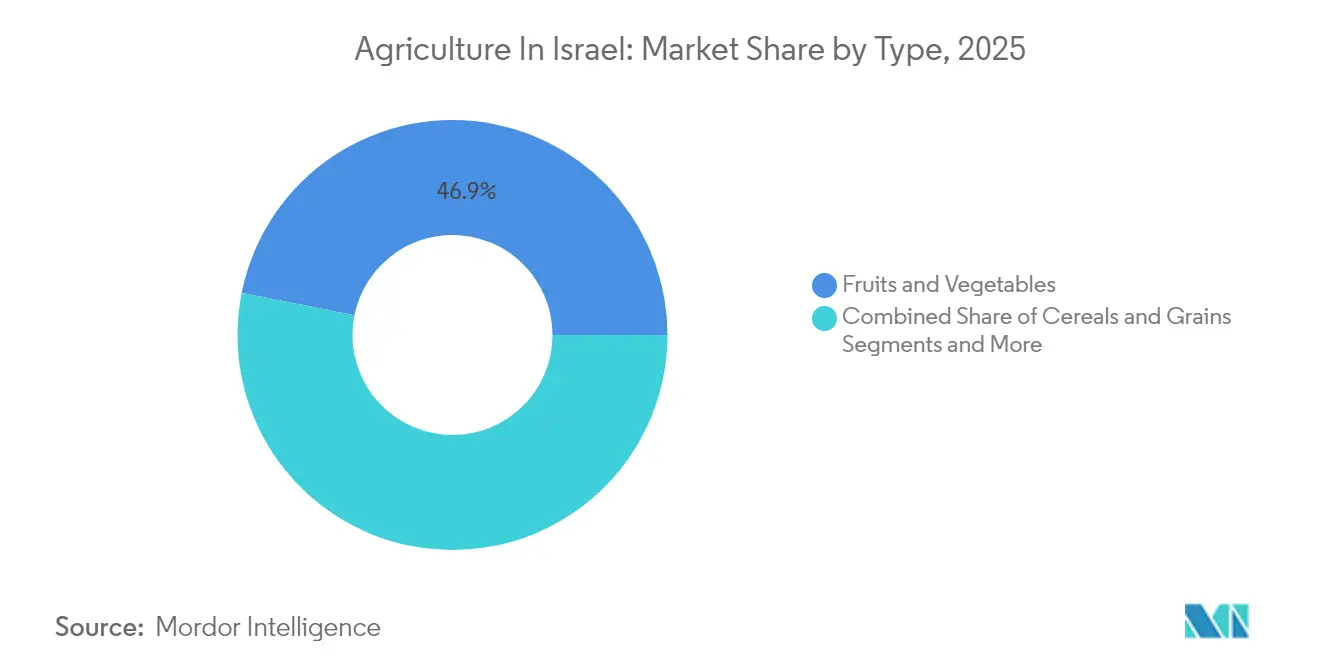
- By type, Fruits and Vegetables led with 46.85% of Israel agriculture market share in 2025, and Commercial Crops are forecast to expand at a 4.23% CAGR by 2031.
Note: Market size and forecast figures in this report are generated using Mordor Intelligence’s proprietary estimation framework, updated with the latest available data and insights as of 2026.
Israel Agriculture Market Trends and Insights
Drivers Impact Analysis*
| Driver | (~) % Impact on CAGR Forecast | Geographic Relevance | Impact Timeline |
|---|---|---|---|
| Advancement in agricultural technology | +1.2% | Northern and Southern Districts | Medium term (2-4 years) |
| Favorable government initiatives and subsidies | +0.8% | National, periphery focus | Short term (≤ 2 years) |
| Widespread precision-irrigation adoption | +0.7% | Negev and Arava regions | Long term (≥ 4 years) |
| Post-conflict food-security imperatives | +0.6% | Gaza Envelope recovery | Short term (≤ 2 years) |
| Regenerative desert-farming export boom | +0.4% | Southern District and Negev | Long term (≥ 4 years) |
| Pesticide Ban by Importing Countries Creating Export Window | +0.3% | EU-oriented markets | Medium term (2-4 years) |
| Source: Mordor Intelligence | |||
Advancement in Agricultural Technology
Venture investors continue to fund Israeli crop science and ag-automation firms at scale. Greeneye Technology closed a USD 20 million Series A in April 2024 to commercialize AI-enabled spot spraying that cuts herbicide use by 88% while protecting yields. Netafim augmented its drip-irrigation leadership with real-time plant-monitoring software through an October 2024 partnership with Phytech, enabling irrigation that follows actual sap flow rather than set schedules. This integration of sensors, computer vision, and machine learning accelerates on-farm decision-making and reinforces Israel’s reputation as a global exporter of water-efficient know-how. A USD 500 million debt package secured by Netafim in late 2024 further signals institutional appetite for scaling Israeli water tech. As platforms mature from pilots to revenue-generating tools, technology adoption is anticipated to raise average yields and keep the Israel agriculture market on its current growth arc.
Favorable Government Initiatives and Subsidies
Institutional realignment came in June 2024 when the ministry was rebranded the Ministry for Agriculture and Food Security, reflecting heightened strategic priority. The Renewal Administration now channels targeted reconstruction grants toward automation, irrigation, and protected cultivation infrastructure. Israel’s Innovation Authority earmarked additional agritech Research and Development funding for peripheral regions to narrow the center-periphery income gap. KANAT’s disaster-insurance framework keeps liquidity available for growers facing climate or conflict disruptions. Meanwhile, the extended United States-Israel Agricultural Trade Agreement assures duty-free access for certain exports through 2025, tempering near-term demand volatility.[1]U.S. Federal Register, “Extension of the United States-Israel Agricultural Trade Agreement,” federalregister.gov These coordinated policies shorten payback periods on capital investments and underpin the Israel agriculture market’s steady expansion.
Widespread Precision-Irrigation Adoption
Sensor-driven irrigation is evolving beyond conventional drip lines. Treetoscope’s in-tree sap sensors, backed by USD 7 million in early 2024 seed capital, deliver real-time data on water uptake to optimize irrigation volumes and timing. Five large seawater desalination plants already supply more than 50% of national freshwater, enabling growers to tap a cost-stable supply priced at USD 0.40 per metric ton. Academic-industry collaboration through the AGRISOL project piloted solar-powered desalination for farms straddling the Israel-Jordan border, illustrating a scalable model for arid-zone cultivation.[2]Ben-Gurion University of the Negev, “AGRISOL Solar Desalination Field Trial,” bgu.ac.il Fertigation specialists such as Haifa Group now combine precision irrigation with nutrient dosing to elevate yield per liter applied. AI-enhanced modeling from Phytech forecasts water demand based on micro-climate data, further reducing resource waste. These innovations collectively sustain the Israel agriculture market’s productivity gains even under water scarcity.
Post-Conflict Food-Security Imperatives
The Gaza Envelope supplied over half of the nation’s caloric intake before recent hostilities, spotlighting a geographic concentration risk. Field surveys by Israel’s northern district authorities show 89% of growers enduring conflict-related damage, creating urgency for protected cultivation and automation investment. Temporarily halting tomato imports in 2024 to shield domestic producers indicates a policy shift that privileges local production when feasible. Grants now prioritize robotics that reduces labor dependency, mitigating future harvest interruptions. The ministry’s food-security mandate integrates agricultural resilience into broader national-security planning, ensuring multi-year budget allocations for technology-based recovery. This imperative injects both public and private capital into the Israel agriculture market and accelerates the adoption of labor-saving equipment.
Restraints Impact Analysis*
| Restraint | (~) % Impact on CAGR Forecast | Geographic Relevance | Impact Timeline |
|---|---|---|---|
| Dependence on staple-crop imports | -0.9% | National supply chain | Short term (≤ 2 years) |
| High production costs and labor shortages | -0.6% | Conflict-affected zones | Medium term (2-4 years) |
| Climatic-insurance premium inflation | -0.4% | Peripheral regions | Long term (≥ 4 years) |
| Regional trade-route disruptions | -0.3% | Export-oriented sectors | Short term (≤ 2 years) |
| Source: Mordor Intelligence | |||
Dependence on Staple-Crop Imports
Domestic wheat output is forecast to dip to 90,000 metric tons in the 2025-2026 season, trailing the five-year average of 108,000 metric tons, forcing mills to continue sourcing from the Black Sea Basin.[3]Foreign Agricultural Service, “Israel Grain and Feed Annual 2025,” usda.gov The sudden halt of Turkish produce shipments in 2024 required rapid supply-chain rerouting for tomatoes, olive oil, and cucumbers. Israel also imports 70% of laying-hen feed and most live cattle shipments, underscoring its exposure to external shocks. Switzerland, the Netherlands, and the United States together shipped about USD 1.16 billion in foodstuffs to Israel in 2024. Long-term liberalization reduced producer subsidies and amplified import reliance, complicating domestic self-sufficiency goals. This dependency subtracts an estimated 0.9 percentage points from the forecast CAGR for the Israel agriculture market.
High Production Costs and Labor Shortages
Conflict-driven labor gaps hampered about 70% of poultry operations in the southern corridor in 2024. Wage pressures amplify greenhouse heating and irrigation-pumping costs, while volatile energy markets squeeze already thin margins. KANAT’s rising payout ratio to farmers drives premium increases that elevate fixed costs. Although desalinated water remains affordable, electricity tariffs for pumping systems erode the advantage. Automation mitigates labor risk, but capital expenditure remains prohibitive for smallholders, accelerating consolidation inside the Israel agriculture market.
*Our forecasts treat driver/restraint impacts as directional, not additive. The impact forecasts reflect baseline growth, mix effects, and variable interactions.
Segment Analysis
By Type: Commercial Crops Drive Innovation
Fruits and Vegetables retained leadership with a 46.85% share of Israel agriculture market share in 2025, thanks to Mediterranean micro-climates and mature logistics links to European buyers. EU importers purchased EUR 979 million (USD 1.12 billion) worth of Israeli horticultural produce in 2024. Sensor-guided fertigation slashed nutrient runoff and bolstered shelf life. Meanwhile, cereals and grains slowed as wheat output lagged behind rainfall cycles, although barley held steady at 14,000 metric tons. Oilseeds, led by sunflower seed, are slated to grow 33% to 4,000 metric tons by 2025-2026, aided by precision seeding and pest-prediction analytics. Start-ups like Wonder Veggies, which raised USD 3 million to launch probiotic lettuce in 2025, reveal how biotech can reposition even mature categories. As technology percolates across crop types, Israel agriculture market participants extract higher margins from each irrigated hectare.
Commercial Crops commanded the fastest growth path with a 4.23% CAGR projected for 2026-2031, reflecting Israel’s pivot toward high-margin specialty output. In value terms, Commercial Crops will account for USD 4.23 billion of Israel agriculture market size by 2031, up from USD 3.44 billion in 2026. Export-oriented greenhouse systems enable premium strawberries, herbs, and flowers to hit EU shelves year-round. Technology layers such as AI-assisted climate control and robotic harvesters lift labor productivity, enticing institutional investors. Cotton harvests climbed from 40,000 to 65,000 bales between the 2024-2025 and 2025-2026 seasons, illustrating how climate-controlled programs can revive erstwhile marginal crops.


Geography Analysis
The Northern District commanded a prominent role in the national agricultural output, giving it the single-largest Israel agriculture market share. Higher rainfall and the presence of research hubs such as MIGAL foster biotechnology and precision-farming breakthroughs that bolster orchard, dairy, and poultry yields. Haifa District leverages its coastal location for intensive vegetable production and functions as a logistics gateway through nearby ports, while the more urbanized Central and Tel-Aviv Districts increasingly turn to high-value crops and vertical-farming projects to offset shrinking farmland.
The Southern District is projected to expand, adding momentum to the Israel agriculture market as greenhouse complexes and desert-farming innovations scale across the Negev and Arava valleys. Haifa Group’s ammonia and solar-powered infrastructure anchors large-scale cultivation in this arid zone. Before recent hostilities, the Gaza Envelope supplied 75% of national vegetable output and 20% of fruit production, underscoring its strategic role in food security. Advanced greenhouse designs and precision-irrigation systems support year-round harvests that compete effectively in export markets despite harsh climatic conditions.
Israel’s National Water Carrier moves fresh water from northern sources to southern farms, enabling crop production in regions that would otherwise remain uncultivated. The Innovation Authority’s peripheral development program channels agritech grants to both northern and southern districts, stimulating innovation-led rural growth. Jerusalem District, though land-constrained, contributes through specialized research and policy formulation that guide national strategies. The rapid adoption of desert agriculture techniques has generated exportable expertise, positioning the southern model as a blueprint for sustainable farming in arid economies worldwide.
Recent Industry Developments
- May 2025: Madagascar has established a USD 90 million agreement with Israel's LR Group to implement a smart agriculture project spanning 10,000 hectares across four regions. The program aims to enhance food self-sufficiency by supporting over 10,000 small farmers through the integration of solar irrigation systems, artificial intelligence, hybrid seeds, and satellite tracking technologies.
- April 2025: India and Israel signed an agriculture agreement to strengthen cooperation in soil and water management, seed improvement, and agricultural technology development. The agreement focuses on climate resilience, food security, and expanding the Indo-Israel Centers of Excellence network to support small-scale farmers.
- February 2025: The Israel-Hamas conflict disrupted Israel's domestic agriculture in 2024, leading to a 13% increase in fruit and vegetable imports, reaching 227,000 metric tons. The country increased imports of apples, onions, garlic, and pineapples from suppliers, China, Costa Rica, and the Netherlands, to compensate for reduced local production in conflict-affected areas.


Research Methodology Framework and Report Scope
Market Definitions and Key Coverage
Our study defines Israel's agriculture market as the aggregate farm-gate value generated within the country from crop cultivation (cereals, oilseeds, pulses, fruits, vegetables, commercial crops) together with livestock and aquaculture products destined for food, feed, or fiber.
Greenhouse ornamentals, forestry operations, and downstream food-processing revenues are intentionally excluded.
Segmentation Overview
- By Type (Production Analysis (Volume), Consumption Analysis (Value and Volume), Import Analysis (Value and Volume), Export Analysis (Value and Volume), and Price Trend Analysis)
- Cereals and Grains
- Oilseeds and Pulses
- Fruits and Vegetables
- Commercial Crops
Detailed Research Methodology and Data Validation
Primary Research
We interviewed agronomists, cooperative managers, input distributors, and produce exporters across Galilee, the Jordan Valley, and the Negev. Their perspectives helped calibrate unreported contract prices, seasonality shifts, and irrigation cost changes, closing gaps left by public statistics.
Desk Research
Mordor analysts start with public datasets from Israel's Central Bureau of Statistics, FAO FAOSTAT, OECD agricultural policy reviews, UN Comtrade shipment logs, and USDA Foreign Agricultural Service reports. Complementary insight is drawn from trade-association white papers, peer-reviewed journals, company 10-Ks and investor presentations, plus paid intelligence platforms such as D&B Hoovers and Dow Jones Factiva. These feeds establish historic production volumes, farm-gate pricing, import-export balances, and subsidy levers. The list is not exhaustive; many additional reputable references supported data validation.
Market-Sizing & Forecasting
A top-down build converts official production tonnage into value using weighted farm-gate prices, which are then cross-checked through sampled supplier roll-ups and channel checks. Key variables like cultivated area, yield per hectare, desalinated-water availability, export parity prices, and drip-irrigation adoption rates drive scenario inputs. Forecasts to 2030 employ multivariate regression augmented by ARIMA to capture rainfall anomalies; expert consensus adjusts outliers before lock-in.
Data Validation & Update Cycle
Every draft model passes variance testing against macro indicators such as agricultural GDP share and food CPI, followed by a two-step peer review. Reports refresh annually, with interim updates when droughts, subsidy reforms, or major conflicts materially shift assumptions. Clients therefore receive the latest vetted baseline.
Why Mordor's Israel Agriculture Baseline Commands Reliability
Published estimates often diverge because firms select different commodity baskets, price points, and conversion dates. By adhering to farm-gate definitions, yearly refreshes, and multi-source triangulation, Mordor delivers a stable, transparent baseline.
Key gap drivers include rival scopes that omit aquaculture, apply wholesale rather than farm-gate prices, refresh once every three years, or translate shekel data to dollars at period-average rates instead of year-end.
Benchmark comparison
| Market Size | Anonymized source | Primary gap driver |
|---|---|---|
| USD 13.09 B (2025) | Mordor Intelligence | |
| USD 13.10 B (2024) | Regional Consultancy A | Uses 2024 average FX and limited primary validation |
| USD 8.80 B (2026) | Global Consultancy B | Excludes livestock and aquaculture; values only farm output |
| USD 3.50 B (2025) | Trade Journal C | Focuses on export-oriented high-value crops, omitting domestic staples |
The comparison shows that when scope and currency practices diverge, totals swing widely. Mordor's disciplined variable selection and yearly reviews give decision-makers the most dependable starting point for strategy.


Key Questions Answered in the Report
What is the current size of the Israel agriculture market?
The market is valued at USD 13.58 billion in 2026 and is forecast to reach USD 16.33 billion by 2031.
Which segment holds the largest share in Israel agriculture market?
Fruits and Vegetables hold the top position, representing 46.85% of Israel agriculture market share in 2025.
Which crop segment is growing fastest in Israel agriculture market?
Commercial Crops lead with a 4.23% forecast CAGR for 2026-2031.
What government policies support growth of Israel agriculture market?
The Renewal Administration’s reconstruction grants, Innovation Authority Research and Development funding, and the Israel-U.S. duty-free trade extension collectively enhance investment conditions.
Page last updated on:


