Ghana Agriculture Market Analysis by Mordor Intelligence
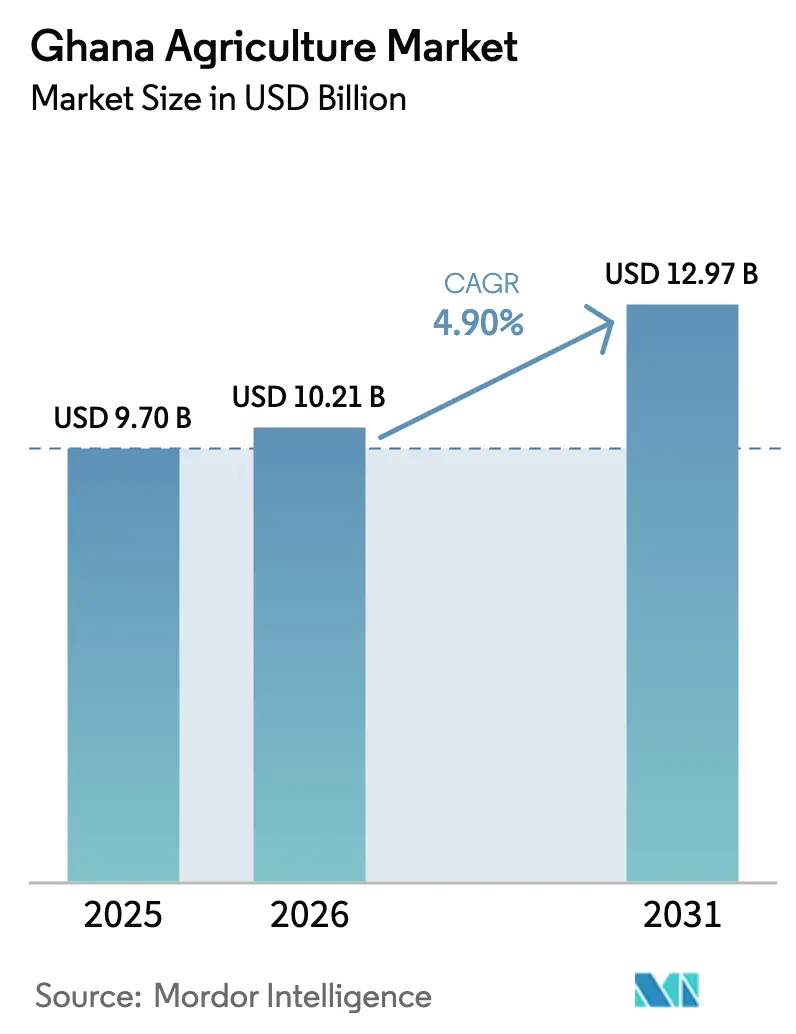
The Ghana agriculture market size was valued at USD 9.70 billion in 2025 and is projected to increase to USD 10.21 billion in 2026, further advancing to USD 12.97 billion by 2031, growing at a CAGR of 4.90% during the forecast period 2026–2031. Cereals remain a staple in domestic caloric intake, and rapid urbanization is driving increased demand for processed foods, convenience vegetables, and export-grade horticultural products. Climate-smart irrigation initiatives and green-bond financing are gradually mitigating weather-related and capital challenges. Nevertheless, productivity gains are limited by land fragmentation, pest infestations, and significant post-harvest losses. Midstream processing is increasingly dominated by entities capable of financing Hazard Analysis and Critical Control Point (HACCP)-certified facilities and cold-chain logistics. Meanwhile, upstream input supply remains fragmented, despite government fertilizer subsidies that reduced per-hectare costs by 40% in 2024. Overall, the market's growth depends on coordinated advancements in credit access, mechanization, and supply chain infrastructure, rather than solely on demand growth.
Key Report Takeaways
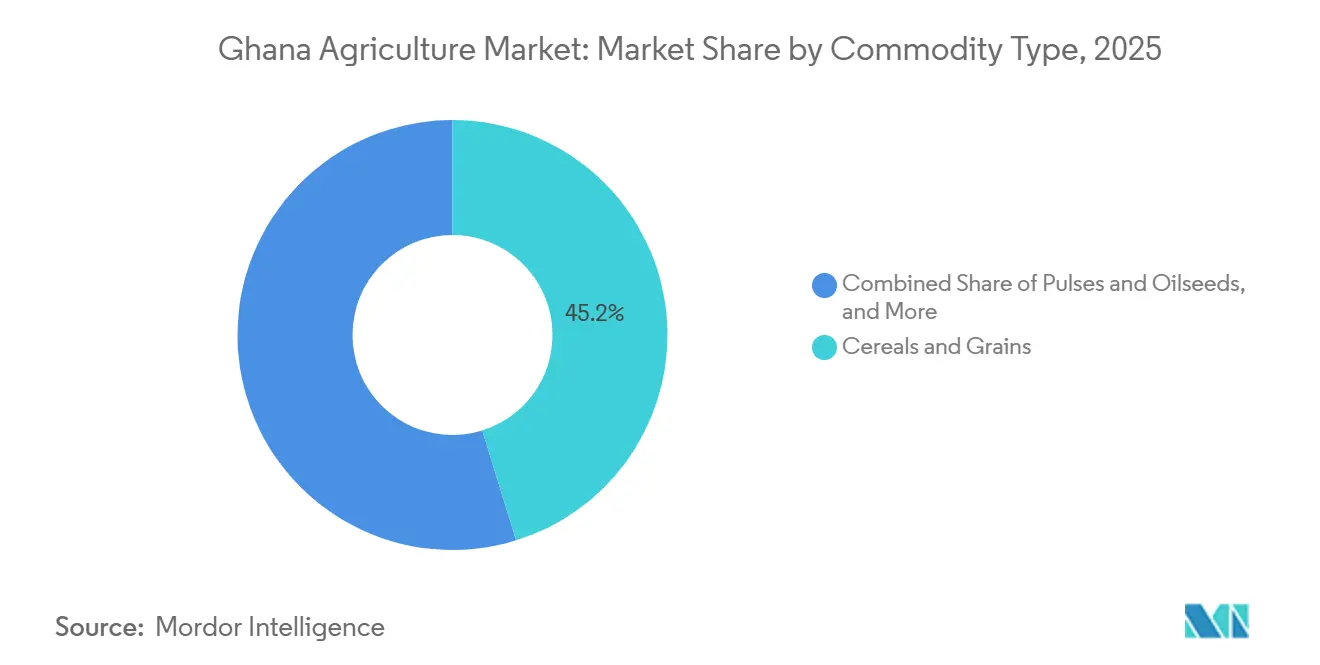
- By commodity type, cereals and grains led with 45.2% of the Ghana agriculture market share in 2025, while fruits are the fastest-growing segment, advancing at a 5.0% CAGR through 2031.
Note: Market size and forecast figures in this report are generated using Mordor Intelligence’s proprietary estimation framework, updated with the latest available data and insights as of January 2026.
Ghana Agriculture Market Trends and Insights
Drivers Impact Analysis*
| Driver | (~) % Impact on CAGR Forecast | Geographic Relevance | Impact Timeline |
|---|---|---|---|
| Growing domestic food demand from rapid urbanization | +1.0% | Greater Accra, Ashanti, and Western regions | Medium term (2-4 years) |
| Expansion of government fertilizer and input-subsidy programs | +0.8% | Northern, Upper East, and Upper West | Short term (≤ 2 years) |
| Public-private climate-smart irrigation rollouts | +0.7% | Northern Savannah, Volta Basin, and coastal plains | Long term (≥ 4 years) |
| Adoption of digital and precision farming platforms | +0.6% | Early uptake in Brong-Ahafo and Eastern regions | Medium term (2-4 years) |
| Introduction of green-bond climate-finance facilities for smallholders | +0.4% | Cocoa, cashew, and horticulture zones nationwide | Medium term (2-4 years) |
| Mainstreaming regenerative practices through cocoa carbon-credit pilots | +0.2% | Western North, Ashanti, Eastern, and Central | Long term (≥ 4 years) |
| Source: Mordor Intelligence | |||
Growing Domestic Food Demand from Rapid Urbanization
Ghana's urban population reached 56.7% in 2021 and is projected to rise to 66.2% by 2050, nearly doubling the number of city dwellers to 34.8 million[1]Source: United Nations Department of Economic and Social Affairs, “World Urbanization Prospects 2024,” un.org. Each percentage-point increase in urbanization is driving a 4% annual growth in processed cereal demand and a 6% annual growth in fresh-cut vegetable demand. This trend creates opportunities for processors that adhere to cold-chain and food-safety standards. Investment is concentrated in Accra and Kumasi, which account for 60% of processed food purchases, while Northern regions remain reliant on low-value bulk sales due to logistical challenges. Blue Skies Holdings' USD 15 million fresh-cut plant in Nsawam demonstrates the potential for value addition, achieving prices three to four times higher than raw fruit. This shift highlights the migration of value capture inland, supported by lower labor costs and improving cold-chain infrastructure. However, without expanded last-mile refrigerated transport, regional demand imbalances may persist, hindering inclusive growth.
Expansion of Government Fertilizer and Input-Subsidy Programs
The Planting for Food and Jobs program set the prices of nitrogen, phosphorus, and potash at GHS 160 (USD 13) and sulfate of ammonia at GHS 125 (USD 10) per 25-kilogram bag in 2024, reducing growers' input costs by 40%[2]Source: Ministry of Food and Agriculture, “Planting for Food and Jobs Annual Report 2024,” mofa.gov.gh. This contributed to a maize output of 3.2 million metric tons in 2024, representing a 14% year-on-year increase. In 2025, disbursement delays of six to eight weeks resulted in 30% of beneficiaries missing optimal application periods, reducing anticipated yield gains by 15%. The widespread use of nitrogen, phosphorus, and potash has lowered soil pH by up to 0.5 units, necessitating unplanned lime applications that increase costs by GHS 150 (USD 12) per hectare. The 2025 budget includes a proposed 15% funding increase but does not incorporate precision-targeting measures based on soil testing and balanced nutrition.
Public-Private Climate-Smart Irrigation Roll-outs
The Ghana Irrigation Development Authority, in collaboration with the International Water Management Institute, aims to increase irrigated land from 12,042 hectares in 2024 to 834,804 hectares by 2047[3]Source: International Water Management Institute, “Irrigation Development in Ghana 2024,” iwmi.cgiar.org. The initial rehabilitation of the Kpong and Tono irrigation schemes added 5,000 hectares in 2024, facilitating dry-season vegetable production for urban markets. Solar pumps, funded by the International Solar Alliance, have reduced water costs to USD 0.12 per cubic meter, compared to USD 0.35 per cubic meter for diesel, making crops like tomatoes and peppers profitable during the off-season. However, only 40% of target communities are connected to the grid, and diesel prices have risen to GHS 15 (USD 1.25) per liter, which restricts adoption to high-value crops. Commercial irrigation schemes near grid lines could support three to four cropping cycles annually, while off-grid plots will require patient capital, with payback periods extending up to seven years.
Introduction of Green-Bond Climate-Finance Facilities for Smallholders
The Ghana Green Finance Facility was launched with USD 50 million in 2024 and had disbursed USD 12 million to 4,800 farmers by midyear. This fell short of the 10,000-farmer target, as 60% of farmers lacked formal land documentation. In January 2025, the facility's capital was increased to USD 75 million, accompanied by relaxed collateral requirements and the introduction of group lending, with the aim of reaching 30,000 new borrowers. Cocoa and cashew growers accounted for 70% of the funds, due to stronger land tenure and longer investment horizons, while cereal farmers received only 15% of the funding.
Restraints Impact Analysis*
| Restraint | (~) % Impact on CAGR Forecast | Geographic Relevance | Impact Timeline |
|---|---|---|---|
| Limited access to affordable finance and credit | -0.7% | Highest gaps in Northern, Upper East, and Upper West | Short term (≤ 2 years) |
| High post-harvest losses from inadequate storage | -0.6% | Northern and Volta see the worst losses | Medium term (2-4 years) |
| Rising pest and disease pressure amid climate change | -0.5% | Fall armyworm in maize belts, swollen shoot in cocoa | Medium term (2-4 years) |
| Land tenure fragmentation hampering mechanization investments | -0.4% | Most acute in Ashanti, Eastern, and Central | Long term (≥ 4 years) |
| Source: Mordor Intelligence | |||
Limited Access to Affordable Finance and Credit
Agriculture accounted for only 4.7% of bank lending in 2024, compared to the government's target of 10% by 2028[4]Source: Bank of Ghana, “Banking Sector Report 2024,” bog.gov.gh. The Agricultural Development Bank provided GHS 800 million (USD 67 million) in loans to 80,000 clients, leaving over two million smallholders dependent on informal money lenders, who charge annualized interest rates as high as 120%. Additionally, 85% of farmland lacks formal titles, preventing access to loans exceeding GHS 5,000 (USD 417), which typically require collateral. A USD 30 million risk-sharing facility guaranteed just 12,000 loans, as commercial banks continued to limit their exposure. Loan approval cycles of eight to 12 weeks during planting season force growers to delay sowing by up to one month, resulting in significant yield reductions.
Rising Pest and Disease Pressure Amid Climate Change
In 2024, the fall armyworm infestation affected over 300,000 hectares, resulting in losses of USD 200 million and increasing pesticide costs to GHS 300 (USD 25) per hectare. Maize lethal necrosis impacted 8,000 hectares in the northern region in 2022, reducing yields by up to 80%. The cocoa swollen shoot virus necessitated the removal of 17 million trees during 2023–2024, resulting in a production loss of 150,000 metric tons and contributing to a debt of USD 1.8 billion for the Ghana Cocoa Board (COCOBOD). Extension worker coverage remains limited, with one agent serving 1,500 farmers, which falls short of the required ratio for effective integrated pest management. Additionally, resistance to affordable pyrethroids is increasing, forcing farmers to use more expensive organophosphates, which pose greater health risks.
*Our forecasts treat driver/restraint impacts as directional, not additive. The impact forecasts reflect baseline growth, mix effects, and variable interactions.
Segment Analysis
By Commodity Type: Cereals Dominate while Fruits Accelerates
Cereals and grains accounted for 45.2% of the Ghana agriculture market size in 2025, driven by 3.2 million metric tons of maize and 1.1 million metric tons of rice, according to the Food and Agriculture Organization. Domestic maize production meets 90% of demand, leaving 200,000 to 300,000 metric tons to be imported. In contrast, rice self-sufficiency stands at only 60%, resulting in imports of 700,000 metric tons valued at USD 400 million. Sorghum production demonstrated resilience to erratic rainfall, but it remained under-commercialized. Increased feed demand has boosted soybean production, but the poultry industry still relies on imports of soybean meal. Achieving the Northern Savannah irrigation target of 50,000 hectares could help reduce the maize import gap by 2028, thereby contributing to the growth of Ghana's cereal market.
Fruits are the fastest-growing segment, with a 5.0% CAGR from 2026 to 2031, driven by demand from the European Union and the United Kingdom buyers seeking year-round suppliers. Horticulture exports reached USD 180 million in 2024, with mangoes and pineapples accounting for two-thirds of the total value. Investments such as Blue Skies’ new plant and Golden Exotics’ 45,000 metric tons pineapple estate highlight the shift toward value-added processing, which commands prices three times higher than raw produce. However, post-harvest losses remain above one-third due to insufficient cold-chain capacity. Addressing storage challenges could increase the horticulture segment's contribution to Ghana agriculture market share by an additional percentage point within five years.


Geography Analysis
The Northern Savannah region encompasses five areas and accounts for 70% of the country's cereal production. Yields fall short of potential by up to 40% due to reliance on a single rainy season that concludes in September. The USD 93 million Northern Savannah Agricultural Development Program aims to irrigate 50,000 hectares by 2029, potentially enabling dry-season vegetable production valued at USD 150 million, provided water efficiency targets are met. Currently, only 40% of villages have access to electricity, and diesel prices have risen to GHS 15 (USD 1.25) per liter, making affordable solar-powered irrigation systems crucial. Drought-tolerant crops, such as sorghum and millet, are gaining popularity, and the lack of aggregation centers forces farmers to sell their produce within 48 hours of harvest, often at discounts exceeding 40%.
The Middle Belt, encompassing the Brong-Ahafo, Ashanti, and Eastern regions, produced 2.1 million metric tons of maize and 12 million metric tons of cassava in 2024. The region benefits from bimodal rainfall, which allows for two cropping cycles annually. However, 65% of farms are smaller than two hectares, limiting the economic viability of mechanization. Warehouse density is low, with only one facility per 50,000 hectares, resulting in cereal losses of up to 34%. Cocoa production in 2024 declined due to the swollen shoot virus, which has significantly reduced yields. In response, the Ghana Cocoa Board (COCOBOD) is rehabilitating 100,000 hectares with hybrid varieties that are projected to yield up to 800 kilograms per hectare within five years. Land consolidation pilots covering 5,000 hectares aim to create blocks of 10–20 hectares, making them more suitable for tractor services.
The Coastal and Transitional zones serve as Ghana’s horticultural export hub, leveraging proximity to Tema and Takoradi ports in 2024. This proximity reduces logistics costs by up to 40% compared to exporters in the Northern regions. However, urban expansion is driving up peri-urban land prices to GHS 50,000 (USD 4,167) per hectare, forcing growers to relocate to less expensive but underdeveloped areas on the fringes of the Volta region. Coconut production reached 250 million nuts, but processing facilities handle only 80 million, highlighting significant opportunities in coconut oil and desiccated product markets. Investments in cold-chain infrastructure and certification by companies such as Premium Foods and Blue Skies demonstrate that competitiveness along the coast is determined more by compliance capabilities than by land costs.
Competitive Landscape
In the Ghana agricultural market, input distribution remains fragmented. Wienco operates 450 retail points, and Agricare has 200 outlets, together accounting for under 25% of the market share. Meanwhile, informal dealers dominate, moving 60% of fertilizer volumes. These investments, ranging from USD 5 million to USD 15 million per factory, necessitate rigorous Hazard Analysis and Critical Control Point certification. Downstream, export channels are dominated by Olam Agri, Louis Dreyfus Company, and Wilmar International, collectively managing 55% of cocoa and cashew shipments, leveraging their global networks and adherence to stringent European regulations.
Digital platforms are reshaping the landscape. Trotro Tractor, with its annual reach spanning 80,000 hectares, boasts utilization rates that are double those of state fleets, validating the asset-light aggregator model. Esoko combines market alerts with mobile payments on its farmer platform, driving GHS 12 million (USD 1 million) in input sales and achieving greater engagement than traditional advisory channels. Kuapa Kokoo demonstrates the potential of cooperatives, exporting 45,000 metric tons of Fair Trade cocoa and securing a premium of USD 150 per metric ton. With 30% of cooperatives remaining dormant due to governance issues, it's evident that scale will favor those with professional management.
Sustainability compliance has emerged as a key differentiator. Olam’s cocoa, with 80% certified by Rainforest Alliance, aligns with the European Union’s 2024 deforestation mandate. Nestlé, under its Cocoa Plan, aims for 100% sustainable sourcing, emphasizing the importance of vertically integrated, traceable supply chains. While carbon-credit pilots offer additional income, their high verification costs and price volatility limit participation to larger groups. As a result, Ghana's agricultural market is evolving with larger players harnessing certification and cold-chain finance to achieve export dominance, while agile digital platforms and cooperatives are carving out domestic niches.
Recent Industry Developments
- December 2025: Ghana inaugurated an Agricultural Resource Centre in Sunyani to enhance the national mango value chain and support rural development. The facility was established through a partnership between the Sunyani Greenfield Mango Farmers Association and the Blue Skies Foundation, the charitable division of Blue Skies Fruit Juice Company.
- April 2024: Ghana has officially introduced Songotra-T, its first genetically modified (GM) cowpea, designed to combat the destructive legume pod borer (Maruca vitrata). The variety is now being distributed to seed growers and local companies for large-scale dissemination.
- December 2024: The International Monetary Fund (IMF) has disbursed USD 360 million to Ghana under its Extended Credit Facility (ECF) program. This funding, aligned with Ghana's broader economic recovery plan, reflects strong performance in key sectors, including agriculture.


Research Methodology Framework and Report Scope
Market Definitions and Key Coverage
We define the Ghana agriculture market as the total farm-gate revenue, expressed in current US dollars, generated from crops, livestock, forestry, and inland fisheries produced within Ghana's borders. Our study tracks physical output and realized producer prices for cereals, pulses, oilseeds, roots and tubers, fruits, vegetables, cocoa, livestock, and aquaculture, then converts them to annual market value.
Scope exclusion: We exclude upstream agri-inputs, fertilizer trade, and downstream food processing so the lens stays on primary production only.
Segmentation Overview
- By Commodity Type
- Cereals and Grains
- Production Analysis
- Overview
- Area Harvested and Yield
- Consumption Analysis (Value and Volume)
- Trade Analysis (Value and Volume)
- Import Market Analysis
- Overview
- Key Supplying Markets
- Export Market Analysis
- Overview
- Key Destination Markets
- Import Market Analysis
- Wholesale Price Trend Analysis and Forecast
- Seasonality Analysis
- Production Analysis
- Oilseeds and Pulses
- Production Analysis
- Overview
- Area Harvested and Yield
- Consumption Analysis (Value and Volume)
- Trade Analysis (Value and Volume)
- Import Market Analysis
- Overview
- Key Supplying Markets
- Export Market Analysis
- Overview
- Key Destination Markets
- Import Market Analysis
- Wholesale Price Trend Analysis and Forecast
- Seasonality Analysis
- Production Analysis
- Fruits
- Production Analysis
- Overview
- Area Harvested and Yield
- Consumption Analysis (Value and Volume)
- Trade Analysis (Value and Volume)
- Import Market Analysis
- Overview
- Key Supplying Markets
- Export Market Analysis
- Overview
- Key Destination Markets
- Import Market Analysis
- Wholesale Price Trend Analysis and Forecast
- Seasonality Analysis
- Production Analysis
- Vegetables
- Production Analysis
- Overview
- Area Harvested and Yield
- Consumption Analysis (Value and Volume)
- Trade Analysis (Value and Volume)
- Import Market Analysis
- Overview
- Key Supplying Markets
- Export Market Analysis
- Overview
- Key Destination Markets
- Import Market Analysis
- Wholesale Price Trend Analysis and Forecast
- Seasonality Analysis
- Production Analysis
- Cash Crops
- Production Analysis
- Overview
- Area Harvested and Yield
- Consumption Analysis (Value and Volume)
- Trade Analysis (Value and Volume)
- Import Market Analysis
- Overview
- Key Supplying Markets
- Export Market Analysis
- Overview
- Key Destination Markets
- Import Market Analysis
- Wholesale Price Trend Analysis and Forecast
- Seasonality Analysis
- Production Analysis
- Cereals and Grains
Detailed Research Methodology and Data Validation
Primary Research
We bolster the desk work through interviews and structured surveys with farmers' cooperatives, licensed buying firms, wholesale market traders, and regional extension officers across Ashanti, Northern, Western, and Greater Accra. Their in-field insights help us verify yield swings, input access, and farm-gate pricing assumptions.
Desk Research
Our analysts first download high-frequency series from tier-one sources such as Ghana's Ministry of Food and Agriculture, FAOSTAT, World Bank, USDA-FAS, and UN Comtrade. We add policy papers from the Bank of Ghana and the International Trade Administration to map historic supply, trade, and price curves. Subscription assets like D&B Hoovers and Dow Jones Factiva let us sanity-check company disclosures and news on pest outbreaks or subsidy shifts. The sources noted here are illustrative, and many others were consulted for corroboration.
Market-Sizing & Forecasting
Mordor's model anchors on a top-down reconstruction of production multiplied by weighted average realized prices, which is then validated with selective bottom-up supplier roll-ups and channel checks. Key variables include harvested area, yield per hectare, livestock offtake rates, import dependence ratios, producer price indices, and cedi-dollar trends. Forecasts draw on multivariate regression combined with scenario analysis to capture rainfall variance and policy reforms, and the resulting coefficients are stress-tested with feedback from our primary contacts. Data gaps, for instance, in informal animal trade, are bridged with conservative proxies before final calibration.
Data Validation & Update Cycle
We run variance checks against independent macro indicators, reroute anomalies for analyst review, and refresh every dataset annually, triggering interim updates when material events such as pest infestations or sharp subsidy cuts occur.
Why Mordor's Ghana Agriculture Baseline Commands Reliability
Published estimates often diverge because firms mingle agro-processing with primary output, apply differing cocoa farm-gate prices, or freeze exchange rates for years. Our disciplined scope, yearly refresh, and dual-path modeling keep totals current and directly comparable for decision makers.
We find key gap drivers include inconsistent inclusion of agro-processing, varying price assumptions, and static currency deflators, while we align each element with on-ground realities.
Benchmark comparison
| Market Size | Anonymized source | Primary gap driver |
|---|---|---|
| USD 15.20 B (2025) | Mordor Intelligence | - |
| USD 3.32 B (2024) | Regional Consultancy A | Counts only commercial estates, omits smallholders |
| USD 18.70 B (2026) | Trade Journal B | Uses macro value-added data, blends forestry processing |
| USD 17.16 B (2024) | Global Consultancy C | Keeps constant 2020 prices and fixed FX rates |
These contrasts show that Mordor Intelligence's transparent variable selection, fresh data inputs, and clear scope give stakeholders the most balanced and reproducible baseline for strategic planning.


Key Questions Answered in the Report
What is the estimated market size of the Ghana agriculture market in 2026?
The Ghana agriculture market is estimated to reach USD 10.21 billion in 2026 and is forecast to grow to USD 12.97 billion by 2031.
Which commodity holds the largest share in Ghana’s farm sector?
Cereals and grains hold the largest share in Ghana’s farm sector, accounting for 45.2% of the total market in 2025.
Why do post-harvest losses remain high in Ghana?
Storage and cold‑chain gaps cause vegetables to lose up to 62% of output and cereals up to 34% before they reach markets.
How are digital platforms changing farm operations in Ghana?
Digital platforms are reshaping the landscape. Trotro Tractor, with its annual reach spanning 80,000 hectares, boasts utilization rates that are double those of state fleets, validating the asset-light aggregator model.
Page last updated on:


