Angola Agriculture Market Analysis by Mordor Intelligence
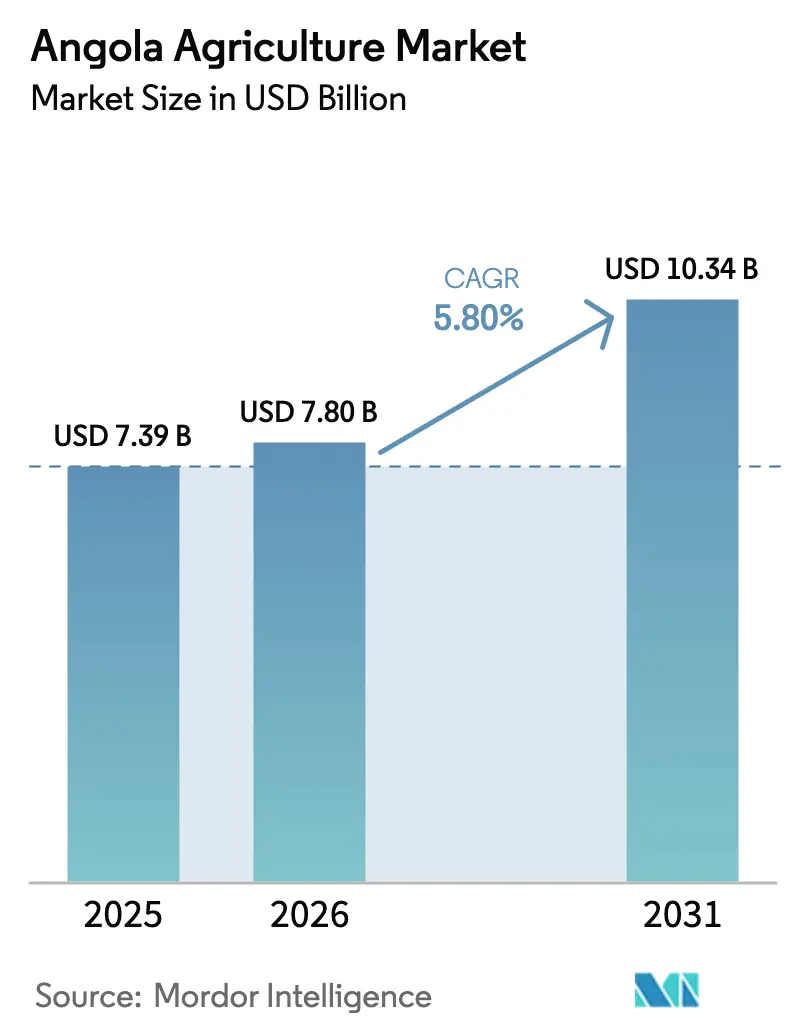
The Angola agriculture market size is projected to expand from USD 7.39 billion in 2025 and USD 7.80 billion in 2026 to USD 10.34 billion by 2031, registering a CAGR of 5.80% between 2026 to 2031. Shifts away from oil dependence, a surge in concessionary Chinese capital for mechanization, and stepped-up government irrigation programs are reshaping the competitive landscape and accelerating the formalization of value chains. Cereals and grains dominate production volumes, yet vegetables are emerging as the fastest-growing segment, driven by investments in cold chains that unlock regional and European Union market access. Multi-billion-dollar integrated food parks in Benguela and planned facilities in the north signal robust downstream demand for locally sourced crops, while satellite data and climate-smart seed programs strengthen resilience against El Niño-type droughts. At the same time, tariff realignments tied to Angola’s upcoming entry into the Southern African Development Community Free Trade Area widen export corridors for coffee, beans, and specialty horticulture.
Key Report Takeaways
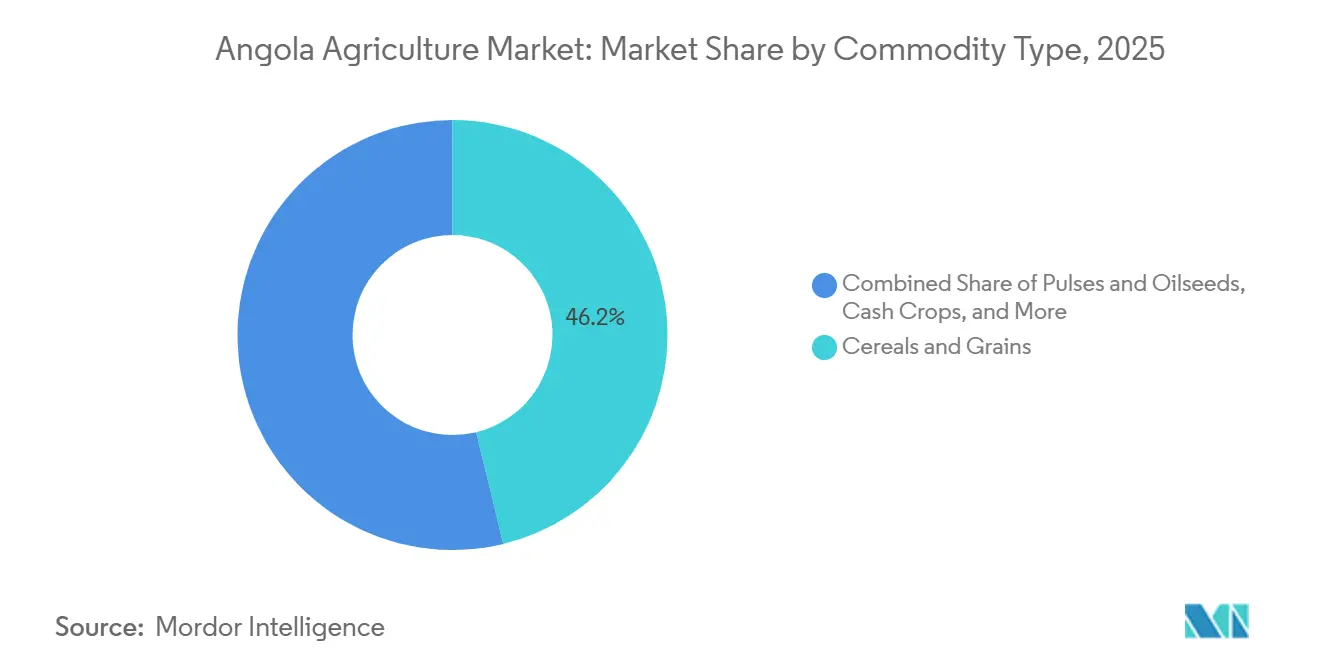
- By commodity type, cereals and grains held 46.2% of Angola agriculture market share in 2025, while vegetables are projected to expand at an 8.7% CAGR through 2031.
Note: Market size and forecast figures in this report are generated using Mordor Intelligence’s proprietary estimation framework, updated with the latest available data and insights as of January 2026.
Angola Agriculture Market Trends and Insights
Drivers Impact Analysis*
| Driver | (~) % Impact on CAGR Forecast | Geographic Relevance | Impact Timeline |
|---|---|---|---|
| Government-backed fertilizer subsidy expansion | +1.2% | National, with concentration in Huambo, Bié, Malanje, and Huíla | Medium term (2-4 years) |
| Revival of public irrigation schemes | +0.8% | Bengo, Malanje, Cuanza Norte, and Cuanza Sul | Medium term (2-4 years) |
| Surge in Chinese concessionary credit lines for farm mechanization | +1.5% | Eastern provinces (Malanje, Cuanza Norte, Lunda Norte, Moxico, Cuando Cubango, and Bié) | Short term (≤ 2 years) |
| Growing domestic demand for convenience-food ingredients | +0.6% | Urban centers (Luanda, Benguela, Huambo, and Lubango) | Long term (≥ 4 years) |
| Emergence of climate-smart "dry-land" maize hybrids | +0.7% | Southern provinces (Cunene, Namibe, and Huíla) and central highlands | Medium term (2-4 years) |
| Advent of satellite-enabled crop-insurance pilots | +0.4% | National, early pilots in Huambo, Bié, and Malanje | Long term (≥ 4 years) |
| Source: Mordor Intelligence | |||
Government-Backed Fertilizer Subsidy Expansion
Angola's Ministry of Agriculture and Forestry has embedded fertilizer subsidies into the National School Feeding Programme, launched in April 2025, by linking procurement contracts to domestic smallholder cooperatives that receive subsidized inputs in exchange for guaranteed off-take[1]Source: Food and Agriculture Organization, “Building on Strong Collaboration and Partnership Towards Sustainable Agrifood Systems Transformation in Angola,” fao.org. Linking subsidies to captive demand reduces Angola’s USD 3 billion food-import bill and crowds in private agronomy training financed by the International Finance Corporation. The International Finance Corporation partnered with Grupo Carrinho in December 2021 to train 300 agricultural technicians supporting these farmers, focusing on soybean and poultry value chains that integrate subsidized inputs with downstream processing capacity.
Revival of Public Irrigation Schemes
The World Bank's Smallholder Agriculture Productivity and Commercialization Project allocated USD 20 million specifically for farmer-led irrigation, targeting 15,600 farmers and 6,200 hectares between 2022 and 2029[2]Source: World Bank, “Development Projects: Angola Commercial Agriculture Development Project (PDAC) – P159052,” worldbank.org. This investment complements the Caxito Rega irrigation perimeter in Bengo, which has been operational for decades but received rehabilitation funding in 2024 to expand coverage and modernize canal systems. Brazilian-operated Fazenda Pipe installed 15 center-pivot systems irrigating 1,500 hectares in Malanje, achieving corn yields of 150 bags per hectare and soy yields of 66 bags per hectare, well above the national average.
Surge in Chinese Concessionary Credit Lines for Farm Mechanization
SinoHydro Group committed over USD 100 million in August 2025 to develop 30,000 hectares across six eastern provinces, subdivided into plots of 500 to 1,000 hectares for commercial farms and community-led initiatives, with a 25-year tax-free land concession. These deals solve Angola's capital-access problem by bundling land concessions with guaranteed Chinese off-take, effectively pre-financing mechanization through future export revenues. The strategic calculus for China centers on diversifying soybean supply away from the United States, which supplied approximately 20% of China's 105 million metric tons of soybean imports in 2024.
Growing Domestic Demand for Convenience-Food Ingredients
Grupo Carrinho's 43-hectare food park in Benguela houses 17 factories with a combined annual capacity of 610,000 metric tons for rice, wheat flour, and maize flour, employing over 4,000 workers and contracting 50,000 farmers in a pilot phase that will scale up to 1 million farmers. The park integrates milling, packaging, and distribution, targeting urban retailers and the hospitality, restaurant, and catering sectors in Luanda, Benguela, and Huambo. A EUR 57 million (USD 60 million) Deutsche Bank facility guaranteed by Italian Export Credit Agency (SACE) and Banco de Desenvolvimento de Angola financed a turnkey soybean and sunflower crushing plant in Lobito with a capacity of 4,000 metric tons per day for soybeans or 2,400 metric tons per day for sunflower seeds, described as the largest of its kind in Africa. Rising minimum wages and expanding poultry demand lift consumption of fortifiable flours and refined oils.
Restraints Impact Analysis*
| Restraint | (~) % Impact on CAGR Forecast | Geographic Relevance | Impact Timeline |
|---|---|---|---|
| Chronic post-harvest infrastructure gaps | -1.0% | National, acute in Bié, Moxico, Cuando Cubango, and Lunda Norte | Short term (≤ 2 years) |
| Volatile foreign-exchange availability for input imports | -0.8% | National, concentrated impact on commercial farms and agro-processors | Short term (≤ 2 years) |
| Aging small-holder farmer demographic | -0.5% | Rural areas nationwide, particularly southern and central provinces | Long term (≥ 4 years) |
| Soil salinization in coastal plains | -0.3% | Bengo and Cuanza Sul coastal zones | Long term (≥ 4 years) |
| Source: Mordor Intelligence | |||
Chronic Post-Harvest Infrastructure Gaps
Post-harvest losses range from 30 to 40% across cereals, pulses, and horticulture due to inadequate storage, limited cold-chain facilities, and poor rural road networks. Fruits destined for export markets face rejection rates of 15 to 20% due to spoilage during transit from farm to port, eroding margins for smallholder cooperatives. The Regional Cassava Leadership Centre in Malanje, nearing completion in 2025, will provide processing and storage capacity for cassava, but similar facilities for maize, beans, and horticulture remain absent in Moxico, Cuando Cubango, and Lunda Norte.
Volatile Foreign-Exchange Availability for Input Imports
A kwanza depreciation from 852 to 917 per United States dollar in late 2024 raised landed fertilizer and pesticide costs by up to 15%, while new import bans squeezed allocations available for agricultural inputs[3]Source: United States Department of Agriculture Foreign Agricultural Service, “Poultry and Products Annual,” usda.gov. Limited private credit deepens currency-hedging challenges for farmers. Inflation reached 27.5% in December 2024 before moderating to 19% by July 2025, but private credit remains constrained at approximately 6% of GDP, limiting farmers' ability to hedge currency risk through forward contracts.
*Our forecasts treat driver/restraint impacts as directional, not additive. The impact forecasts reflect baseline growth, mix effects, and variable interactions.
Segment Analysis
By Commodity Type: Cereals and Grains Anchor Food Security as Vegetables Gain Export Momentum
Cereals and grains captured 46.2% of Angola agriculture market share in 2025, with dominant cassava staples that supply both rural consumption and industrial milling. Continued tariff increases on imported wheat flour and rice incentivize domestic substitution, while the milling capacity in Benguela shortens local supply chains. Strategic silos embedded in upcoming grain estates shield against storage deficits, positioning cereals and grains as the backbone of food-security policy and livestock feed expansion.
Vegetables are forecast to expand at an 8.7% CAGR from 2026 to 2031, the fastest among all segments, as solar-powered cold rooms and reefer trucking reduce post-harvest spoilage and unlock demand in the European Union. Premier estates such as Fazenda Novagrolíder cultivate 8,500 hectares of mixed horticulture and export to Portugal, Spain, and France, demonstrating commercial viability. Electronic Certificates of Origin, set for 2026, are projected to streamline trade within the Southern African Development Community, thereby widening market access for onions, potatoes, and citrus. The Angola agriculture market size for vegetables is projected to grow over the forecast horizon as nutritional awareness rises among urban consumers.


Geography Analysis
Production clusters in the central highlands of Huambo, Bié, and Malanje account for more than 60% of cereal and pulse output, benefiting from fertile Ferralsols and cooler elevations that deliver higher rain-fed yield ceilings. Provincial growth is supported by the World Bank's projection of a 4.3% expansion in agriculture by 2026, expected to moderate to 3.4% by 2027 as mechanization becomes more widespread. Benguela’s food-processing corridor links coastal ports to inland farms, reducing freight costs and enabling rapid market entry for milled products, while Malanje houses both SinoHydro’s grain estate and the Cassava Leadership Centre that upgrades root-crop processing.
Southern provinces Cunene, Namibe, and Huíla face the highest drought exposure, yet climate-smart seed adoption and vegetable gardens supported by a World Bank humanitarian grant have begun reversing acute food-insecurity spikes. Lunda Norte’s rice initiative under the Angola-Vietnam Action Plan targets 10 officers trained abroad to propagate lowland rice suited to local hydrology, while coastal Bengo and Cuanza Sul wrestle with soil salinity that forces a crop mix pivot toward cassava.
Trade corridors are evolving as Angola prepares to ratify the Southern African Development Community Free Trade Area protocols, which will remove tariff and non-tariff barriers with Namibia, Zambia, and South Africa. The USD 4 billion Lobito rail line could eventually shift mineral-centric cargo toward high-value horticulture once rural road feeders and cold-storage nodes come onstream. Cuanza Sul’s Quibala district is anchored in horticulture, seed multiplication, and emerging coffee acreage, leveraging its plateau climate and proximity to Luanda markets.
Competitive Landscape
The Angola agriculture market includes state entities such as Gesterra E.P. (Government of Angola) and Companhia de Bioenergia de Angola - Biocom, operating alongside emerging private groups. Grupo Carrinho Holding exemplifies vertical integration by contracting with 50,000 farmers and processing 610,000 metric tons annually, thereby capturing both upstream supply and downstream retail margins.
Companhia de Bioenergia de Angola - Biocom’s USD 750 million sugar-to-ethanol estate spans 42,000 hectares and produces 254,000 metric tons of sugar each season, translating to a double-digit share of national cash-crop revenue. Chinese-backed SinoHydro and CITIC leverage concessionary debt and guaranteed soybean offtake to accelerate land clearing and mechanization, potentially consolidating their influence in the grain market over the next five years.
White-space opportunities include cold-chain logistics and digital agronomy services, with current smartphone-based advisory pilots reaching only a few hundred farmers. Brazilian-run Fazenda Pipe achieves yields 60% above national averages by combining center-pivot irrigation and precision fertilization, signaling a competitive advantage to operators that can finance modern equipment. Intensifying research on locally bred hybrid seeds underpins future competitive differentiation.
Recent Industry Developments
- August 2025: SinoHydro Group has allocated over USD 100 million to enhance grain production across 30,000 hectares in six eastern provinces of Angola, under a 25-year tax-free land concession. The land is divided into plots ranging from 500 to 1,000 hectares, designated for commercial farming and community-led projects. The initiative also includes the establishment of a seed research and testing center aimed at improving crop yields.
- August 2025: Angola and Vietnam have signed an Action Plan for 2025-2030, emphasizing cooperation in rice, cassava, soybeans, and forestry. The plan prioritizes rice production in Lunda Norte province, reflecting the strong political commitment of both nations to fostering substantial and long-term bilateral agricultural collaboration. Furthermore, the agreement includes training 10 Angolan officers in Vietnam's agricultural techniques.
- June 2025: The Food and Agriculture Organization and Angola's Ministry of Environment launched a joint technical mission to revive Agroecological Centres and Agroecology Farmer Field Schools in Huambo and Namibe provinces under the Integrated and Climate-Resilient Sustainable Land Management Project, for implementation to rehabilitate productive infrastructure, reactivate Farmer Field Schools, and provide training in sustainable land management and climate-resilient farming techniques.


Research Methodology Framework and Report Scope
Market Definitions and Key Coverage
Our study defines Angola's agriculture market as the total annual value of crops, plantations, and horticulture output sold at the farm gate, supplemented by on-farm post-harvest handling. Livestock, fisheries, forestry, and agro-processing revenues are not included, keeping the focus on primary crop production.
Scope Exclusions: Inputs such as fertilizers, machinery, and animal husbandry are outside the present valuation scope.
Segmentation Overview
- By Commodity Type
- Grains and Cereals
- Production Analysis (Volume)
- Overview
- Area Harvested and Yield
- Consumption Analysis (Value and Volume)
- Trade Analysis (Value and Volume)
- Import Market Analysis
- Overview
- Key Supplying Markets
- Export Market Analysis
- Overview
- Key Destinations Markets
- Import Market Analysis
- Wholesale Price Trend Analysis and Forecast
- Seasonality Analysis
- Production Analysis (Volume)
- Pulses and Oilseeds
- Production Analysis (Volume)
- Overview
- Area Harvested and Yield
- Consumption Analysis (Value and Volume)
- Trade Analysis (Value and Volume)
- Import Market Analysis
- Overview
- Key Supplying Markets
- Export Market Analysis
- Overview
- Key Destinations Markets
- Import Market Analysis
- Wholesale Price Trend Analysis and Forecast
- Seasonality Analysis
- Production Analysis (Volume)
- Fruits
- Production Analysis (Volume)
- Overview
- Area Harvested and Yield
- Consumption Analysis (Value and Volume)
- Trade Analysis (Value and Volume)
- Import Market Analysis
- Overview
- Key Supplying Markets
- Export Market Analysis
- Overview
- Key Destinations Markets
- Import Market Analysis
- Wholesale Price Trend Analysis and Forecast
- Seasonality Analysis
- Production Analysis (Volume)
- Vegetables
- Production Analysis (Volume)
- Overview
- Area Harvested and Yield
- Consumption Analysis (Value and Volume)
- Trade Analysis (Value and Volume)
- Import Market Analysis
- Overview
- Key Supplying Markets
- Export Market Analysis
- Overview
- Key Destinations Markets
- Import Market Analysis
- Wholesale Price Trend Analysis and Forecast
- Seasonality Analysis
- Production Analysis (Volume)
- Cash Crops
- Production Analysis (Volume)
- Overview
- Area Harvested and Yield
- Consumption Analysis (Value and Volume)
- Trade Analysis (Value and Volume)
- Import Market Analysis
- Overview
- Key Supplying Markets
- Export Market Analysis
- Overview
- Key Destinations Markets
- Import Market Analysis
- Wholesale Price Trend Analysis and Forecast
- Seasonality Analysis
- Production Analysis (Volume)
- Grains and Cereals
Detailed Research Methodology and Data Validation
Primary Research
Mordor analysts interviewed agronomists, grain traders, cooperative leads, and provincial extension officers across Luanda, Huambo, and Bie. Their insights refined acreage utilization, typical farm-gate prices, and post-harvest loss factors, giving us the confidence to adjust secondary data and strengthen key assumptions.
Desk Research
We began with official time-series from sources such as the FAO, Angola's Instituto Nacional de Estatistica, UN Comtrade customs records, and World Bank commodity dashboards. Trade and price checks were cross-read with USDA-FAS attache notes, ITA cold-chain briefs, and peer-reviewed agronomy journals to benchmark yields. In addition, D&B Hoovers snapshots helped our team gauge revenue mix for the few commercial estates operating nationwide.
These publicly available references were complemented by paid feeds from Dow Jones Factiva for event validation and Questel's patent trends to size emerging crop varieties. The list above is illustrative; many other references shaped the evidence base.
Market-Sizing & Forecasting
A top-down and bottom-up blended model was built. National production and trade data reconstructed the demand pool, which was then corroborated with selective supplier roll-ups and sampled price-per-ton checks. Core variables feeding the model include cultivated hectares, average yield per commodity, fertilizer application rates, post-harvest loss percentages, and real exchange movements. Scenario-tested multivariate regression produced forecasts through 2030, while gaps in bottom-up estimates were bridged using regional yield analogs agreed upon by expert respondents.
Data Validation & Update Cycle
Outputs run through variance rules; anomalies trigger re-contact with sources before senior review sign-off. Reports refresh yearly, and an interim pass is scheduled when policy or climatic shocks materially shift any driver.
Why Mordor's Angola Agriculture Baseline Commands Stakeholder Trust
Published estimates diverge because firms use different commodity baskets, pricing points, and refresh cadences.
Key gap drivers include narrower scopes that omit home-consumed output, reliance on import bills as proxies, and sporadic forecast updates; this is where Mordor's disciplined definition and annual renewal stand apart.
Benchmark comparison
| Market Size | Anonymized source | Primary gap driver |
|---|---|---|
| USD 8.51 B (2025) | Mordor Intelligence | - |
| USD 8.5 B (2024) | Regional Consultancy A | Excludes livestock and fisheries but mixes producer and wholesale prices |
| USD 4.5 M (2023) | Industry Consultancy B | Tracks only organised agribusiness revenue; omits smallholder output |
| USD 2.1 B (2024) | International Agency C | Captures food import bill, not domestic production value |
The comparison shows that when scope, price bases, and refresh rhythm vary, totals swing widely. By anchoring valuations to clearly stated crop-only boundaries, vetted field inputs, and repeatable steps, Mordor Intelligence delivers a balanced, transparent baseline that decision-makers can lean on with confidence.


Key Questions Answered in the Report
What is the projected market size of the Angola agriculture market by 2031?
The Angola agriculture market size is projected to reach USD 10.34 billion by 2031.
Which commodity segment held the largest share of the Angola agriculture market in 2025?
Cereals and grains held the largest share of the Angola agriculture market, accounting for 46.2% of the total market share in 2025.
Which crop segment shows the fastest revenue growth?
Vegetables lead with an expected 8.7% CAGR from 2026 to 2031, driven by cold-chain expansion and growing export demand.
Which provinces dominate Angola's agricultural output?
Huambo, Bié, and Malanje collectively generate more than 60% of national cereal and pulse production.
Page last updated on:


