IR Spectroscopy Market Size and Share
Market Overview
| Study Period | 2020 - 2031 |
|---|---|
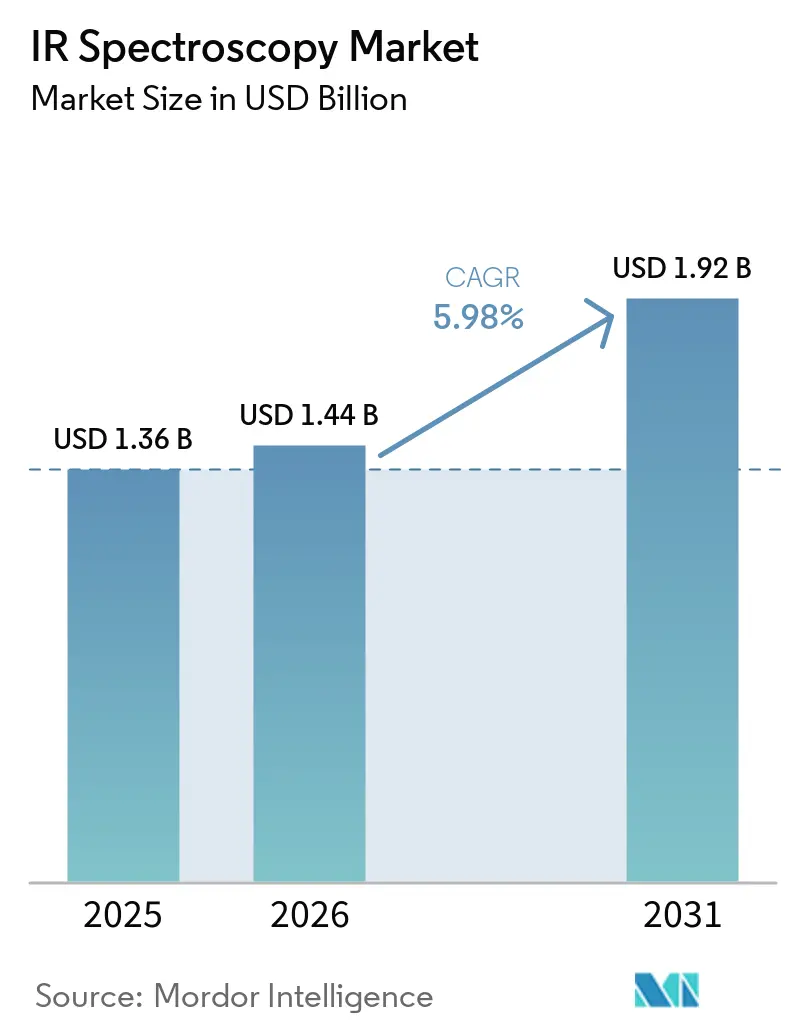
| Market Size (2026) | USD 1.44 Billion |
| Market Size (2031) | USD 1.92 Billion |
| Growth Rate (2026 - 2031) | 5.98% CAGR |
| Fastest Growing Market | Asia-Pacific |
| Largest Market | North America |
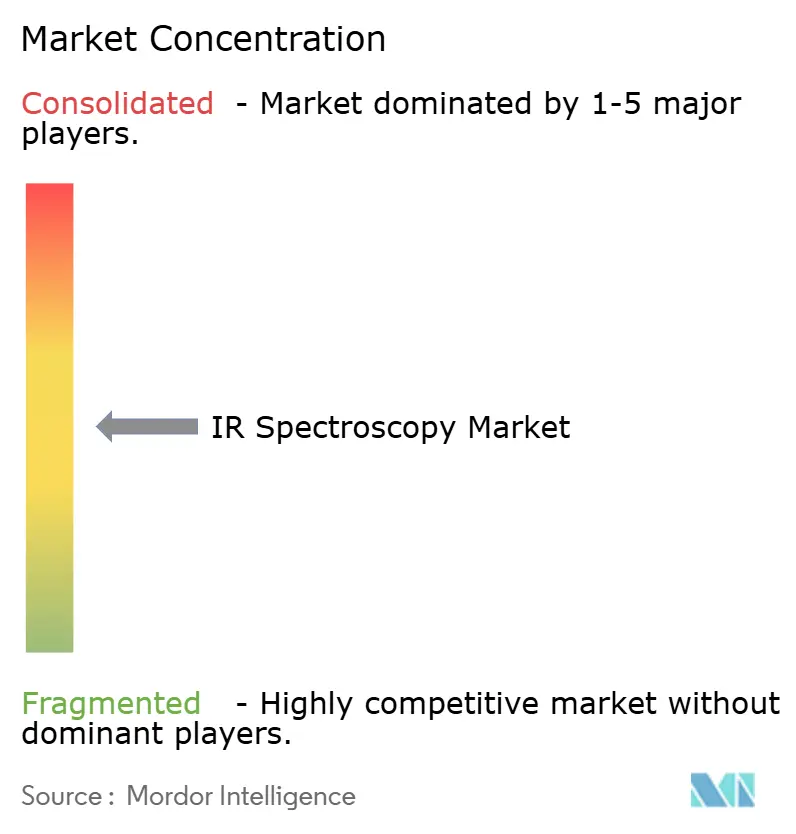
| Market Concentration | Medium |
Major Players *Disclaimer: Major Players sorted in no particular order Image © Mordor Intelligence. Reuse requires attribution under CC BY 4.0. | |
IR Spectroscopy Market Analysis by Mordor Intelligence
The IR Spectroscopy Market size was valued at USD 1.36 billion in 2025 and is estimated to grow from USD 1.44 billion in 2026 to reach USD 1.92 billion by 2031, at a CAGR of 5.98% during the forecast period (2026-2031).
The IR spectroscopy market is driven by increased integration in pharmaceutical production processes, the adoption of portable instruments for field applications, and AI-enabled spectral tools for faster interpretation. Regulatory pressures are prompting a shift from offline testing to in-line measurement, boosting demand for integrated systems that combine instruments, software, validation support, and spectral libraries. This trend also creates opportunities for vendors offering plant connectivity, secure data management, and consistent model performance across multiple sites. Additionally, the market is expanding beyond laboratory use, with compact and handheld systems increasingly utilized for field screening, food authentication, contamination checks, and environmental monitoring. Competition remains moderately concentrated, with global vendors leading platform development and smaller suppliers focusing on specialized software, portable formats, and application-specific designs.
Key Report Takeaways
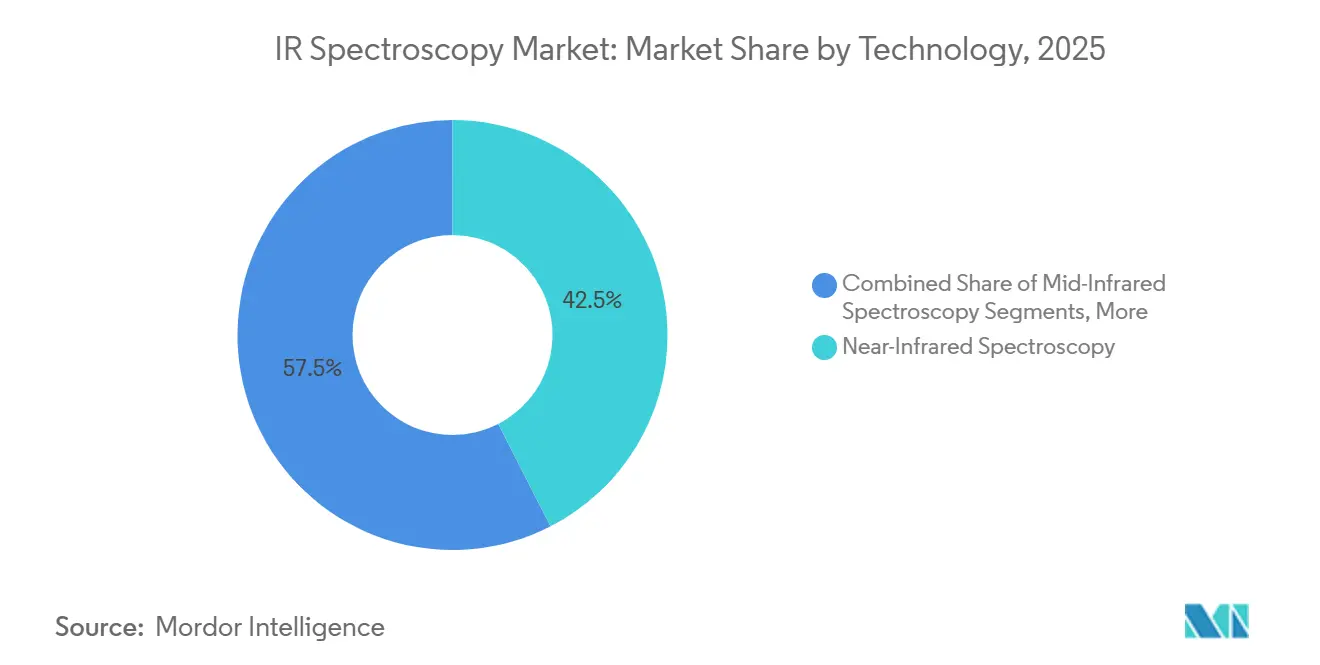
- By technology, near-infrared spectroscopy led with 42.45% revenue share in 2025, while mid-infrared spectroscopy is projected to expand at a 7.25% CAGR through 2031.
- By product type, benchtop spectrometers held 44.56% of revenue in 2025, while FTIR spectrometers recorded the highest projected CAGR at 6.55% through 2031.
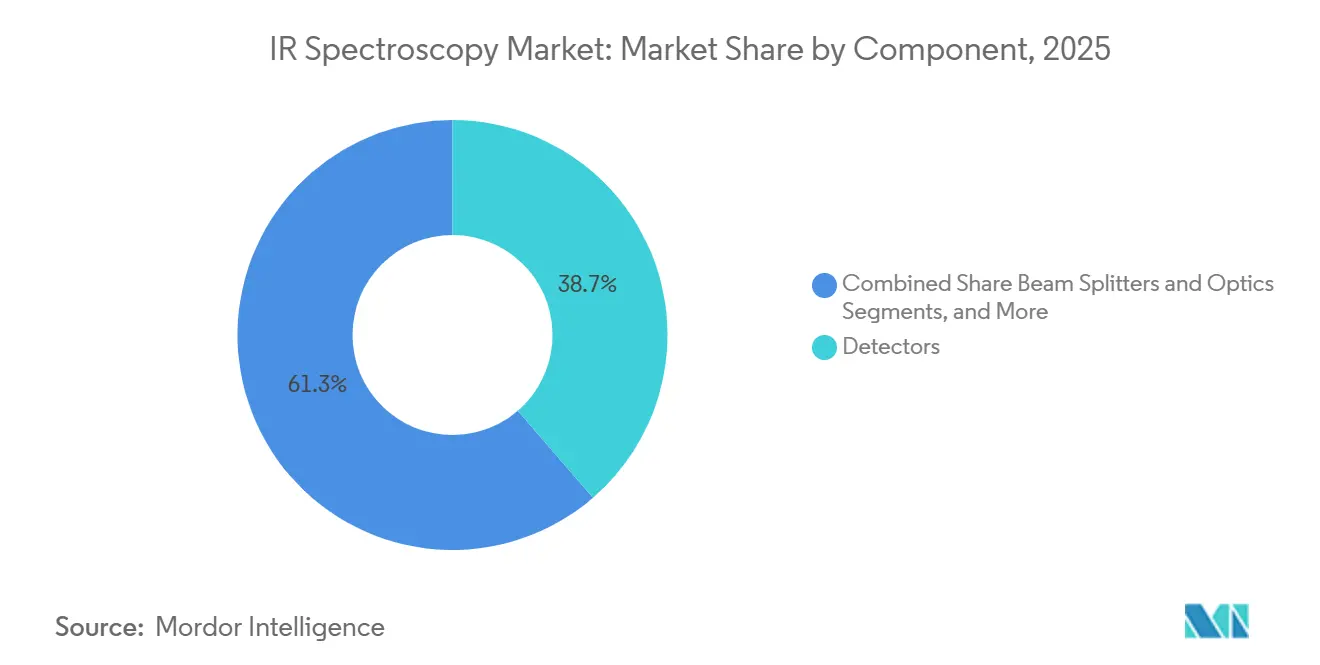
- By component, detectors accounted for 38.65% of revenue in 2025, while software and spectral libraries are expected to grow at a 6.88% CAGR through 2031.
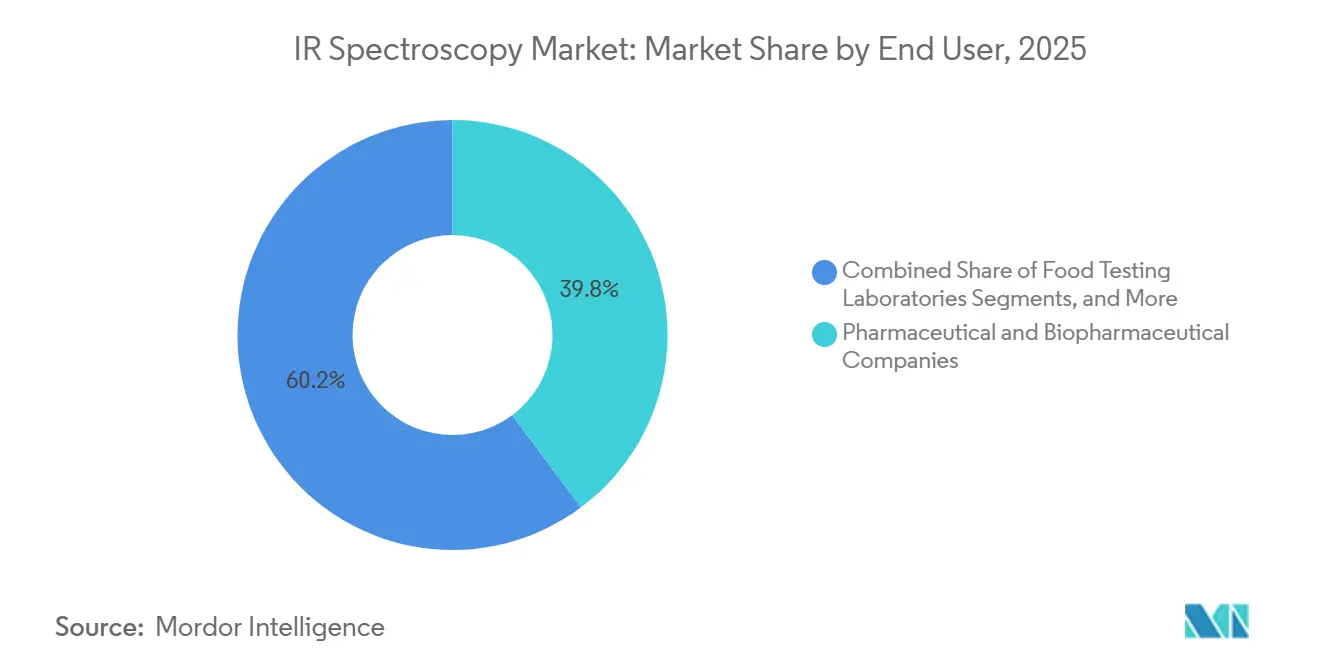
- By application, pharmaceuticals and biopharmaceuticals accounted for 46.93% of revenue in 2025, while food and beverage testing is expected to grow at a 7.45% CAGR through 2031.
- By end user, pharmaceutical and biopharmaceutical companies represented 39.77% of revenue in 2025, while food testing laboratories are projected to expand at a 7.92% CAGR through 2031.
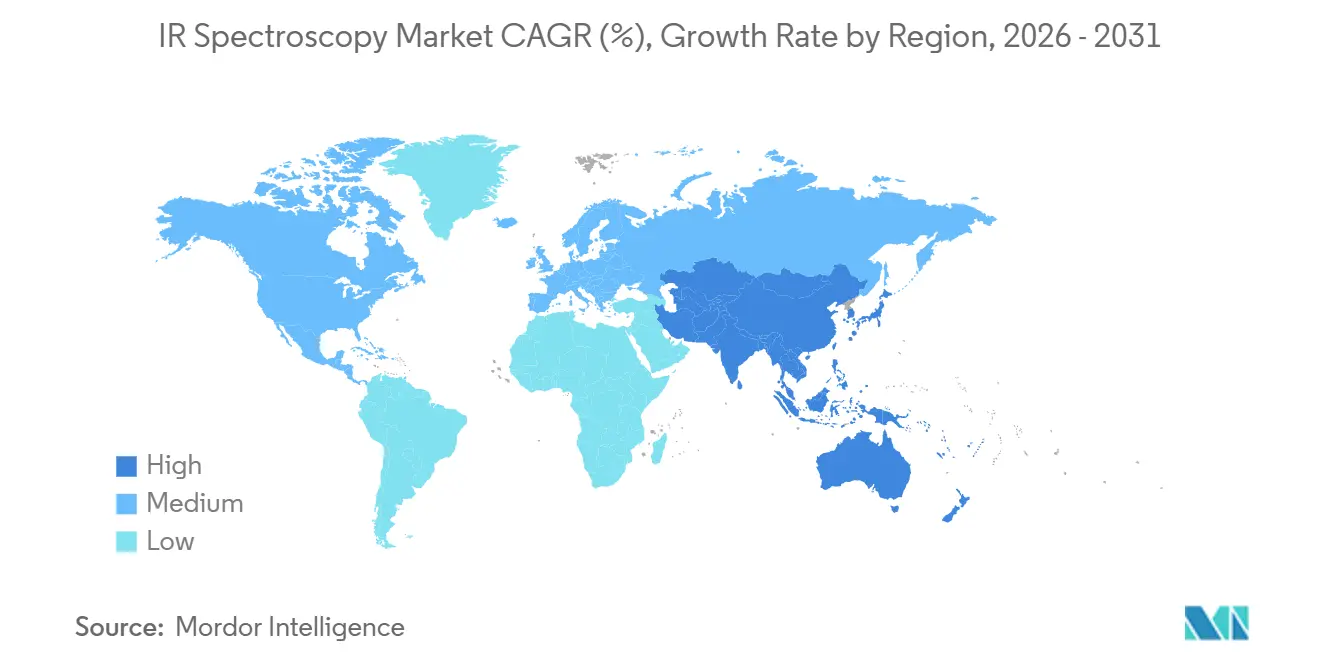
- By geography, North America held 40.25% of revenue in 2025, while Asia-Pacific is expected to record the fastest regional CAGR at 8.12% through 2031.
Note: Market size and forecast figures in this report are generated using Mordor Intelligence’s proprietary estimation framework, updated with the latest available data and insights as of January 2026.
Global IR Spectroscopy Market Trends and Insights
Drivers Impact Analysis*
| DRIVER | (~) % IMPACT ON CAGR FORECAST | GEOGRAPHIC RELEVANCE | IMPACT TIMELINE |
|---|---|---|---|
| Pharma PAT and in-line release testing adoption | +1.5% | Global, North America and Europe core | Medium term (2-4 years) |
| Portable and handheld IR use in field screening | +1.1% | Global, APAC and MEA gaining share | Short term (≤ 2 years) |
| Semiconductor and advanced materials QC | +0.8% | APAC core, with spillover to North America | Medium term (2-4 years) |
| Ai-enabled spectral libraries and workflow automation | +1.0% | Global | Long term (≥ 4 years) |
| Food authenticity and contamination screening | +0.9% | Europe, APAC, North America | Medium term (2-4 years) |
| Environmental compliance monitoring at low detection limits | +0.7% | North America and Europe, with spillover to APAC | Medium term (2-4 years) |
| Source: Mordor Intelligence | |||
Pharma PAT and In-Line Release Testing Adoption
Pharmaceutical manufacturers are transitioning from offline batch testing to real-time process data for quality control, driving growth in the IR spectroscopy market. Fiber-coupled NIR systems play a key role by enabling raw material identification, blend monitoring, and process measurement without disrupting production. The FDA's PAT framework and ICH Q13 guidelines emphasize the importance of in-line spectroscopy for continuous processes and registration-ready manufacturing. This shift increases demand for compliant data pipelines, validated chemometric models, and 21 CFR Part 11-aligned software, pushing buyers toward vendors offering complete solutions.[1]U.S. Food and Drug Administration, “Guidance for Industry PAT, A Framework for Innovative Pharmaceutical Development, Manufacturing, and Quality Assurance,” U.S. Food and Drug Administration, fda.gov Multi-spectrometer setups are gaining traction in high-throughput sites to monitor model drift and validate outputs, boosting instrument demand and accelerating the growth of software and spectral libraries.
Portable and Handheld IR Use in Field Screening
The adoption of portable and handheld devices is shortening deployment cycles in forensic work, food inspection, security screening, and goods verification, expanding the IR spectroscopy market. Handheld systems with rugged enclosures and battery backups now deliver performance levels comparable to benchtop instruments, making them suitable for routine field use. Products like Bruker’s MOBILE-IR II and Agilent’s 4500 series demonstrate how vendors are aligning spectral performance with real-world conditions. Portable infrared and Raman spectroscopy can detect wheat flour adulteration at CODEX-relevant levels, supporting its integration into inspection workflows. This trend is particularly significant in APAC and MEA supply chains, where field verification reduces losses and delays caused by weak cold chains or limited laboratory access.
AI-Enabled Spectral Libraries and Workflow Automation
AI tools are revolutionizing infrared analysis by enhancing structure prediction, workflow automation, and faster interpretation, reshaping the IR spectroscopy market. Transformer-based IR structure elucidation has achieved a Top-1 accuracy of 63.79% and a Top-10 accuracy of 83.95%, showcasing significant advancements. Expert-inspired LLM workflows for IR-based compound identification are moving from research to practical applications. Wiley’s database of over 250,000 AI-predicted IR spectra addresses the challenge of limited reference data for rare compounds. As these libraries grow, smaller laboratories can adopt AI-assisted identification with less reliance on proprietary data, shifting competitive value toward software, data assets, and workflow control.
Food Authenticity and Contamination Screening
Infrared spectroscopy is becoming essential in routine food inspections, driven by the need to combat food fraud. ATR-FTIR combined with pattern-recognition methods can confirm the botanical origin of Greek monofloral honey, enabling faster high-throughput testing. FTIR with genetic algorithm-based spectral feature selection has achieved 100% classification accuracy for honey adulterants, strengthening the case for machine-learning-supported screening. Food testing laboratories are expected to grow faster than several traditional buyer groups through 2031 as more networks adopt benchtop and portable systems. Tighter national food safety enforcement in Europe and Asia-Pacific, along with CODEX-linked practices, is driving demand for faster authenticity and contamination checks.
Restraints Impact Analysis*
| RESTRAINT | (~) % IMPACT ON CAGR FORECAST | GEOGRAPHIC RELEVANCE | IMPACT TIMELINE |
|---|---|---|---|
| High capital cost for high-end FTIR and QCL systems | -0.6% | Global, pronounced in APAC emerging markets and South America | Medium term (2-4 years) |
| Skilled operator and method validation dependencies | -0.4% | Global | Medium term (2-4 years) |
| Matrix interference and spectral overlap in complex samples | -0.3% | Global | Long term (≥ 4 years) |
| Ongoing calibration, drift control, and regulatory compliance costs | -0.4% | Global, North America and Europe compliance-intensive | Long term (≥ 4 years) |
| Source: Mordor Intelligence | |||
High Capital Cost for High-End FTIR and QCL Systems
High upfront costs limit the IR spectroscopy market's expansion, particularly among smaller labs, cost-sensitive manufacturers, and public institutions with constrained budgets. Process-grade FTIR systems with validated software, environmental safeguards, and plant connectivity can exceed USD 90,000 per node, while QCL-based imaging systems for pharmaceutical R&D can surpass USD 200,000. These costs often lead buyers to delay purchases or choose lower-tier systems. Multi-site rollouts further escalate expenses, as qualification work, maintenance, and service contracts add 15-25% annually to the initial investment. This pricing dynamic is driving demand toward refurbished benchtop systems and compact instruments priced between USD 15,000 and 30,000, where vendor pricing power is weaker. Fraunhofer IAF’s semi-automated process for MOEMS-EC-QCL modules may reduce costs over time, but immediate price relief for validated industrial deployments is unlikely.
Skilled Operator and Method Validation Dependencies
The IR spectroscopy market heavily relies on specialist labor for method development, despite software advancements simplifying routine operations. Developing and validating chemometric models for in-line pharmaceutical monitoring requires expertise in spectroscopy and process chemistry, a skill set that remains scarce in many regions. Method transfers between instruments or sites often trigger new validation cycles, causing delays and increasing reliance on original equipment manufacturer support. While progress is being made on open, instrument-agnostic spectral model approaches, consistent regulatory-grade model portability across platforms has yet to be achieved. Until regulators approve stronger portability frameworks, laboratories will face slow scaling and higher deployment challenges in the IR spectroscopy market.
*Our forecasts treat driver/restraint impacts as directional, not additive. The impact forecasts reflect baseline growth, mix effects, and variable interactions.
Segment Analysis
By Technology: Mid-Infrared Gains on NIR's Structural Base
In 2025, near-infrared (NIR) spectroscopy held 42.45% of the IR spectroscopy market, driven by its use in pharmaceutical raw material identification, grain testing, and food quality control. Its advantages, including fiber-optic compatibility, minimal sample preparation, and a strong reference library base, create switching barriers and support workflow continuity. NIR's suitability for at-line and in-line applications aligns with compliance and efficiency goals, maintaining its foundational role in industrial deployments despite the rise of newer technologies.
Mid-infrared (MIR) spectroscopy is projected to grow at a 7.25% CAGR through 2031, making it the fastest-growing segment. Its growth is fueled by semiconductor wafer quality control and the adoption of QCL-enabled mid-IR platforms, which offer superior speed and spatial resolution for specific tasks. Bruker’s LUMOS II ILIM QCL-based imaging microscope, launched in January 2025, exemplifies advancements in high-throughput tablet inspection and semiconductor defect analysis. Far-infrared spectroscopy, while niche, remains relevant for low-frequency vibrational analysis in polymers and crystallographic studies, supported by research-grade vacuum systems.


By Product Type: FTIR Spectrometers Recapture Growth From Benchtop Share Dominance
Benchtop spectrometers accounted for 44.56% of the IR spectroscopy market in 2025, reflecting their established role in academic labs, industrial quality control, and pharmaceutical testing. Their dominance stems from superior sensitivity, diverse configurations, and adaptability to varied sample types and methods. Benchtop systems remain preferred for high-throughput and flexible analytical needs, providing a stable revenue base even as the market shifts toward specialized instruments.
FTIR spectrometers are expected to grow at a 6.55% CAGR through 2031, driven by real-time quantitative analysis in continuous manufacturing and complex mixture identification. Bruker’s VERTEX NEO Ultra, launched in November 2025, highlights advancements in high-end benchtop FTIR systems for research. Portable and handheld spectrometers are expanding in field screening, forensic analysis, and goods verification. Hyphenated systems combining FTIR with GC, TGA, or rheometry are gaining traction in polymer and specialty chemical research, while micro spectrometers are drawing interest for compact inline probes in electronics and IoT-linked quality monitoring.
By Component: Detector Technology Underpins System Performance, Software Fastest
Detectors represented 38.65% of component revenue in 2025, emphasizing their critical role in system performance. MCT detectors in mid-IR and InGaAs arrays in NIR dominate due to their impact on sensitivity, speed, and application range. Cryogen-free thermoelectrically cooled MCT variants are gaining traction as they reduce liquid nitrogen dependency while maintaining performance. Detector selection remains closely tied to application economics and technical capability, benefiting suppliers with strong control over optical and detection elements.
Software and spectral libraries are projected to grow at a 6.88% CAGR through 2031, reflecting a shift toward analytics, model management, workflow control, and digital reference access. ACD/Labs' partnership expansion with MilliporeSigma in May 2025 strengthened digital reference workflows across pharma, biotech, and food QA and QC environments. Beam splitters, optics, and accessories support system customization, while consumables like ATR crystals and gas cells ensure recurring revenue. The industry is increasingly capturing value through software, even as hardware remains essential for credibility.
By Application: Pharma Dominates While Food and Beverage Takes the Growth Lead
Pharmaceuticals and biopharmaceuticals accounted for 46.93% of the IR spectroscopy market in 2025, driven by their role in raw material identification, in-process testing, and product release. Regulatory acceptance and high instrument density in GMP-regulated facilities provide a stable demand base, with buyers often bundling hardware with validation, service, and software contracts. While demand remains strong, growth is more measured compared to newer application areas.
Food and beverage testing is forecast to grow at a 7.45% CAGR through 2031, supported by stricter authenticity checks, contamination screening, and increased adoption of spectroscopic methods in regulatory testing. A 2025 study demonstrated the use of ATR-MIR with machine learning to detect palm olein adulteration in groundnut oil, showcasing advancements in routine testing. Chemicals and petrochemicals leverage inline FTIR gas analyzers for feedstock verification and emissions tracking. Environmental testing, forensics, security screening, and materials science also benefit from portable instruments and enhanced software, diversifying the application base while maintaining pharma as the largest revenue contributor.
By End User: Pharmaceutical Companies Anchor Revenue, Food Labs Drive Growth
Pharmaceutical and biopharmaceutical companies represented 39.77% of end-user revenue in 2025, reflecting dense instrument installations, recurring consumable demand, and long-term service commitments. Their purchasing patterns, including validation and compliance software, make them the most established end-user group, particularly in North America and Europe. Standardized platforms across large pharmaceutical sites reinforce vendor loyalty and influence product design priorities in high-compliance workflows.
Food testing laboratories are projected to grow at a 7.92% CAGR through 2031, driven by new lab formations in APAC and upgrades in response to stricter adulterant detection mandates. Industrial and manufacturing sectors are expanding usage in polymer, coating, and semiconductor quality control, supported by systems like Bruker’s Dimension IconIR300 for automated wafer inspections. Environmental testing labs are adopting FTIR-based emissions monitoring following updated U.S. EPA validation standards in 2024. Forensic labs and government institutions, while smaller in revenue, contribute significant unit demand due to their preference for handheld and field-deployable formats. The IR spectroscopy market is diversifying its buyer base, with growth extending beyond its traditional pharmaceutical stronghold.
Geography Analysis
In 2025, North America accounted for 40.25% of the IR spectroscopy market share, maintaining its position as the largest regional contributor. The U.S. drives this demand due to its pharmaceutical manufacturing concentration, strong regulatory framework, and high adoption of validated software and in-line measurement systems. Continuous manufacturing adoption is particularly favorable in this region, supported by facilities capable of meeting the capital, compliance, and data integration requirements of ICH Q13-aligned operations. Canada and Mexico, though smaller contributors, are adding demand through food processing, pharmaceutical production, and portable NIR use in routine inspections.
Europe held the second-largest regional position in the IR spectroscopy market, with Germany and the U.K. as key instrument markets and Switzerland and France as pharmaceutical R&D hubs. European Pharmacopoeia identity testing requirements and EMA alignment with ICH guidance support stable procurement in GMP-regulated environments. Germany also plays a critical role on the supply side, anchoring Bruker’s FTIR innovation and production footprint. Italy, Spain, and other European countries contribute through food quality control and environmental monitoring, while Eastern European laboratory networks are gradually expanding with a focus on food safety and environmental capabilities.
The Asia-Pacific IR spectroscopy market is projected to grow at an 8.12% CAGR through 2031, the fastest regional growth rate. China’s 14th Five-Year Plan for intelligent manufacturing is driving domestic procurement of high-end analytical instruments and increasing substitution pressure on foreign systems. India’s expanding CDMO base is fueling demand for mid-range FTIR platforms to meet USP <857> raw material identification requirements. South Korea and Taiwan are experiencing growth due to advanced semiconductor fabs requiring non-destructive mid-IR characterization for 300 mm wafer inspections. Japan and Australia remain steady contributors, driven by food safety testing and research demand. The Middle East, Africa, and South America currently hold smaller shares, but GCC pharmaceutical manufacturing investments and Brazil’s food authentication enforcement are expected to boost procurement after 2028.

Competitive Landscape
The IR spectroscopy market remains moderately concentrated, with Thermo Fisher Scientific, Bruker Corporation, Agilent Technologies, Shimadzu Corporation, and PerkinElmer forming the main competitive core. These companies benefit from broad installed bases, application depth, service networks, and the ability to bundle instruments with software, validation support, and accessories. Their scale matters because buyers in regulated environments often prefer vendors that can support lifecycle management across multiple sites. Even so, the IR spectroscopy market is not closed, as mid-tier vendors and niche suppliers are gaining ground through AI-focused analytics, portable formats, and targeted application design.
A common strategy among large vendors is platform extension rather than isolated product launches. Bruker’s VERTEX NEO R launch in February 2025 and the later VERTEX NEO Ultra launch in November 2025 demonstrate how vendors are building unified hardware and software ecosystems that can cover multiple measurement conditions over a single product family’s lifecycle. PerkinElmer followed a similar path in March 2026 with the Spotlight Aurora-I, which introduced intelligent adaptive IR imaging for pharmaceutical QA and QC, microplastics analysis, and packaging and coatings work. Wiley’s database of more than 250,000 AI-predicted IR spectra highlights how data assets are becoming a competitive differentiator, even for firms that are not instrument manufacturers.
Competitive pressure is also coming from adjacent analytical specialists and handheld-first entrants. In May 2026, 908 Devices acquired NIRLAB AG for USD 15 million upfront with up to USD 8 million in earnout, strengthening its field narcotics identification offering and emphasizing the value of AI-enabled, cloud-connected NIR tools at the point of use. VIGO Photonics’ acquisition of InfraRed Associates assets in 2024 reflects detector suppliers’ efforts to secure a stronger position in the system value chain.
IR Spectroscopy Industry Leaders
Thermo Fisher Scientific Inc.
Bruker Corporation
Agilent Technologies, Inc.
PerkinElmer, Inc.
Shimadzu Corporation
- *Disclaimer: Major Players sorted in no particular order

Recent Industry Developments
- May 2026: 908 Devices acquired NIRLAB AG, Lausanne, Switzerland, for USD 15 million upfront and up to USD 8 million in earnout. This acquisition integrates AI-powered, cloud-connected NIR spectroscopy into its portfolio, enhancing handheld narcotics identification. The deal highlights the shift toward subscription-based models combining forensic screening and AI-driven spectral platforms.
- March 2026: PerkinElmer launched the Spotlight Aurora-I FTIR Microscope at Analytica Munich 2026, expanding its Aurora series. The system features intelligent adaptive IR imaging for pharmaceutical QA/QC, microplastics analysis, and packaging and coatings development, with automated workflows designed for regulatory compliance.
- November 2025: Bruker Corporation introduced the VERTEX NEO Ultra, its most advanced benchtop vacuum FT-IR spectrometer. Offering 0.04 cm⁻¹ spectral resolution and support for up to six simultaneous detectors via MultiTect technology, it targets applications in catalysis, space technology, and battery materials research requiring ultra-high-resolution measurements.
- June 2025: The Fraunhofer Institute for Applied Solid State Physics, IAF, unveiled a semi-automated pick-and-place process for MOEMS-EC-QCL modules. This innovation reduces high assembly costs, facilitating the industrial adoption of QCL in mid-IR spectroscopy and scaling production from lab to industry volumes.


Global IR Spectroscopy Market Report Scope
As per the scope of the report, Infrared (IR) spectroscopy is an analytical technique used to identify chemical substances by measuring how they absorb infrared radiation. Because specific molecular bonds and functional groups absorb light at characteristic frequencies, the resulting spectrum serves as a unique "molecular fingerprint" used for material identification and structural analysis.
The IR spectroscopy market is segmented by technology, product type, component, application, end-user, and geography. By technology, the market includes near-infrared spectroscopy, mid-infrared spectroscopy, and far-infrared spectroscopy. By product type, the market is segmented into FTIR spectrometers, benchtop spectrometers, portable and handheld spectrometers, micro spectrometers, and hyphenated spectrometers. By component, the market is categorized into light sources, detectors, beam splitters and optics, accessories and consumables, and software and spectral libraries. By application, the market is segmented into pharmaceuticals and biopharmaceuticals, chemicals and petrochemicals, food and beverage testing, environmental testing, forensics and security screening, materials science and polymers, semiconductor and electronics, and others. By end-user, the market is segmented into pharmaceutical and biopharmaceutical companies, industrial and manufacturing companies, food testing laboratories, environmental testing laboratories, forensic laboratories, academic and research institutes, and government and regulatory laboratories. By geography, the market is analyzed across North America, Europe, Asia-Pacific, the Middle East and Africa, and South America. The report also covers the estimated market sizes and trends for 17 countries across major regions globally. The report offers the market sizes and forecasts in terms of value (USD) for the above segments.
| Near-Infrared Spectroscopy |
| Mid-Infrared Spectroscopy |
| Far-Infrared Spectroscopy |
| FTIR Spectrometers |
| Benchtop Spectrometers |
| Portable and Handheld Spectrometers |
| Micro Spectrometers |
| Hyphenated Spectrometers |
| Light Sources |
| Detectors |
| Beam Splitters and Optics |
| Accessories and Consumables |
| Software and Spectral Libraries |
| Pharmaceuticals and Biopharmaceuticals |
| Chemicals and Petrochemicals |
| Food and Beverage Testing |
| Environmental Testing |
| Forensics and Security Screening |
| Materials Science and Polymers |
| Semiconductor and Electronics |
| Others |
| Pharmaceutical and Biopharmaceutical Companies |
| Industrial and Manufacturing Companies |
| Food Testing Laboratories |
| Environmental Testing Laboratories |
| Forensic Laboratories |
| Academic and Research Institutes |
| Government and Regulatory Laboratories |
| North America | United States |
| Canada | |
| Mexico | |
| Europe | Germany |
| United Kingdom | |
| France | |
| Italy | |
| Spain | |
| Rest of Europe | |
| Asia-Pacific | China |
| India | |
| Japan | |
| Australia | |
| South Korea | |
| Rest of Asia-Pacific | |
| Middle East and Africa | GCC |
| South Africa | |
| Rest of Middle East and Africa | |
| South America | Brazil |
| Argentina | |
| Rest of South America |
| By Technology | Near-Infrared Spectroscopy | |
| Mid-Infrared Spectroscopy | ||
| Far-Infrared Spectroscopy | ||
| By Product Type | FTIR Spectrometers | |
| Benchtop Spectrometers | ||
| Portable and Handheld Spectrometers | ||
| Micro Spectrometers | ||
| Hyphenated Spectrometers | ||
| By Component | Light Sources | |
| Detectors | ||
| Beam Splitters and Optics | ||
| Accessories and Consumables | ||
| Software and Spectral Libraries | ||
| By Application | Pharmaceuticals and Biopharmaceuticals | |
| Chemicals and Petrochemicals | ||
| Food and Beverage Testing | ||
| Environmental Testing | ||
| Forensics and Security Screening | ||
| Materials Science and Polymers | ||
| Semiconductor and Electronics | ||
| Others | ||
| By End User | Pharmaceutical and Biopharmaceutical Companies | |
| Industrial and Manufacturing Companies | ||
| Food Testing Laboratories | ||
| Environmental Testing Laboratories | ||
| Forensic Laboratories | ||
| Academic and Research Institutes | ||
| Government and Regulatory Laboratories | ||
| By Geography | North America | United States |
| Canada | ||
| Mexico | ||
| Europe | Germany | |
| United Kingdom | ||
| France | ||
| Italy | ||
| Spain | ||
| Rest of Europe | ||
| Asia-Pacific | China | |
| India | ||
| Japan | ||
| Australia | ||
| South Korea | ||
| Rest of Asia-Pacific | ||
| Middle East and Africa | GCC | |
| South Africa | ||
| Rest of Middle East and Africa | ||
| South America | Brazil | |
| Argentina | ||
| Rest of South America | ||


Key Questions Answered in the Report
What is the current size of the IR spectroscopy market?
The IR spectroscopy market size stands at USD 1.44 billion in 2026 and is projected to reach USD 1.92 billion by 2031 at a 5.98% CAGR.
Which technology leads revenue in infrared spectroscopy?
Near-infrared spectroscopy led the technology mix with a 42.45% revenue share in 2025, supported by pharmaceutical, food, and grain testing use cases.
Which product category is growing the fastest?
FTIR spectrometers are forecast to grow at a 6.55% CAGR through 2031 because of stronger use in continuous manufacturing and complex mixture analysis.
Which application area contributes the most revenue?
Pharmaceuticals and biopharmaceuticals held the largest application share at 46.93% in 2025 due to raw material ID, in-process testing, and finished-product release use.
Which end-user group is expanding the quickest?
Food testing laboratories are expected to post the fastest end-user growth at 7.92% CAGR through 2031 as authenticity and contamination checks become more routine.
Which region offers the strongest growth outlook?
Asia-Pacific has the fastest regional outlook with an 8.12% CAGR through 2031, driven by Chinas instrument push, Indias CDMO growth, and semiconductor demand in South Korea and Taiwan.
Page last updated on:


