Spectroscopy Software Market Size and Share
Market Overview
| Study Period | 2020 - 2031 |
|---|---|
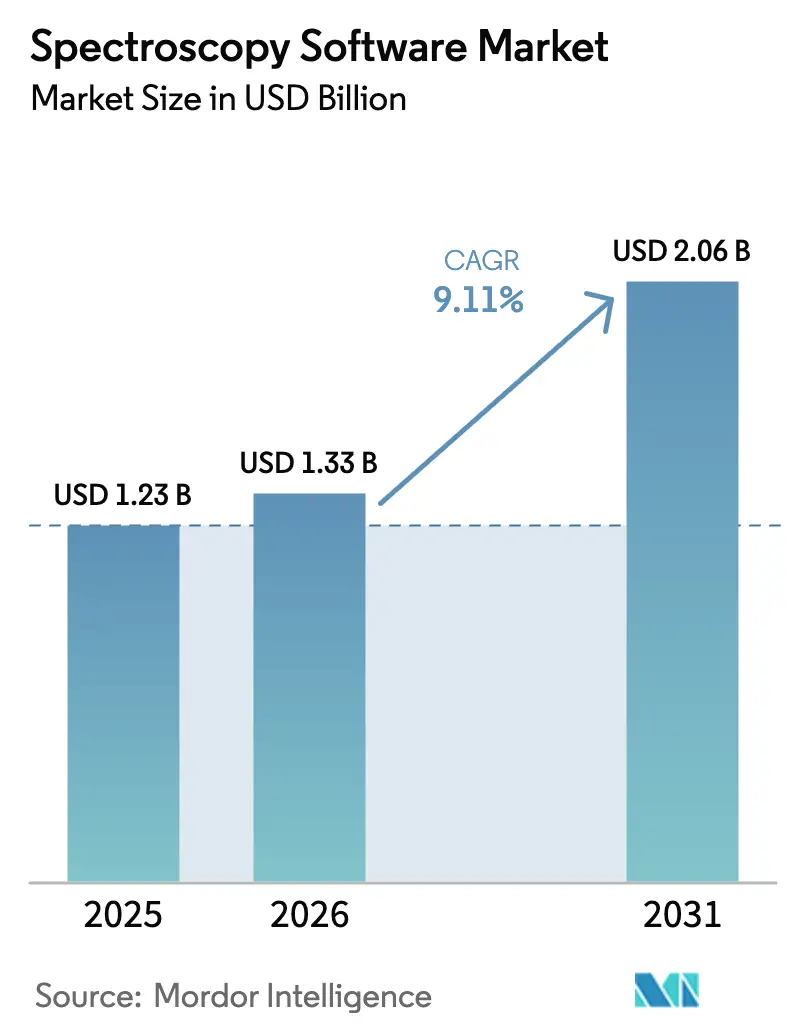
| Market Size (2026) | USD 1.33 Billion |
| Market Size (2031) | USD 2.06 Billion |
| Growth Rate (2026 - 2031) | 9.11% CAGR |
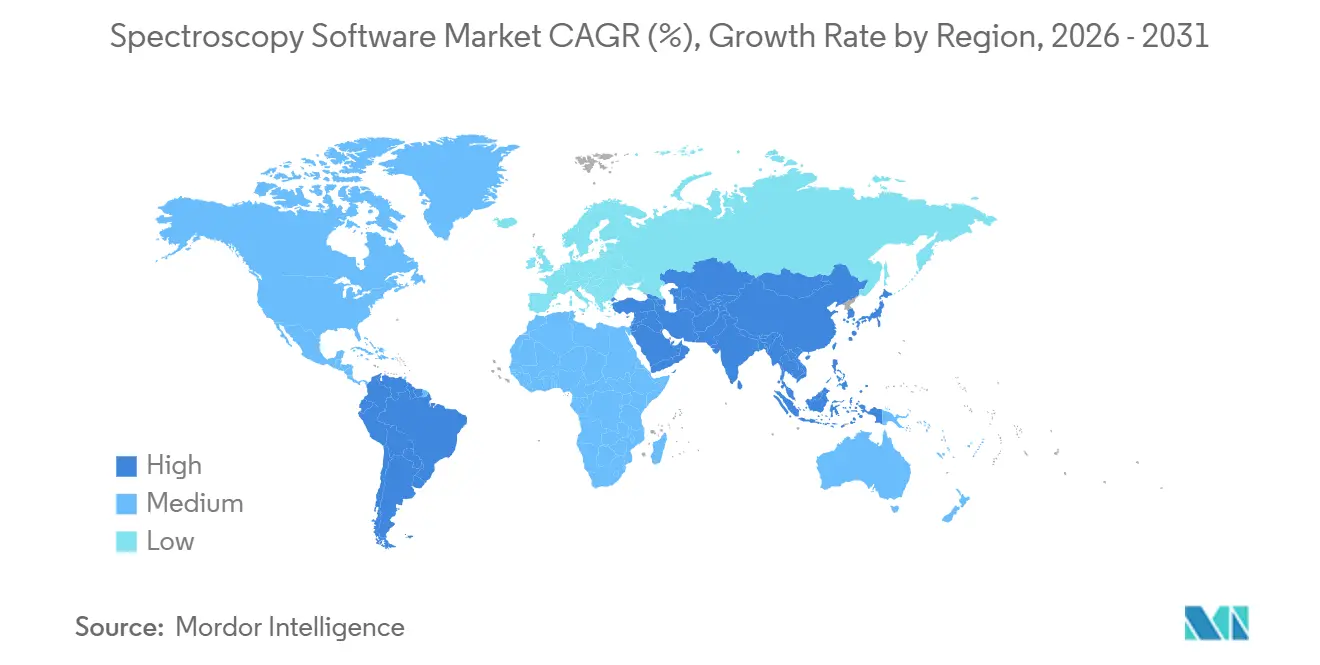
| Fastest Growing Market | Asia Pacific |
| Largest Market | North America |
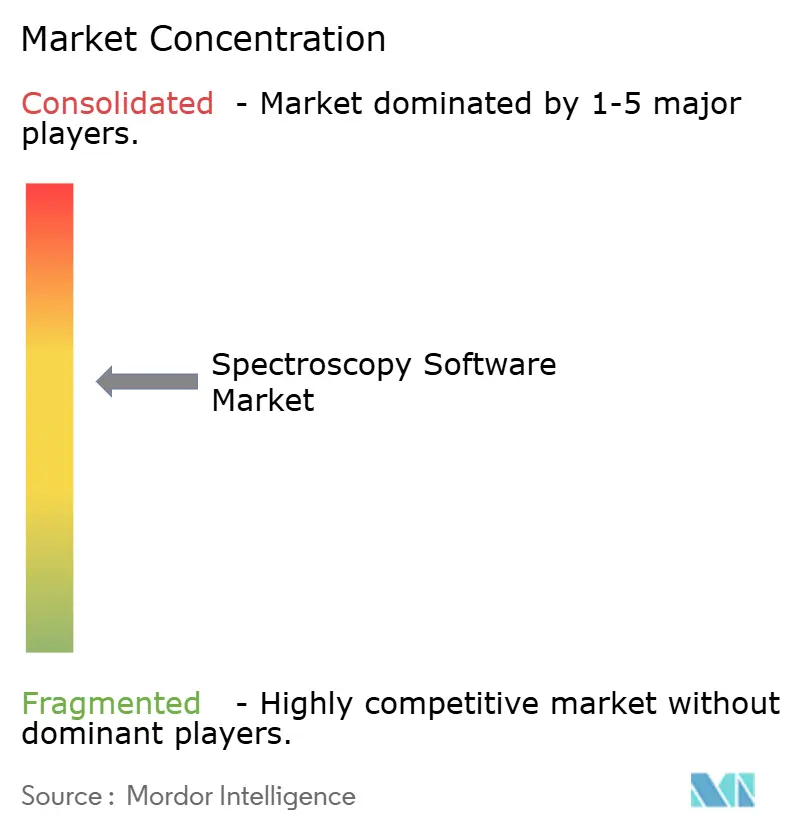
| Market Concentration | Medium |
Major Players *Disclaimer: Major Players sorted in no particular order Image © Mordor Intelligence. Reuse requires attribution under CC BY 4.0. | |
Spectroscopy Software Market Analysis by Mordor Intelligence
The Spectroscopy Software Market size is projected to expand from USD 1.23 billion in 2025 and USD 1.33 billion in 2026 to USD 2.06 billion by 2031, registering a CAGR of 9.11% between 2026 to 2031.
Growing demand for validated digital quality-control workflows, pressure to shorten analytical turnaround times, and the shift toward hardware-agnostic Software-as-a-Service (SaaS) models are expanding the spectroscopy software market across regulated and research environments. Pharmaceutical and biotechnology laboratories are accelerating upgrades because regulators now expect electronic audit trails and real-time compliance reporting, while tariff pressures on bundled hardware-software deals encourage unbundling in favor of flexible subscriptions that sidestep import duties. Competitive strategies are evolving from instrument performance differentiation toward software ecosystem lock-in, with leading vendors embedding open APIs and artificial-intelligence toolkits to secure recurring subscription revenue. Meanwhile, buyers perceive opportunities to extend hardware lifecycles, lower capital expenditure, and enable multi-site collaboration through cloud-based platforms, adding momentum to the spectroscopy software market in both mature and emerging economies.
Key Report Takeaways
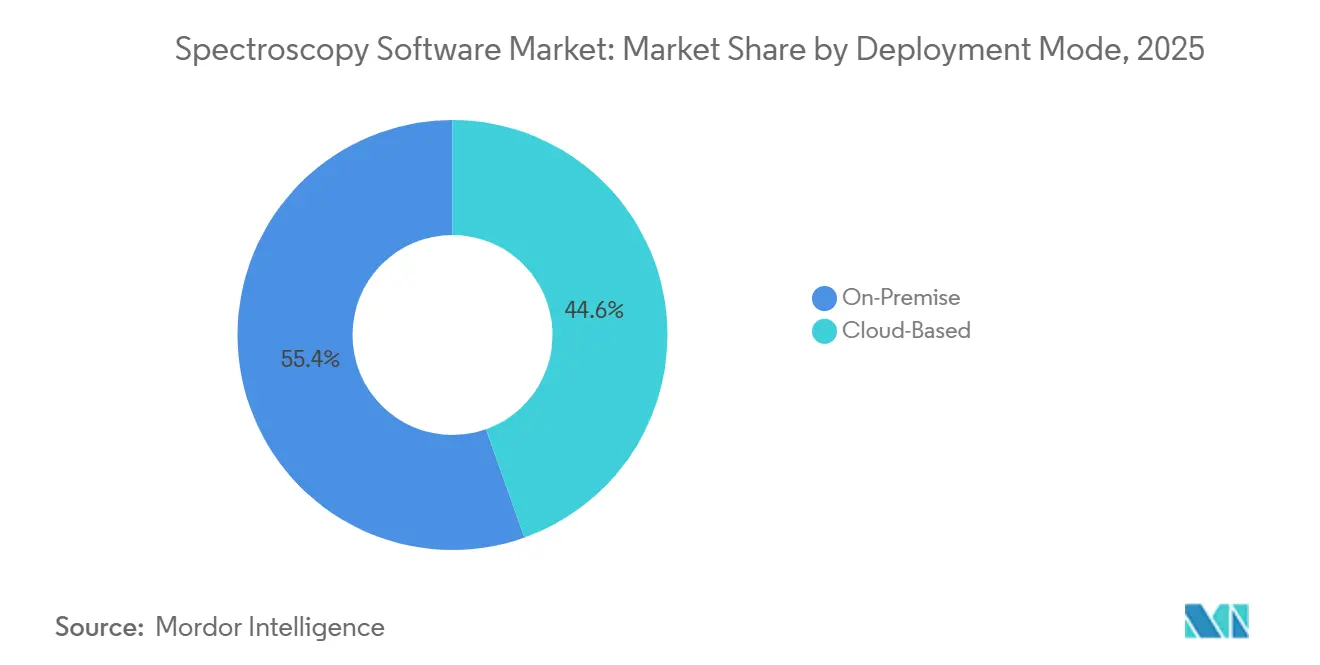
- By deployment mode, on-premise systems captured 55.43% of the spectroscopy software market share in 2025, yet cloud platforms are forecast to expand at a 13.43% CAGR through 2031.
- By spectroscopy technique, infrared solutions led with 27.44% revenue share in 2025, while Raman software is poised for the quickest advance at a 12.44% CAGR over the same span.
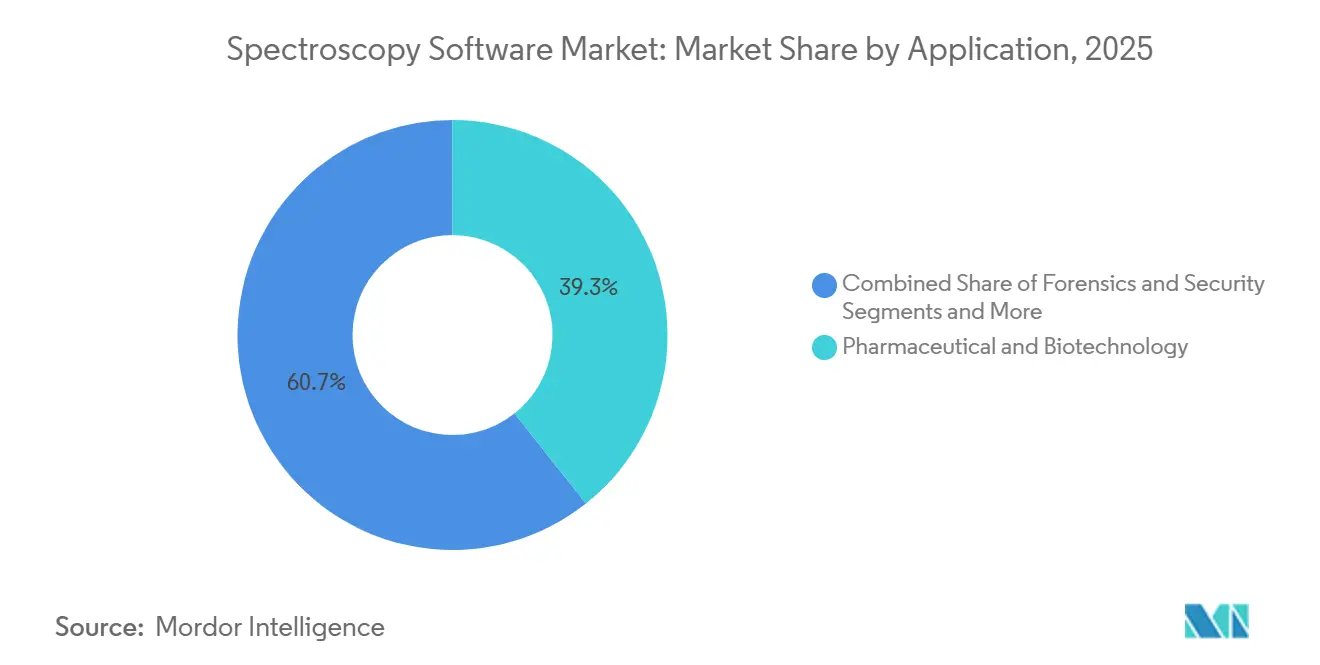
- By application, pharmaceutical and biotechnology workflows held 39.34% of 2025 revenue, whereas food and beverage quality testing is expected to post a 12.65% CAGR to 2031.
- By software functionality, data analysis and chemometrics accounted for 37.77% of 2025 spending, even as compliance and audit-trail modules are projected to increase at an 11.57% CAGR to 2031.
- By geography, North America dominated with 41.22% of 2025 revenue, and Asia-Pacific is forecast to climb at an 11.88% CAGR through 2031.
Note: Market size and forecast figures in this report are generated using Mordor Intelligence’s proprietary estimation framework, updated with the latest available data and insights as of January 2026.
Global Spectroscopy Software Market Trends and Insights
Drivers Impact Analysis*
| Driver | (~) % Impact on CAGR Forecast | Geographic Relevance | Impact Timeline |
|---|---|---|---|
| Pharma-biotech R&D spending surge | +2.5% | North America, Western Europe, China | Medium term (2-4 years) |
| Regulatory push for validated digital QC | +2.0% | Global, strongest in United States and European Union | Short term (≤ 2 years) |
| Cloud adoption to cut capital outlays | +1.8% | Early uptake in North America and Western Europe | Medium term (2-4 years) |
| AI-driven analytics speeding time-to-insight | +2.2% | North America and Asia-Pacific innovation hubs | Medium term (2-4 years) |
| Tariff-driven shift toward hardware-agnostic SaaS | +0.8% | United States, China, European Union trade lanes | Short term (≤ 2 years) |
| Open spectral-API marketplaces monetizing models | +0.5% | Academic and open-science communities worldwide | Long term (≥ 4 years) |
| Source: Mordor Intelligence | |||
Pharma-Biotech R&D Spending Surge
Escalating investments in biologics characterization and small-molecule screening are boosting demand for software that extracts deeper insights from existing instruments rather than new hardware. ICH Q2(R2) and Q14 guidelines finalized in 2023 and enforced through 2025 require lifecycle validation of analytical procedures, motivating laboratories to deploy platforms that automate method transfer, track instrument performance, and create audit-ready validation reports.[1]U.S. Food and Drug Administration, “ICH Q2(R2) Validation of Analytical Procedures,” FDA, fda.gov Thermo Fisher’s 2024 launch of the Stellar mass spectrometer bundled with the Ardia platform exemplifies this trend; Ardia offers built-in 21 CFR Part 11 templates and RESTful API connections to enterprise LIMS, trimming validation timelines. Contract research organizations value cloud-enabled deployments that support sponsor oversight without duplicating server infrastructure, while Chinese demand rebounded in 2025 as revised pharmacopoeial standards spurred orders for validated software.
Regulatory Push for Validated Digital QC
Agencies worldwide have intensified data-integrity enforcement, insisting on electronic audit trails, time-stamped records, and role-based access controls that spreadsheets cannot provide.[2]European Medicines Agency, “Annex 11: Computerised Systems,” EMA, ema.europa.eu Warning letters citing inadequate audit trails have accelerated software replacement cycles in pharmaceutical quality-control labs. Agilent responded in 2024 with MicroLab 5.8, Pharma 5.8, and Expert 1.3 releases featuring granular audit-trail logging and electronic signatures. ISO/IEC 17025 accreditation for testing laboratories now mandates validated software, extending the compliance imperative into food safety and environmental sectors.[3]International Organization for Standardization, “ISO/IEC 17025:2017 General Requirements for the Competence of Testing and Calibration Laboratories,” ISO, iso.org As regulators converge on similar digital requirements, vendors offering comprehensive compliance modules are capturing disproportionate share in the spectroscopy software market.
Cloud Adoption to Cut Capex & Enable Collaboration
Laboratories increasingly host spectroscopy data workflows on cloud platforms to eliminate local servers, enable remote collaboration, and scale computing power during intensive chemometrics runs. TetraScience raised USD 125 million in Series C funding in 2024 for its vendor-neutral data-cloud that harmonizes files across multiple instrument brands. Browser-based tools such as ACD/Labs’ Spectrus Platform allow chemists to access spectral libraries from any location, a valuable feature for distributed research teams. Data-sovereignty rules in the European Union and China complicate cross-border deployments, but hybrid architectures that keep sensitive data on-premise while offloading heavy computations to the cloud are mitigating these barriers.
AI-Driven Analytics Speeding Time-to-Insight
Artificial-intelligence algorithms embedded in spectroscopy software automate peak identification, predict spectra, and flag anomalies that human analysts might miss. Bruker’s timsMetabo, launched in 2025, reduces untargeted metabolomics analysis from days to hours. Thermo Fisher’s GRAMS Suite 9.0 incorporates generative models trained on millions of reference spectra to suggest compound IDs with confidence scores. Open-source initiatives such as AutoOpenRaman supply annotated datasets that allow laboratories to train custom models without paying for proprietary libraries. Regulatory guidance on validating AI algorithms in laboratory software remains emergent, so vendors position AI modules as decision-support tools rather than autonomous methods, easing implementation in research contexts while full compliance frameworks evolve.
Restraints Impact Analysis*
| Restraint | (~) % Impact on CAGR Forecast | Geographic Relevance | Impact Timeline |
|---|---|---|---|
| High license and validation costs | -0.6% | Emerging markets and small-to-mid-sized labs worldwide | Short term (≤ 2 years) |
| Skill shortage in chemometrics and data science | -0.7% | Acute in Asia-Pacific and Latin America | Medium term (2-4 years) |
| Data-sovereignty barriers to cloud adoption | -0.5% | European Union, China, Russia | Short term (≤ 2 years) |
| Proprietary file formats causing vendor lock-in | -0.4% | Multi-vendor laboratory environments | Long term (≥ 4 years) |
| Source: Mordor Intelligence | |||
High License & Validation Costs
Enterprise-level spectroscopy platforms can cost more than USD 50,000 per seat, with validation services adding USD 20,000 to USD 100,000 per installation. Pharmaceutical users must generate installation, operational, and performance qualification documentation and maintain rigorous change control, a process lasting six months and consuming quality-assurance resources. Cloud-based subscriptions spread costs over time, yet many laboratories hesitate to entrust proprietary formulations to external providers. Currency volatility, import duties, and limited access to vendor services exacerbate affordability issues in emerging economies, pushing vendors to launch tiered pricing schemes.
Skill Shortage in Chemometrics & Data Science
Advanced software demands expertise in multivariate statistics, principal-component analysis, and machine-learning validation, skills that remain scarce even in developed countries. Universities seldom include chemometrics in undergraduate curricula, leaving graduates ill-prepared. Shared facilities in India, for example, process thousands of samples annually but often rely on basic acquisition tools because staff lack confidence in complex data-analysis modules. Vendors embed AI-assisted wizards, though outputs still need informed oversight, limiting uptake in regulated environments.
*Our forecasts treat driver/restraint impacts as directional, not additive. The impact forecasts reflect baseline growth, mix effects, and variable interactions.
Segment Analysis
By Deployment Mode: Cloud Platforms Erode On-Premise Dominance
Cloud platforms generated 44.57% of revenue in 2026 and are forecast to surpass on-premise installations before 2029, supported by a 13.43% CAGR that outpaces overall spectroscopy software market growth. Early adopters include contract research organizations that manage multi-site studies requiring instantaneous data sharing, as well as academic consortia that lack the budget for redundant server farms. The spectroscopy software market size for cloud deployments is projected to exceed USD 860 million by 2031, illustrating the scale of migration underway.
Hybrid architectures are central to the transition. Vendors offer local data-caching appliances for sensitive information while routing compute-intensive chemometrics to the cloud, lowering latency and meeting data-residency mandates. On-premise systems remain prevalent in forensic laboratories handling chain-of-custody evidence and in defense contractors’ classified environments. Even there, demand for rapid feature updates is nudging users toward private-cloud instances managed behind institutional firewalls, indicating that the cloud trajectory is unlikely to reverse.


By Spectroscopy Technique: Raman Software Gains on Infrared’s Installed Base
Infrared applications led the spectroscopy software market with a 27.44% share in 2025 thanks to entrenched pharmacopeial methods and extensive spectral libraries. However, Raman solutions are advancing at a 12.44% CAGR, the fastest among techniques, propelled by counterfeit drug detection, polymer quality control, and portable field analysis. By 2031 Raman’s share is expected to approach one-quarter of total spending, narrowing the gap with infrared.
The spectroscopy software market size for Raman tools is forecast to reach USD 480 million by 2031 as customs agencies deploy handheld devices linked to cloud databases for real-time material identification. Mass-spectrometry and NMR software continue to gain share in proteomics and structure elucidation, respectively, but their growth rates trail Raman’s due to higher instrument costs. UV-visible remains flat, demonstrating that specificity and non-destructive capabilities are the key determinants of segment momentum.
By Application: Food Safety Testing Outpaces Pharmaceutical Growth
Pharmaceutical and biotechnology workflows still generate the largest slice of spending, yet food-and-beverage quality testing is advancing at a 12.65% CAGR, the highest among applications. Heightened contaminant limits under the Food Safety Modernization Act and retailer mandates for real-time certificates are fueling software upgrades that automate method validation and reporting. As a result, the spectroscopy software market size for food safety is set to double between 2026 and 2031.
Environmental monitoring remains a mid-single-digit growth area as governments mandate continuous emissions tracking. Forensics, security, and polymer applications together comprise a stable yet secondary revenue pool, though the rollout of portable Raman devices for law-enforcement fieldwork is boosting demand for rugged, browser-based applications. Academic and research usage is smaller in dollar terms but influential in setting open-source standards that eventually spill over into commercial offerings.

By Software Functionality: Compliance Modules Surge Past Data Analysis
Data-analysis and chemometrics tools generated 37.77% of 2025 spending, but compliance and audit-trail modules will climb at an 11.57% CAGR, overtaking stand-alone analytics by 2030. Laboratories facing intense scrutiny opt for integrated platforms that log every data modification and apply electronic signatures in line with FDA 21 CFR Part 11 and EMA Annex 11. Consequently, the spectroscopy software market share for compliance-oriented packages is projected to rise by at least five percentage points over the forecast horizon.
Instrument-control software is now bundled with hardware at marginal cost, limiting its revenue contribution. Integration middleware that funnels spectra into enterprise LIMS and ELN environments is emerging as the third-fastest functionality segment, reflecting broader digital-laboratory transformations. Vendors achieving seamless interoperability win strategic preference, especially among multi-vendor facilities that resist vendor lock-in.
Geography Analysis
North America retained 41.22% of revenue in 2025, supported by stringent FDA enforcement and a dense cluster of pharmaceutical R&D sites. United States laboratories accelerated replacement of legacy systems lacking audit trails, while contract research organizations adopted cloud suites that facilitate sponsor supervision across continents. Canadian laboratories embraced spectroscopy software for cannabis potency testing, and Mexico’s contract manufacturing sector invested in validated platforms to retain export certifications.
Asia-Pacific is forecast to expand at an 11.88% CAGR through 2031, the fastest regional tempo. China’s revised pharmacopoeia reignited spending in 2025 after a muted 2024, and local vendors established regional data centers to comply with cyber-security rules. India’s network of Sophisticated Analytical Instrument Facilities processes more than 125,000 samples annually; although many still rely on basic acquisition programs, capacity upgrades are opening space for cloud subscriptions that distribute costs over time. Japan’s Digital Laboratory consortium, anchored by Rigaku, built integrated spectroscopy data pipelines in late 2024, demonstrating government-backed support for digital science.
Europe contributed a significant share in 2025, led by Germany, France, and the United Kingdom, yet cloud adoption lagged because GDPR forces data-center localization. Vendors responded by launching European cloud zones, adding operational overhead but unlocking growth in 2026. Environmental-monitoring initiatives in Scandinavia and water-quality mandates in Spain further diversified demand. The Middle East and Africa and South America together represent a single-digit share, though tightening food-safety rules and mining sector modernization are catalyzing incremental orders for portable spectroscopy solutions integrated with browser-based analytics.

Competitive Landscape
Market concentration is moderate. Instrument giants such as Thermo Fisher, Agilent, Bruker, Waters, and Shimadzu bundle proprietary software with their hardware, leveraging locked file formats to create switching costs. Pure-play vendors including Advanced Chemistry Development, Genedata, and SpectralWorks pursue multi-vendor compatibility and open APIs, attracting laboratories that operate diverse instrument fleets. TetraScience embodies the platform model, raising USD 125 million in 2024 for a data and AI cloud that normalizes file formats from multiple brands.
Strategic moves highlight the software shift. Bruker embedded AI metabolite identification within timsMetabo to differentiate on analytics rather than detector sensitivity. Thermo Fisher’s Chromeleon 7.4, launched in September 2025, unified chromatography and mass-spectrometry workflows in a compliance-ready environment, tightening its ecosystem. Agilent forged partnerships with major LIMS providers to secure end-to-end data integrity across the laboratory lifecycle. Open-source initiatives such as SpectraFit and AutoOpenRaman are nibbling at the low-end by offering free tools that satisfy academia and small enterprises, pressuring incumbents to release freemium tiers.
Interoperability is the new battleground. Vendors publish developer portals and charge subscription fees for advanced API access, monetizing third-party app ecosystems much like smartphone operating systems. Cloud infrastructure partnerships are equally strategic, with regional data-center deployments enabling compliance with Europe’s GDPR and China’s Cybersecurity Law. As buyers look past instrument resolution toward digital workflows, software differentiation will determine the pace of revenue capture in the spectroscopy software market.
Spectroscopy Software Industry Leaders
Agilent Technologies Inc.
Bruker Corporation
Revvity Inc
Shimadzu Corporation
Thermo Fisher Scientific Inc.
- *Disclaimer: Major Players sorted in no particular order

Recent Industry Developments
- September 2025: Thermo Fisher Scientific launched Chromeleon 7.4, an enterprise data system that supports single-quad, triple-quad, and high-resolution mass spectrometry in regulated and research environments.
- May 2025: Bruker Corporation released timsMetabo software, embedding AI-driven metabolite identification that cuts untargeted metabolomics analysis time from days to hours
- September 2024: Advanced Chemistry Development introduced Spectrus Platform 2024, delivering browser-based NMR, MS, and IR data analytics and eliminating desktop install requirements.


Global Spectroscopy Software Market Report Scope
Spectroscopy software is a specialized application used to control spectroscopy hardware for acquiring, processing, interpreting, and visualizing spectral data, enabling the analysis of matter's interaction with electromagnetic radiation.
The Spectroscopy Software Market Report is segmented by Deployment Mode, Spectroscopy Technique, Application, Software Functionality, and Geography. By Deployment Mode, the market is segmented into On-Premise and Cloud-Based. By Spectroscopy Technique, the market is segmented into Infrared, UV-Visible, Raman, Mass Spectrometry, NMR, and Others. By Application, the market is segmented into Pharmaceutical & Biotechnology, Food & Beverage Quality Testing, Environmental Monitoring, Forensics & Security, Polymer & Material Science, and Academic & Research. By Software Functionality, the market is segmented into Data Acquisition & Instrument Control, Data Analysis & Chemometrics, Spectral Interpretation & Reporting, Compliance & Audit-Trail Management, and Integration APIs & Middleware. By Geography, the market is segmented into North America, Europe, Asia-Pacific, the Middle East & Africa, and South America. The market report also covers the estimated market sizes and trends for 17 countries across major regions globally. Market Forecasts are Provided in Terms of Value (USD).
| On-Premise |
| Cloud-Based |
| Infrared (IR) |
| UV-Visible |
| Raman |
| Mass Spectrometry |
| NMR |
| Others |
| Pharmaceutical & Biotechnology |
| Food & Beverage Quality Testing |
| Environmental Monitoring |
| Forensics & Security |
| Polymer & Material Science |
| Academic & Research |
| Data Acquisition & Instrument Control |
| Data Analysis & Chemometrics |
| Spectral Interpretation & Reporting |
| Compliance & Audit-Trail Management |
| Integration APIs & Middleware |
| North America | United States |
| Canada | |
| Mexico | |
| Europe | Germany |
| France | |
| United Kingdom | |
| Italy | |
| Spain | |
| Rest of Europe | |
| Asia-Pacific | China |
| Japan | |
| India | |
| South Korea | |
| Australia | |
| Rest of Asia-Pacific | |
| Middle East & Africa | GCC |
| South Africa | |
| Rest of Middle East & Africa | |
| South America | Brazil |
| Argentina | |
| Rest of South America |
| By Deployment Mode | On-Premise | |
| Cloud-Based | ||
| By Spectroscopy Technique | Infrared (IR) | |
| UV-Visible | ||
| Raman | ||
| Mass Spectrometry | ||
| NMR | ||
| Others | ||
| By Application | Pharmaceutical & Biotechnology | |
| Food & Beverage Quality Testing | ||
| Environmental Monitoring | ||
| Forensics & Security | ||
| Polymer & Material Science | ||
| Academic & Research | ||
| By Software Functionality | Data Acquisition & Instrument Control | |
| Data Analysis & Chemometrics | ||
| Spectral Interpretation & Reporting | ||
| Compliance & Audit-Trail Management | ||
| Integration APIs & Middleware | ||
| By Geography | North America | United States |
| Canada | ||
| Mexico | ||
| Europe | Germany | |
| France | ||
| United Kingdom | ||
| Italy | ||
| Spain | ||
| Rest of Europe | ||
| Asia-Pacific | China | |
| Japan | ||
| India | ||
| South Korea | ||
| Australia | ||
| Rest of Asia-Pacific | ||
| Middle East & Africa | GCC | |
| South Africa | ||
| Rest of Middle East & Africa | ||
| South America | Brazil | |
| Argentina | ||
| Rest of South America | ||


Key Questions Answered in the Report
How fast is the spectroscopy software market expected to expand?
The market is projected to grow at a 9.11% CAGR between 2026 and 2031, reaching USD 2.06 billion by the end of the period.
Which deployment model is gaining traction among laboratories?
Cloud platforms are advancing at a 13.43% CAGR as users seek lower capital costs and easier collaboration across sites.
What technique segment is poised for the quickest growth?
Raman solutions are forecast to rise at a 12.44% CAGR, driven by portable, non-destructive applications in pharmaceuticals and polymers.
Why are compliance modules seeing higher demand than pure data-analysis tools?
Intensified regulatory scrutiny requires electronic audit trails and validated records, prompting laboratories to prioritize compliance-ready software.
Which region is expected to lead future growth?
Asia-Pacific is set to record the fastest regional expansion at an 11.88% CAGR, propelled by updated pharmacopoeial standards and digital-lab initiatives.
What factors constrain broader adoption in emerging markets?
High licensing and validation expenses plus a shortage of chemometrics expertise limit upgrades, although tiered pricing and training programs are helping bridge the gap.
Page last updated on:


