Atomic Absorption Spectrometer Market Size and Share
Market Overview
| Study Period | 2019 - 2030 |
|---|---|
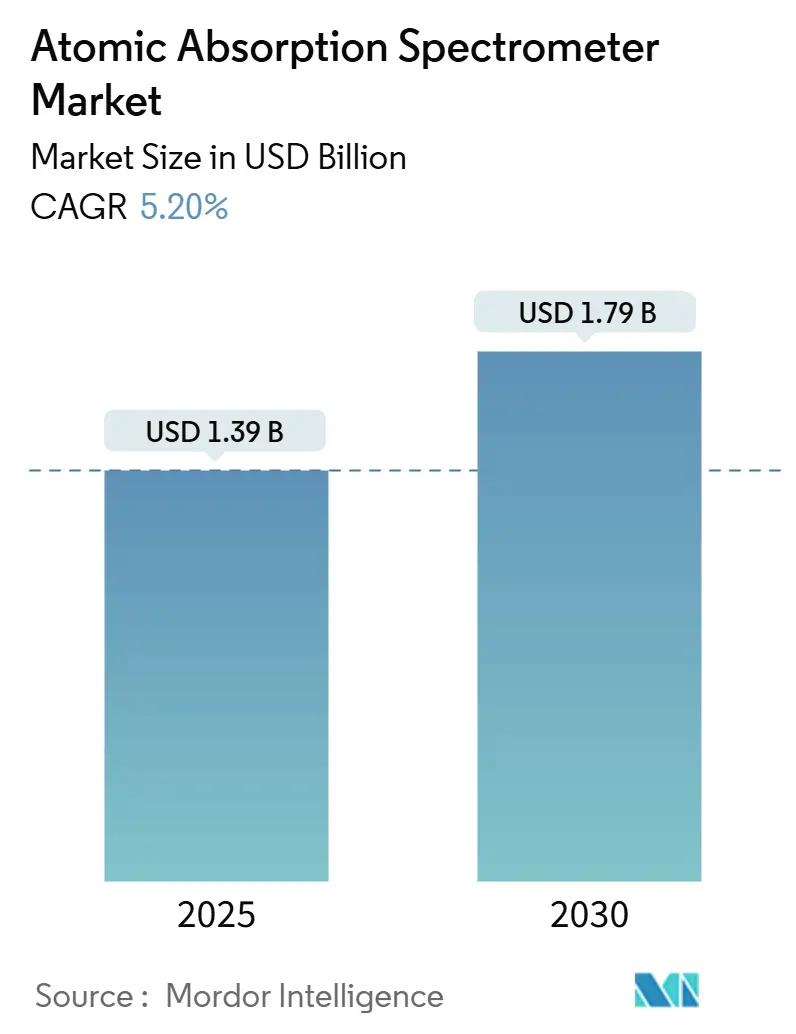
| Market Size (2025) | USD 1.39 Billion |
| Market Size (2030) | USD 1.79 Billion |
| Growth Rate (2025 - 2030) | 5.20% CAGR |
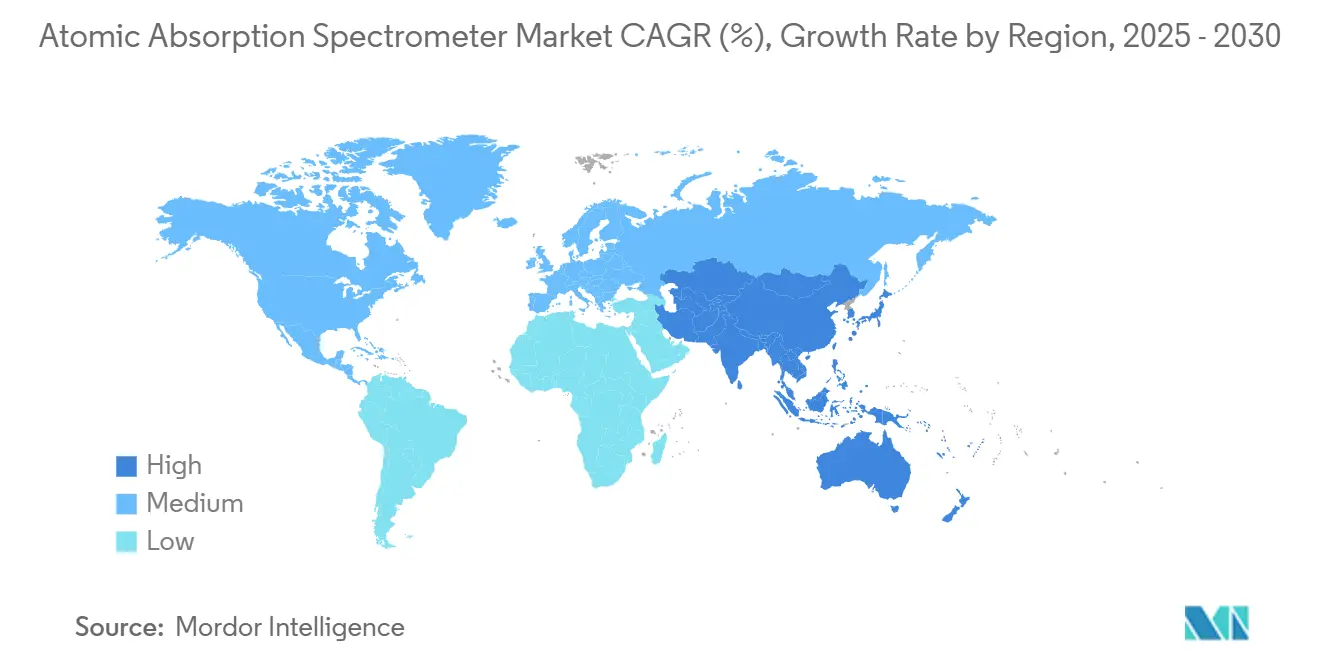
| Fastest Growing Market | Asia Pacific |
| Largest Market | North America |
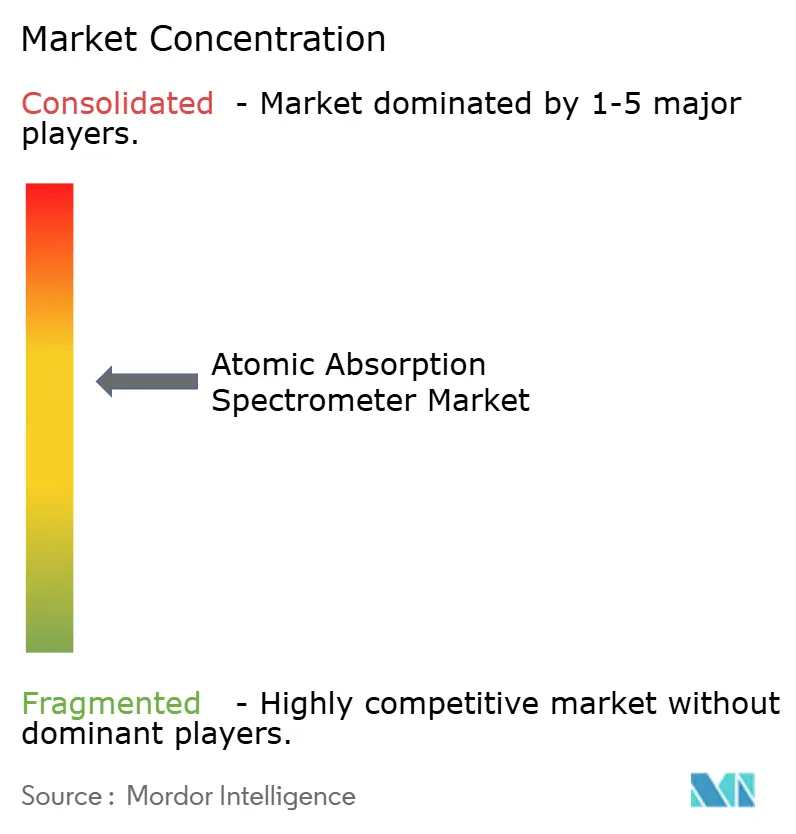
| Market Concentration | Medium |
Major Players *Disclaimer: Major Players sorted in no particular order Image © Mordor Intelligence. Reuse requires attribution under CC BY 4.0. | |
Atomic Absorption Spectrometer Market Analysis by Mordor Intelligence
The atomic absorption spectrometer market size stands at USD 1.39 billion in 2025 and is projected to reach USD 1.79 billion by 2030, expanding at a CAGR of 5.2%. A resilient demand base in high-throughput elemental laboratories, cost advantages over plasma techniques, and entrenched regulatory acceptance underpin this expansion. Flame systems remain the primary workhorse for parts-per-million determinations, while graphite furnace models capture a growing share in pharmaceutical and food testing labs that require parts-per-billion sensitivity. Robust capital budgets across North American compliance laboratories and rapid industrialization in the Asia-Pacific metallurgy sector sustain replacement and first-time purchases, despite price competition from ICP platforms. Automation-ready instruments equipped with intelligent diagnostics shorten run times and lower per-sample costs, thereby strengthening the technology’s relevance in a productivity-centric laboratory landscape. Contract research organizations (CROs) are emerging as fast adopters, leveraging bundled service contracts and leasing models to scale trace-metal capabilities without large upfront investments.
Key Report Takeaways
- By product type, flame systems held 60.9% of the atomic absorption spectrometer market share in 2024, while graphite furnace instruments are expected to advance at a 6.9% CAGR through 2030.
- By instrument configuration, double-beam platforms accounted for 46.1% of the atomic absorption spectrometer market size in 2024; dual-channel models are expected to exhibit the strongest growth at a 6.7% CAGR.
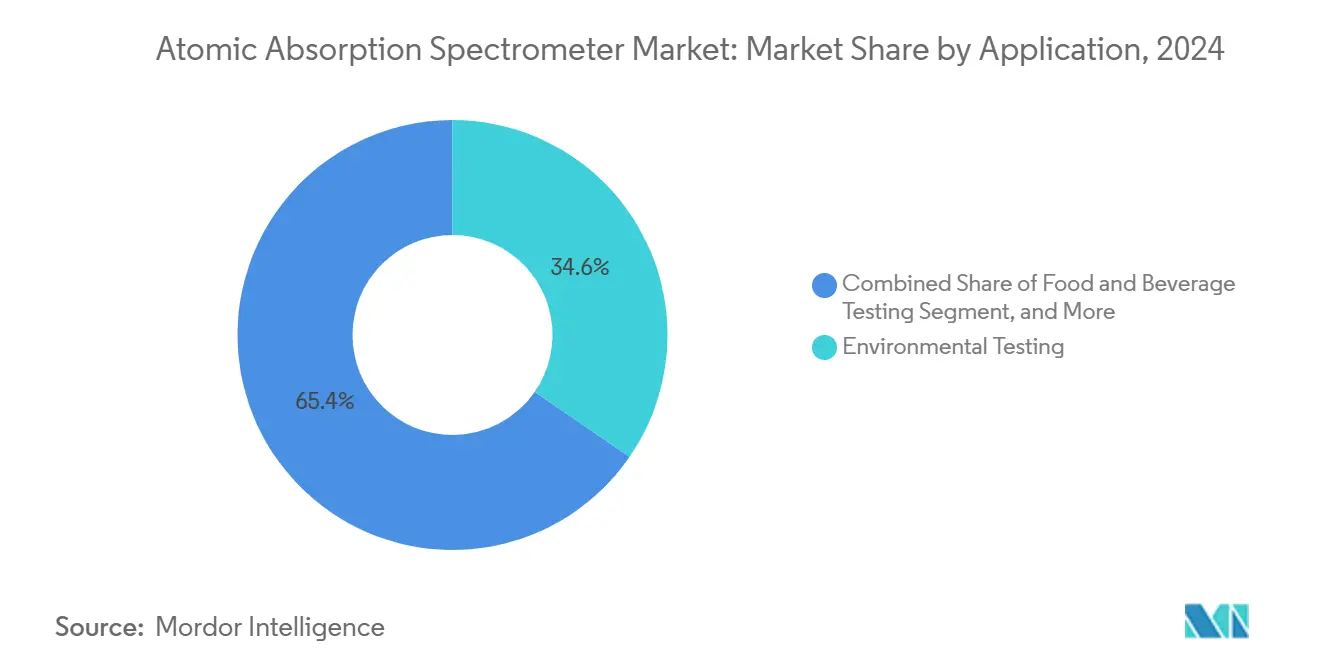
- By application, environmental testing contributed 34.6% to the atomic absorption spectrometer market size in 2024, and pharmaceutical analysis is forecasted to grow at a 6.5% CAGR through 2030.
- By end user, government and regulatory laboratories represented 52.7% of the atomic absorption spectrometer market share in 2024, while CROs record the highest projected CAGR at 6.4% through 2030.
- By geography, North America led the atomic absorption spectrometer market, accounting for 44.9% of the market size in 2024. The Asia-Pacific region is expected to expand at a 6.1% CAGR through 2030.
Note: Market size and forecast figures in this report are generated using Mordor Intelligence’s proprietary estimation framework, updated with the latest available data and insights as of January 2026.
Global Atomic Absorption Spectrometer Market Trends and Insights
Drivers Impact Analysis*
| Driver | (~) % Impact on CAGR Forecast | Geographic Relevance | Impact Timeline |
|---|---|---|---|
| Stricter heavy-metal limits in water and food | +1.2% | Global, stronger in North America and EU | Medium term (2-4 years) |
| Pharma ICH-Q3D elemental-impurity compliance push | +0.9% | Global, led by North America and EU | Long term (≥ 4 years) |
| Rapid APAC industrialization in metallurgy and mining | +0.8% | Asia-Pacific core, spill-over to MEA | Medium term (2-4 years) |
| Lab-automation and AI-driven AAS workflows | +0.6% | Global, early adoption in North America and EU | Short term (≤ 2 years) |
| Portable micro-AAS for on-site testing | +0.4% | Global, focus on emerging markets | Medium term (2-4 years) |
| North-American reshoring incentives | +0.3% | North America | Short term (≤ 2 years) |
| Source: Mordor Intelligence | |||
Stricter Global Limits on Heavy-Metal Contaminants in Water and Food
Regulators updated action levels for toxic metals in March 2025, consolidating 301 contaminant–commodity pairs that require sub-ppm detection capabilities.[1]U.S. Food and Drug Administration, “Q3D(R2) Guideline for Elemental Impurities,” fda.gov Laboratories now favor validated flame and furnace methods because they deliver compliant detection limits without the high argon consumption of plasma instruments. Automated sample changers and continuous-flow accessories support real-time reporting needs in water utilities, accelerating analysis cycles from hours to minutes. The expansion of contaminant-specific guidelines into Latin America and Southeast Asia broadens procurement pipelines as newly mandated labs select proven, regulator-accepted workflows. Instrument makers bundle starter kits with preset methods to simplify method transfer, shortening validation timelines and strengthening customer loyalty.
Pharma ICH-Q3D Elemental-Impurity Compliance Push
The ICH-Q3D(R2) guideline mandates trace-metal control across all dosage forms, driving capital spending on graphite furnace units that achieve parts-per-billion sensitivity.[2]United States Pharmacopeia, “Elemental Impurities—Procedures,” usp.org The May 2026 USP Chapter 233 effective date compels firms to lock in instrument capacity well in advance of audits, fueling the purchase of multi-system bundles with qualification services. Vendors offering complete documentation packages and on-site performance verification close sales faster than competitors that rely on third-party validation services. CROs capitalize on the surge by expanding metal-screening panels, attracting small and mid-sized drug firms that lack in-house capability. As a result, elemental impurity testing revenues outpace overall instrumentation sales, reinforcing the business case for specialized furnace accessories such as platform cuvettes and intelligent dilution systems.
Rapid Industrialization in APAC Metallurgy and Mining Sectors
Battery material processing in China, Australia, and Indonesia increases demand for routine trace-metal assays on concentrates, brines, and refinery effluents. Lithium demand alone grew 30% year over year, pushing centralized labs to add high-throughput flame systems with autosamplers to maintain 24/7 production coverage.[3]International Energy Agency, “Global Critical Minerals Outlook 2024,” iea.org Companies standardize on cost-effective atomic absorption workflows for daily process control, reserving ICP-OES for troubleshooting rare off-spec events. Regional governments support local content rules that include investments in laboratories, thereby accelerating the import of instruments into emerging hubs. Suppliers that provide Mandarin or Bahasa language interfaces and on-site training gain a competitive advantage, boosting service-contract revenues along with instrument sales.
Lab-Automation and AI-Driven AAS Workflows Slash Analysis Turn-Round Times
Intelligent Spectrometer Qualification (iSQ) in new S Series instruments performs pre-run diagnostics, reducing reruns and enhancing confidence metrics.[4]Thermo Fisher Scientific, “S Series AA Spectrometer Online Demonstration Capability,” thermofisher.com Paired with autosamplers, legacy labor-intensive workflows now match the sample-per-hour throughput of entry-level ICP platforms, narrowing the productivity gap. AI algorithms suggest optimal furnace temperature programs, reducing analyst intervention and minimizing matrix-based interferences. Predictive maintenance dashboards anticipate lamp-burn hours and graphite-tube wear, enabling batch scheduling around service windows. As unattended overnight operations gain acceptance, multisite labs redeploy staff to interpretation tasks, lowering the total cost per result and reinforcing the retention of atomic absorption technology.
Restraints Impact Analysis*
| Restraint | (~) % Impact on CAGR Forecast | Geographic Relevance | Impact Timeline |
|---|---|---|---|
| High capital and maintenance cost of advanced systems | -0.8% | Global, impacting emerging markets | Long term (≥ 4 years) |
| Substitution threat from ICP-MS and ICP-OES platforms | -1.1% | Global, stronger in developed markets | Medium term (2-4 years) |
| Volatile argon and acetylene gas prices | -0.4% | Global | Short term (≤ 2 years) |
| Tight supply of high-purity graphite tubes | -0.3% | Non-Chinese markets | Medium term (2-4 years) |
| Source: Mordor Intelligence | |||
High Capital and Maintenance Cost of Advanced Systems
Graphite furnace packages with full automation often exceed USD 100,000, stretching the budgets of small environmental labs. Annual service contracts and consumables can account for 20-25% of the purchase cost, creating procurement hurdles in price-sensitive regions. Finance-lease models mitigate sticker shock yet lengthen sales cycles when clients require board approval. Academic institutions are increasingly sharing instruments across departments, which lowers vendor unit-sale volumes even as overall utilization rises. Manufacturers respond with tiered service offerings, but the perception of high total cost of ownership still delays upgrades in emerging economies.
Substitution Threat from ICP-MS and ICP-OES Platforms
Entry-level ICP-OES packages, such as the enhanced iCAP 6200, target atomic absorption’s core client base by bundling low gas-consumption torches and simplified software. Multi-element capability and faster turnaround times entice high-volume labs to migrate, especially where sample matrices vary widely. Extended maintenance intervals on new ICP-MS models address historical uptime concerns, eroding one of atomic absorption’s last strongholds. To defend share, AAS vendors emphasize ruggedness for high-salt matrices and field-portable formats that plasma instruments cannot match. However, the analytical superiority of ICP technology continues to siphon prospects in pharmaceutical and advanced materials segments.
*Our forecasts treat driver/restraint impacts as directional, not additive. The impact forecasts reflect baseline growth, mix effects, and variable interactions.
Segment Analysis
By Product Type: Flame Systems Dominate Despite Furnace Innovation
Flame instruments generated 60.9% of the atomic absorption spectrometer market share in 2024, underscoring their role as the default choice for routine multi-matrix analysis. At USD 1.39 billion total, this translates to an atomic absorption spectrometer market size contribution of just over USD 0.85 billion. Their simple burner assemblies, modest gas flow, and robust sample throughput make them indispensable for water utilities, mining labs, and educational institutions. Vendors continue to refine combustion-head designs to reduce acetylene use and incorporate quick-change spray chambers that minimize cross-contamination during high-mix runs.
Graphite furnace systems, although accounting for a smaller revenue base, are expanding at a 6.9% CAGR through 2030 as method-detection limits tighten across the food and pharmaceutical verticals. Bundled auto-samplers and furnace-vision cameras simplify method development, making the technology accessible to mid-tier laboratories that were previously deterred by operational complexity. Hydride generation and cold-vapor accessories sustain niche demand for arsenic and mercury assays, especially in compliance labs bound to legacy protocols. Together, these trends indicate a balanced product landscape, where premium furnace sales boost average selling prices, even as flame units retain volume leadership.


By Instrument Configuration: Double-Beam Leadership Faces Dual-Channel Challenge
Double-beam architectures accounted for 46.1% of the atomic absorption spectrometer market size in 2024, corresponding to approximately USD 0.64 billion in revenue. Real-time reference correction assures long-term stability, a critical factor in regulatory audits. Suppliers have implemented ergonomic enhancements, such as automated lamp recognition and coded burners, to reduce setup time without disrupting lab-validated workflows.
Dual-channel platforms, though presently a sub-segment, are registering a 6.7% CAGR as labs seek higher throughput without adopting ICP. These systems house two lamps or two optical paths, enabling the sequential measurement of dissimilar elements in rapid succession and eliminating bottlenecks during multi-analyte runs. Single-beam units persist in teaching labs where budget constraints outweigh performance needs. Design improvements across all configurations focus on vibration-free optical mounts and sealed lamp compartments that preserve alignment during transport, making them particularly appealing to contract labs with multi-site deployments.
By Application: Environmental Testing Leads While Pharma Accelerates
Environmental laboratories captured 34.6% of 2024 revenue, translating to a USD 0.48 billion slice of the atomic absorption spectrometer market size. Stringent water-quality statutes across the United States and the European Union mandate quarterly heavy-metal surveys, cementing flame AAS as a fixture in compliance monitoring. Soil-remediation projects and industrial effluent permits further broaden the addressable sample pool.
Pharmaceutical elemental testing, although currently on a smaller base, is growing at a 6.5% CAGR under ICH-Q3D imperatives. CROs and drug-makers are expanding furnace capacity to screen raw materials, in-process bulk materials, and finished doses at sub-µg/g levels. Food and beverage laboratories maintain steady demand tied to cadmium and lead guidelines, while mining labs integrate AAS for daily ore-grade assessments and hydrometallurgical circuit control. Chemical-process companies weigh AAS against ICP primarily on ownership costs rather than detection-limit metrics, leading to mixed technology portfolios.
By End User: Government Labs Dominate as CROs Accelerate
Government and regulatory facilities accounted for 52.7% of 2024 shipments, equal to USD 0.73 billion worth of the atomic absorption spectrometer market share. Their preference for time-tested methods and audited SOPs locks in replacement cycles every eight to ten years. Instrument vendors earn enduring service revenue streams through calibration contracts and compliance-ready software modules.
Contract testing organizations exhibit a 6.4% CAGR as they aggregate demand from pharmaceuticals, food producers, and environmental agencies seeking cost-efficient outsourcing. The asset-light business model of CROs favors multipurpose graphite furnace systems with quick switchover kits. Academic and research institutions generate predictable baseline turnover driven by student lab curricula, whereas industrial QA/QC labs typically refresh equipment on a need-basis, often stretching instruments beyond their recommended lifecycle.
Geography Analysis
North America remained the largest regional contributor, accounting for 44.9% of 2024 revenue. The United States enforces comprehensive pharmaceutical and environmental standards that embed atomic absorption in official methods, ensuring stable procurement pipelines. Reshoring trends in life-science manufacturing are driving new capital expenditures on high-throughput graphite furnaces equipped with automated dilution blocks. Canada mirrors the U.S. regulatory environment and invests in modernizing provincial water-testing networks. Mexico’s maquiladora clusters adopt mid-tier flame systems for metals testing in export-oriented manufacturing sectors.
The Asia-Pacific region represents the fastest-growing territory, with a projected 6.1% CAGR through 2030. China dominates demand through its critical-mineral refinery expansion and centralized inspection labs that process thousands of samples per day. India’s pharmaceutical parks integrate furnace instruments to align with Q3D timelines, while Australia’s lithium salt producers deploy rugged flame models for brine monitoring. Southeast Asian governments are tightening their food-safety regimes, increasing the adoption of small laboratories that utilize portable units capable of operating in field hubs with limited utilities.
Europe sustains mature yet steady consumption anchored by stringent REACH chemical directives and updated drinking-water norms. Germany and the Nordics favor dual-channel systems to raise efficiency in consolidated testing centers. Southern European countries balance budget constraints with compliance needs, tilting purchases toward refurbished or entry-level models. South America, the Middle East, and Africa together make up an emerging opportunity pool, where infrastructure grants combine with donor-funded environmental programs to seed first-time installations. In these geographies, atomic absorption’s low argon requirement relative to plasma methods magnifies its competitive edge.

Competitive Landscape
The market exhibits moderate concentration, with three multinational suppliers, Thermo Fisher Scientific, Agilent Technologies, and PerkinElmer, commanding the majority of the share through broad product lines and global service reach. Their differentiation strategy centers on automation, regulatory-grade software, and bundled compliance services that shorten client onboarding. Agilent emphasizes ergonomic torch designs and plug-and-play autosamplers, whereas PerkinElmer bundles long-life graphite tubes to minimize downtime associated with consumables.
Tier-two companies such as Shimadzu, Analytik Jena, and GBC Scientific Equipment compete by tailoring configurations to regional norms and offering localized application libraries. They gain traction in fast-growing Asia-Pacific markets by integrating bilingual interfaces and onsite training packages. Emerging specialists target portable-field and micro-AAS niches, leveraging lightweight optical benches and battery operation to serve mining exploration and disaster-response teams.
Competition is increasingly centered on the total cost of ownership. Vendors extend warranty periods, reduce lamp power draw, and digitalize preventive maintenance to prove lifecycle savings. Service ecosystems, remote diagnostics, calibration audits, and cloud-based data archival now influence tender awards as much as raw instrument performance. Despite price pressure from entry-level ICP products, atomic absorption suppliers maintain share by emphasizing lower operating gas costs, smaller laboratory footprint, and unmatched robustness for high-salt matrices.
Atomic Absorption Spectrometer Industry Leaders
Thermo Fisher Scientific Inc.
Agilent Technologies, Inc.
PerkinElmer Inc.
Shimadzu Corporation
Hitachi High-Tech Corporation
- *Disclaimer: Major Players sorted in no particular order

Recent Industry Developments
- September 2025: Thermo Fisher Scientific launched the iCE 3300GF graphite furnace spectrometer with guaranteed deuterium background correction and integrated autosampler for unattended operation.
- September 2025: Thermo Fisher Scientific introduced online demonstration capability for S Series AA spectrometers featuring Intelligent Spectrometer Qualification (iSQ) diagnostics.
- March 2025: The FDA updated the Chemical Contaminants Transparency Tool, broadening metal-specific limits across 301 commodity pairs.
- February 2025: Sigma-Aldrich published guidelines for ultrapure water, aligned with USP standards, for elemental impurity testing.


Global Atomic Absorption Spectrometer Market Report Scope
| Flame Atomic Absorption Spectrometers |
| Graphite Furnace AAS |
| Hydride Generation / Cold-Vapor AAS |
| Single-Beam Systems |
| Double-Beam Systems |
| Dual-Channel / Duo Systems |
| Environmental Testing |
| Food and Beverage Testing |
| Pharmaceutical and Biotechnology |
| Metals and Mining |
| Chemical / Petrochemical |
| Government and Regulatory Laboratories |
| Contract Testing and CRO Laboratories |
| Academic and Research Institutes |
| Industrial QA/QC Laboratories |
| North America | United States |
| Canada | |
| Mexico | |
| South America | Brazil |
| Argentina | |
| Rest of South America | |
| Europe | Germany |
| United Kingdom | |
| France | |
| Italy | |
| Rest of Europe | |
| Asia-Pacific | China |
| Japan | |
| South Korea | |
| India | |
| Rest of Asia-Pacific | |
| Middle East | Saudi Arabia |
| United Arab Emirates | |
| Rest of Middle East | |
| Africa | South Africa |
| Rest of Africa |
| By Product Type | Flame Atomic Absorption Spectrometers | |
| Graphite Furnace AAS | ||
| Hydride Generation / Cold-Vapor AAS | ||
| By Instrument Configuration | Single-Beam Systems | |
| Double-Beam Systems | ||
| Dual-Channel / Duo Systems | ||
| By Application | Environmental Testing | |
| Food and Beverage Testing | ||
| Pharmaceutical and Biotechnology | ||
| Metals and Mining | ||
| Chemical / Petrochemical | ||
| By End User | Government and Regulatory Laboratories | |
| Contract Testing and CRO Laboratories | ||
| Academic and Research Institutes | ||
| Industrial QA/QC Laboratories | ||
| By Geography | North America | United States |
| Canada | ||
| Mexico | ||
| South America | Brazil | |
| Argentina | ||
| Rest of South America | ||
| Europe | Germany | |
| United Kingdom | ||
| France | ||
| Italy | ||
| Rest of Europe | ||
| Asia-Pacific | China | |
| Japan | ||
| South Korea | ||
| India | ||
| Rest of Asia-Pacific | ||
| Middle East | Saudi Arabia | |
| United Arab Emirates | ||
| Rest of Middle East | ||
| Africa | South Africa | |
| Rest of Africa | ||


Key Questions Answered in the Report
What is the projected value of the atomic absorption spectrometer market by 2030?
The market is forecast to reach USD 1.79 billion by 2030.
Which product type currently leads global revenues?
Flame atomic absorption systems account for 60.9% of 2024 revenue.
Why are CROs investing in additional furnace capacity?
CROs need parts-per-billion detection to meet ICH-Q3D requirements without incurring the higher running costs of ICP platforms.
Which region shows the fastest growth through 2030?
Asia-Pacific is expected to expand at a 6.1% CAGR, driven by critical-mineral processing and expanding pharmaceutical manufacturing.
How are automation features impacting adoption?
Intelligent diagnostics and autosamplers reduce reruns and enable overnight operation, lowering cost per result and sustaining demand for newer models.
What primary factor restrains adoption in emerging markets?
Upfront capital outlay and ongoing maintenance costs for automated furnace systems limit penetration among cost-sensitive laboratories.
Page last updated on:


