
Intravenous Therapy And Vein Access Market Size and Share
Market Overview
| Study Period | 2020 - 2031 |
|---|---|
| Market Size (2026) | USD 28.37 Billion |
| Market Size (2031) | USD 35.66 Billion |
| Growth Rate (2026 - 2031) | 4.69 % |
| Fastest Growing Market | Asia-Pacific |
| Largest Market | North America |
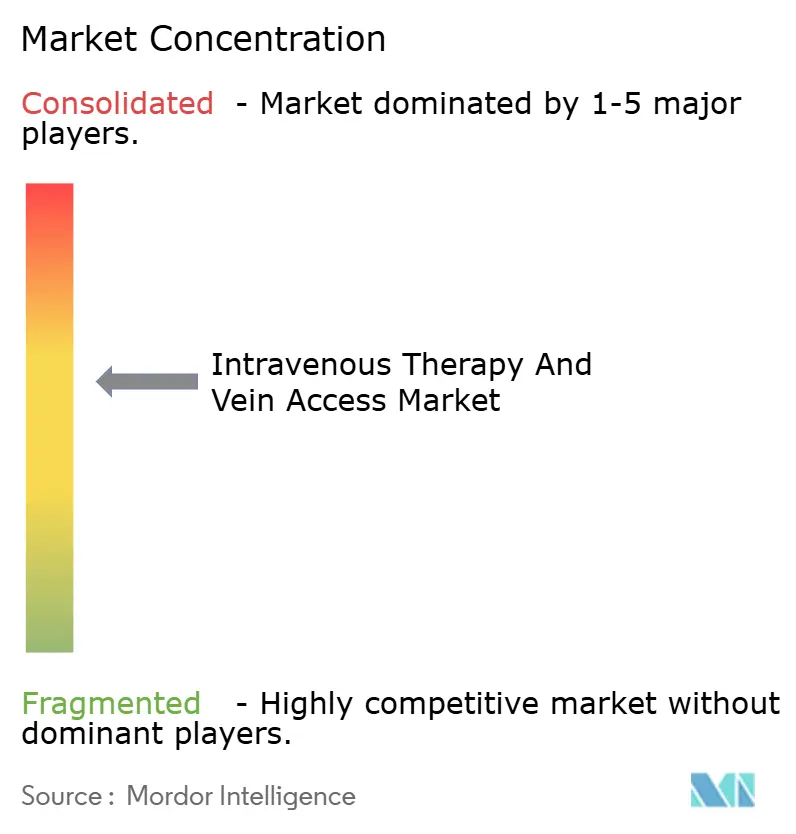
| Market Concentration | Medium |
Major Players *Disclaimer: Major Players sorted in no particular order Image © Mordor Intelligence. Reuse requires attribution under CC BY 4.0. | |
Intravenous Therapy And Vein Access Market Analysis by Mordor Intelligence
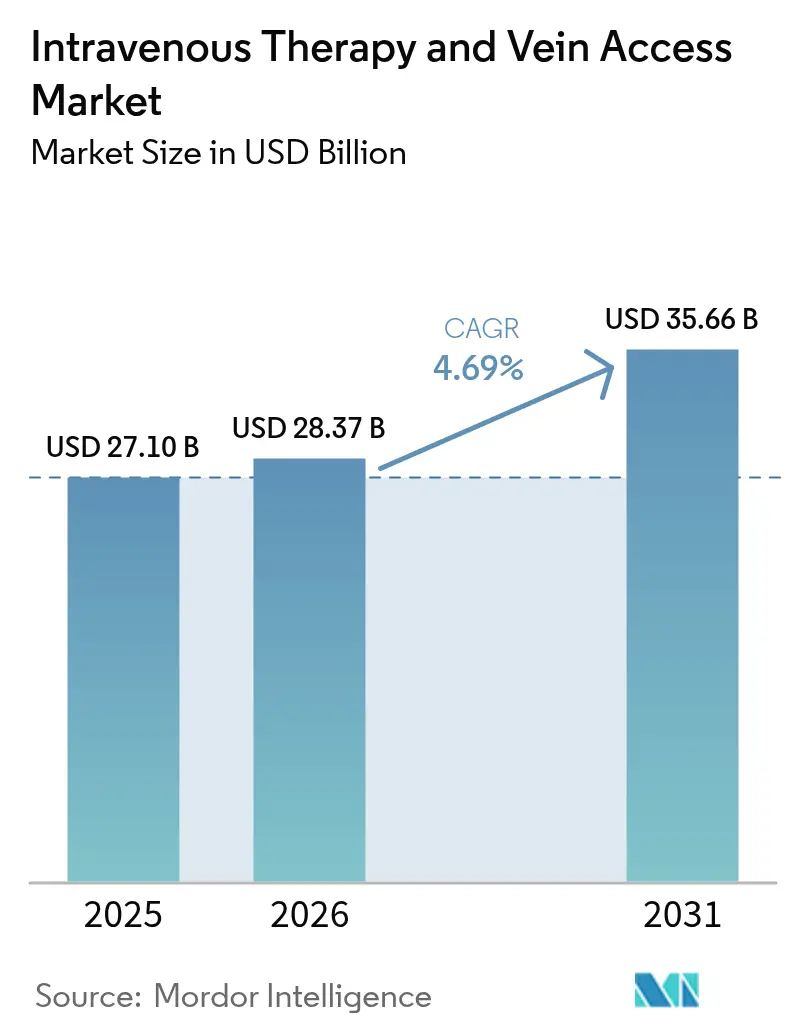
The intravenous therapy and vein access market size is expected to grow from USD 27.10 billion in 2025 to USD 28.37 billion in 2026 and is forecast to reach USD 35.66 billion by 2031 at 4.69% CAGR over 2026-2031. Demand is escalating as aging demographics increase chronic-disease prevalence, hospitals decentralize care, and digital technologies enable precise, connected infusion workflows[1]Source: Centers for Disease Control and Prevention, “Bloodstream Infection Event,” cdc.gov. Home-infusion programs now serve more than 3.2 million patients each year, illustrating the migration of complex treatments to patient homes. Closed IV systems, AI-guided catheter placement, and antimicrobial-coated devices are gaining momentum because they cut infection rates and reduce procedural failures. On the supply side, recent weather-related plant disruptions have exposed the fragility of medical-grade resin and fluid manufacturing in North America, prompting resilience investments and inventory buffer strategies.
Key Report Takeaways
- By product type, IV catheters led with 36.78% revenue in 2025, while infusion pumps are projected to expand at a 5.19% CAGR through 2031.
- By application, oncology captured 44.02% of the intravenous therapy and vein access market share in 2025; neurology treatments are expected to grow at a 5.49% CAGR to 2031.
- By end-user, hospitals and clinics held 62.51% of the intravenous therapy and vein access market size in 2025, whereas homecare settings are on course for a 5.78% CAGR up to 2031.
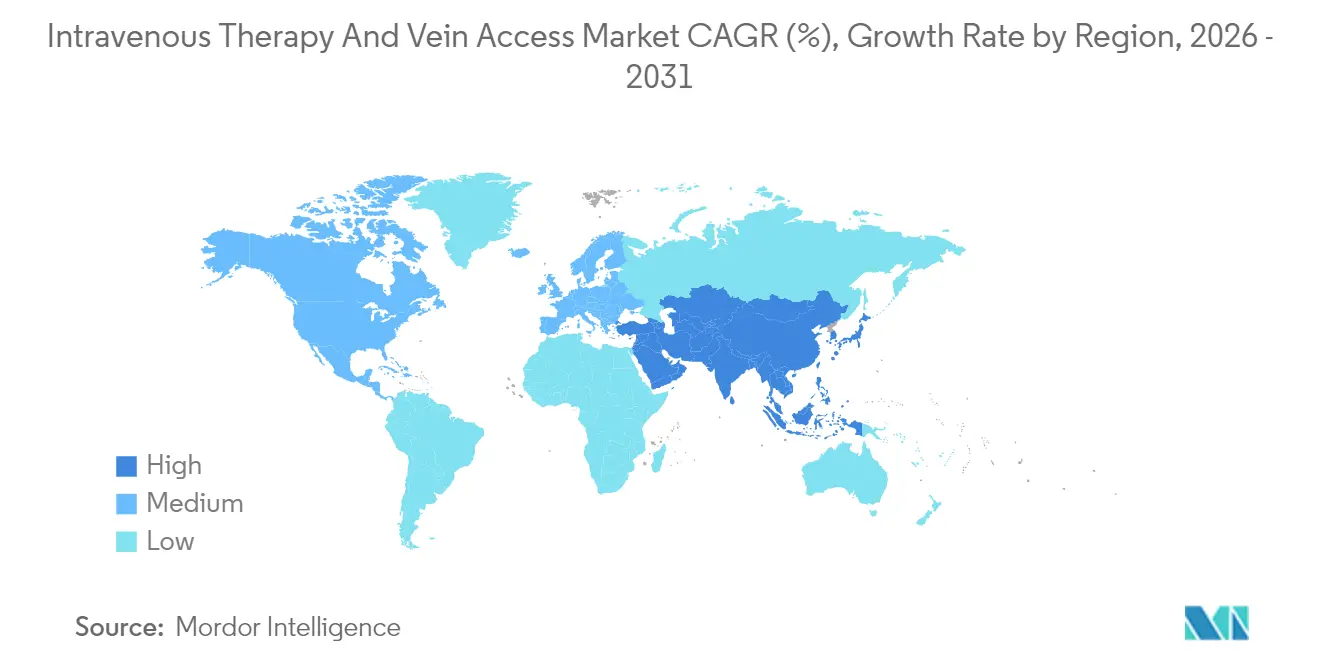
- By geography, North America commanded 40.66% share in 2025; Asia-Pacific is anticipated to log the fastest 6.12% CAGR over the forecast horizon.
Note: Market size and forecast figures in this report are generated using Mordor Intelligence’s proprietary estimation framework, updated with the latest available data and insights as of 2026.
Market Trends and Insights
Drivers Impact Analysis of Intravenous Therapy And Vein Access Market*
| Driver | (~) % Impact on CAGR Forecast | Geographic Relevance | Impact Timeline |
|---|---|---|---|
| Aging-population driven chronic disease burden | +1.2% | Global, with concentration in North America & Europe | Long term (≥ 4 years) |
| Shift toward home-infusion therapies | +0.8% | North America & EU leading, APAC emerging | Medium term (2-4 years) |
| Hospital infection-control mandates boosting closed IV systems | +0.6% | Global, with regulatory emphasis in developed markets | Short term (≤ 2 years) |
| AI-guided catheter placement systems reduce failure rates | +0.4% | North America & EU early adoption, APAC following | Medium term (2-4 years) |
| Rapid biosimilar & biologics pipeline requiring specialty infusion | +0.7% | Global, with North America & EU leading adoption | Long term (≥ 4 years) |
| Source: Mordor Intelligence | |||
Aging population increasing chronic-disease burden
Nearly 90% of hospitalized patients require intravenous access, and the proportion rises in geriatric wards where multi-drug regimens dominate care plans. Growing use of peptide and monoclonal-antibody therapies, many of which require controlled infusion rates, has spurred investment in smart pumps that can maintain flow within ±5 mL/hour across long sessions. Hospitals are expanding vascular-access teams to handle higher procedure volumes, and outpatient centers are adopting semi-autonomous placement tools to mitigate staffing shortages. As chronic care shifts outside acute facilities, manufacturers that pair devices with remote analytics and drug-library updates are gaining traction. Payers view continuous home infusion as a cost-saving alternative to repeat admissions, reinforcing long-term demand for networked pumps and secure cloud interfaces
Home-infusion adoption
The home-infusion segment is expanding at 7.5% annually, propelled by Medicare G-code reimbursements covering clinical services such as remote dosing oversight. Oncology and infectious-disease patients report improved quality of life and up to 30% lower total care costs when treatments move from the ward to the living room. Device design has followed suit; compact pumps with two-way EMR connectivity allow clinicians to adjust parameters without on-site visits, cutting nurse travel hours by 22% in large pilots. Pharmacy chains are developing integrated drug-dispensing and logistics services that synchronize deliveries with pump-usage data, further embedding the model
Infection-control mandates for closed IV systems
Central-line bloodstream infections drive roughly USD 1.8 billion in avoidable US hospital costs annually, prompting procurement shifts toward closed transfer devices certified to reduce touch-points during drug preparation. Antimicrobial-coated catheters coated with heparin-linked silver nanoparticles achieved 99% bactericidal performance in recent trials. Regulatory agencies now reference quantitative reduction targets - such as 60% lower microbial ingress compared with open systems - in device-approval dossiers. Hospitals with aggressive infection-control scorecards are bundling closed systems with electronic surveillance dashboards, a combination that cut infection episodes by 43% in a 12-month deployment across five tertiary centers. Vendors meeting these metrics secure multi-year group-purchasing contracts that shield margins even in commoditized tubing categories
AI-guided catheter placement
Deep-learning imaging modules embedded in vascular robots now exceed 90% first-attempt success in peripheral insertions compared with 78% for manual attempts during difficult-access cases. Shorter procedure times free up nursing capacity; a 20-bed trial logged 12 minutes saved per insertion, translating to annual labor savings near USD 0.4 million at scale. Radiation exposure fell by 28% because the robot avoids fluoroscopy during vein localization. Algorithms refine pathways as datasets grow, suggesting a continuous learning curve that could make manual placement the exception rather than the norm in high-acuity centers by 2030. Insurers are beginning to reimburse AI-guided access fees when documented to prevent repeat sticks that cost USD 1,100 per failed episode
Restraints Impact Analysis of Intravenous Therapy And Vein Access Market*
| Restraint | (~) % Impact on CAGR Forecast | Geographic Relevance | Impact Timeline |
|---|---|---|---|
| Rising antimicrobial-resistant infections at access sites | -0.5% | Global, with higher impact in hospital-dense regions | Short term (≤ 2 years) |
| Supply-chain constraints for medical-grade plastics & resins | -0.7% | Global, with acute impact in North America & EU | Medium term (2-4 years) |
| Increasing payor scrutiny on inpatient infusion reimbursement | -0.4% | North America & EU, with Medicare/insurance focus | Medium term (2-4 years) |
| Source: Mordor Intelligence | |||
Antimicrobial-resistant infections at access sites
Biofilm-forming organisms such as methicillin-resistant Staphylococcus aureus now colonize 18% of central lines beyond 10 days of dwell time despite line-change protocols. Resistant outbreaks can double antimicrobial costs per episode, prompting some facilities to delay elective infusions, which suppresses near-term device volumes. Researchers are experimenting with photodynamic coatings and lock solutions containing ethanol and minocycline, but regulatory pathways remain protracted, slowing widespread adoption. Hospitals under budget strain may prioritize essential disposables over premium antimicrobial lines, constraining revenue for advanced products until stewardship programs mature.
Supply-chain constraints for medical-grade plastics & resins
Hurricane Helene temporarily shuttered a Baxter plant supplying 60% of US IV fluids, prompting rationing notices from federal agencies and extending shortages into 2025. Specialized resins used in pressure-rated bags derive from limited global polymer producers; any line shutdown cascades through inventories within weeks. Freight-rate spikes and port congestion added USD 0.06 per unit to standard saline bags in 2024, straining margins in commoditized segments. The FDA now requires contingency plans for critical device categories, pressuring mid-tier suppliers to invest in redundant tooling, which may delay new-product budgets.
*Our forecasts treat driver/restraint impacts as directional, not additive. The impact forecasts reflect baseline growth, mix effects, and variable interactions.
Intravenous Therapy And Vein Access Market Segment Analysis
By Product Type:
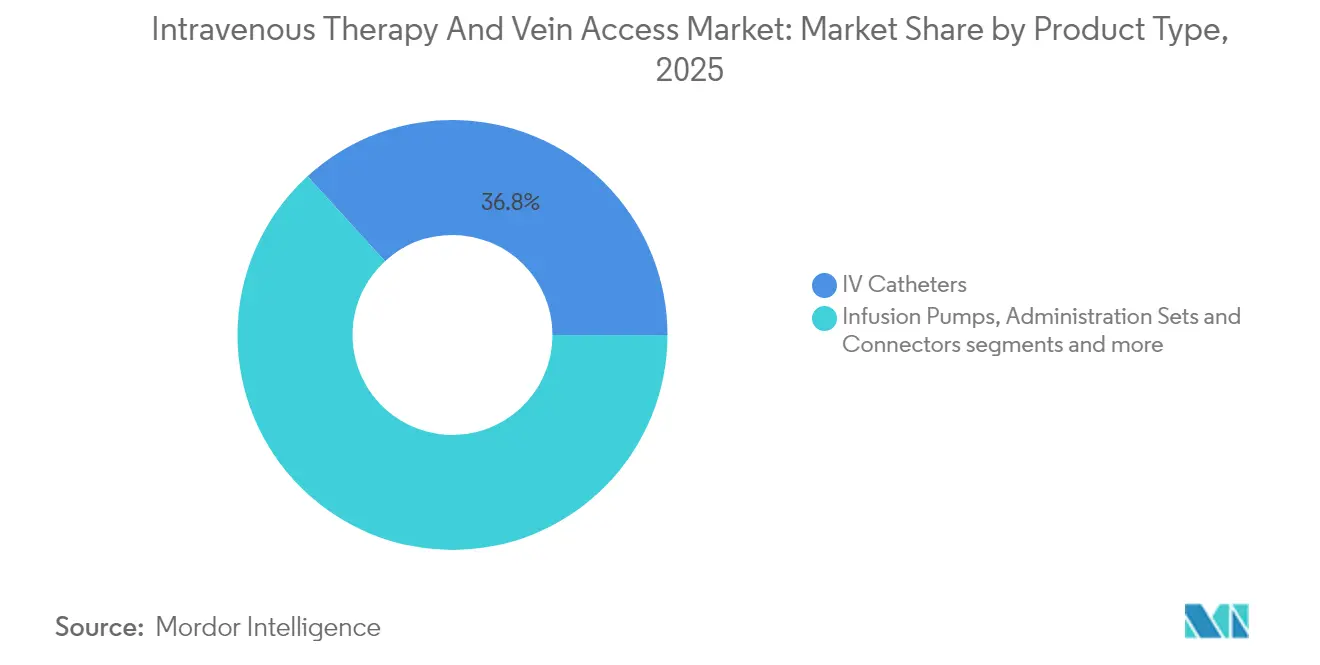
Smart Infusion Systems Drive Premium GrowthThe catheter segment retained a 36.78% revenue lead in 2025, reflecting high replacement cadence across inpatient and outpatient settings. Infusion pumps, though smaller in volume, are projected to post a 5.19% CAGR, the fastest within the intravenous therapy and vein access market, as hospitals deploy connected platforms to mitigate medication errors and integrate dosage analytics.
Consumables such as administration sets and connectors retain steady demand because closed-loop designs align with infection-control targets, while IV fluids navigate periodic price spikes tied to resin shortages. Needles, syringes, and accessories continue to grow in line with procedure volumes; however, margins compress as group-purchasing organizations bundle them with pump contracts, forcing suppliers to differentiate through safety-engineered designs.



By Application:
Oncology Dominance Meets Neurology InnovationOncology remained the largest application, commanding 44.02% of the intravenous therapy and vein access market in 2025, as multi-cycle chemotherapy, supportive hydration, and immunotherapy require precise dosing windows. Neurology demonstrates the highest 5.49% CAGR due to emerging peptide infusions targeting Alzheimer’s and Parkinson’s pathology, propelling the intravenous therapy and vein access market size for neuro-degenerative care.
Infectious-disease protocols continue to depend on long-course antibiotics; however, outpatient parenteral antimicrobial therapy (OPAT) programs are shifting much of this load to homecare, altering volume flows toward ambulatory supplies. Gastroenterology, including total parenteral nutrition, serves a smaller but stable cohort of post-surgical and malabsorption patients, whereas other applications such as cardiovascular emergency infusions add incremental but variable demand.
By End-User:
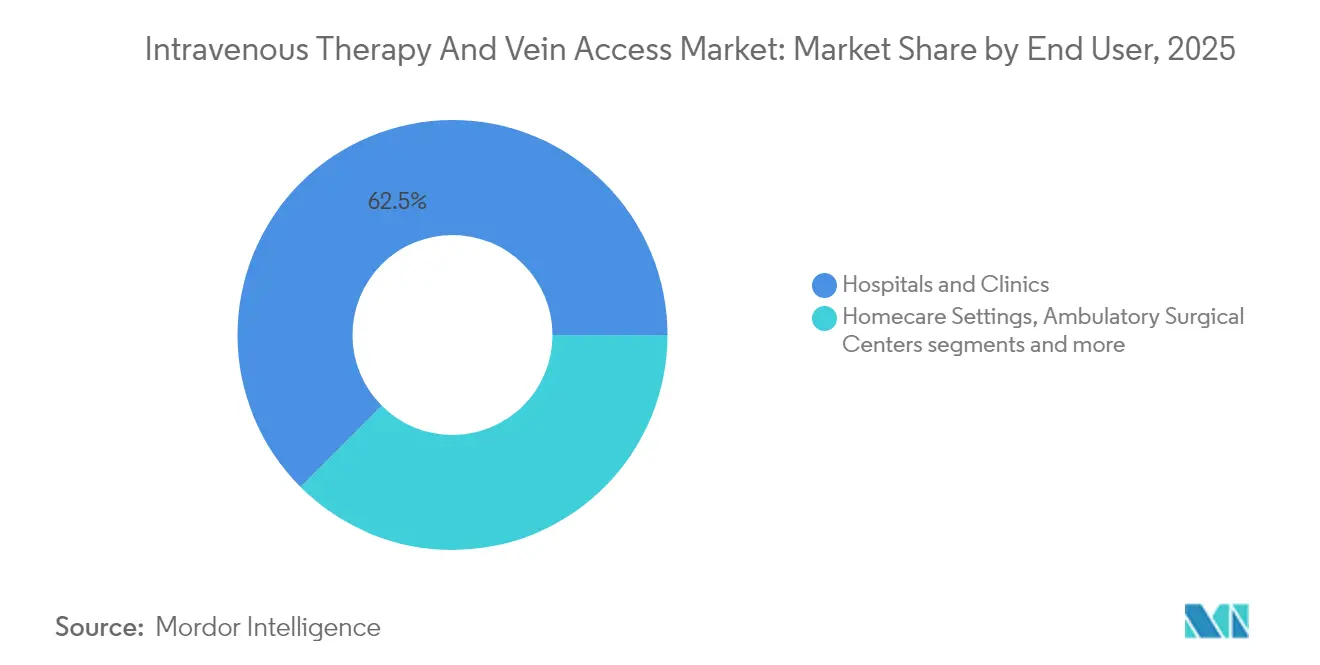
Homecare Transformation Challenges Hospital DominanceHospitals and clinics accounted for 62.51% of intravenous therapy and vein access market revenue in 2025, driven by high-acuity cases, on-site pharmacies, and bundled reimbursement structures. Yet the homecare channel is expanding at a 5.78% CAGR, outpacing all other settings within the intravenous therapy and vein access market and signaling a redistribution of procedure volumes.
Ambulatory surgical centers (ASCs) benefit from same-day surgery growth, funneling post-operative hydration and analgesic infusions through compact pump systems designed for 24-hour rental models. Long-term care facilities, while smaller in absolute spend, show rising penetration of anti-infective regimens for pressure ulcer management and intravenous diuretic administration for advanced heart failure, reflecting demographic realities in developed markets.
Geography Analysis
North America Intravenous Therapy and Vein Access Market
North America retained a 40.66% share of the intravenous therapy and vein access market in 2025, underpinned by mature reimbursement channels, high device ASPs, and early uptake of smart pump interoperability standards. The FDA's expedited pathways for infusion-pump software updates shorten product cycles and incentivize continuous innovation; however, natural-disaster-driven plant outages underscored critical supply-chain fragility, leading to strategic multi-sourcing among group-purchasing organizations. Cross-border trade with Canada and Mexico supplies tubing sets and fluids, providing some buffer against localized disruptions.
APAC Intravenous Therapy and Vein Access Market
Asia-Pacific recorded the fastest 6.12% CAGR and is forecast to expand its revenue share by 315 basis points by 2031 on the back of hospital-capacity builds in China and India and accelerated device approvals in Japan and South Korea. Domestic pump manufacturers in China are entering price-sensitive tiers, but premium US and European brands retain leadership in oncology centers where EMR integration is mandatory. Australia's nationwide electronic medication management initiative is drawing vendors that can provide HL7-compliant transmission modules, foreshadowing connectivity requirements across the region.
Europe Intravenous Therapy and Vein Access Market
Europe shows balanced growth as aging populations push chronic-care volumes higher and the EU Medical Device Regulation (MDR) creates a uniform compliance framework that rewards quality systems. Germany and France continue to dominate spending, but Eastern European countries are modernizing oncology infusion suites through cohesion-fund financing. In Western Europe, the intravenous therapy and vein access market size is driven by biosimilar uptake and national cancer plan outlays.

Regulatory Landscape
In the United States, intravenous therapy and vein access devices span multiple device types and classifications, with FDA oversight focused on non-clinical performance and safety controls for catheters and related accessories. In August 2024, the FDA finalized the classification for intravenous catheter force-activated separation devices as Class II (21 CFR 880.5220), with special controls including separation force testing and microbial ingress testing, which tightens design verification requirements for closed and safety-enhancing configurations.
In Europe, the EU Medical Device Regulation (Regulation (EU) 2017/745, MDR) remains the central compliance framework, and the 2026 consolidated version is now in force with a tighter documentation environment for clinical evaluation and post-market surveillance. In March 2026, the European Commission issued Delegated Regulation (EU) 2026/1451 to update exemptions related to mandatory clinical investigations for certain implantable and Class III devices, while keeping MDR clinical evaluation obligations under Article 61. Across tenders and hospital procurement, updated ISO standards for infusion and transfusion safety, including ISO/TR 8417:2024 on particulate risk management and ISO 80369-1:2025 on small-bore connector requirements, reinforce interoperability and contamination-control expectations for manufacturers.
Value Chain Analysis
The value chain starts with upstream inputs such as medical-grade plastics and resins, silicone components, stainless steel (needles), and the electronics and sensors used in smart pumps, along with sterile packaging materials. These inputs flow into device and consumables manufacturers, including IV catheters, administration sets and connectors, infusion pumps, and IV fluids and solutions, which run validated molding, extrusion, assembly, and sterilization workflows. Sterilization capacity, particularly ethylene oxide, is a structural bottleneck when facility availability tightens, which can create qualification backlogs and delay market supply even if component inventories are sufficient.
Downstream, distribution moves through direct sales, group purchasing organizations, and medical distributors into hospitals and clinics, the largest end-user base, along with a growing homecare channel that depends on synchronized logistics for devices, disposables, and drug delivery. Supply resilience has become a more explicit operating model after shortage-linked disruptions, with manufacturers increasing geographic redundancy and partner capacity. ICU Medical and Otsuka Pharmaceutical Factory completed the formation of Otsuka ICU Medical LLC in May 2025, combining North American manufacturing with a broader production footprint to support continuity of IV solutions supply. Regulators also shape continuity planning, with FDA shortage-focused expectations and notification constructs, including 506J-style disruption reporting, influencing how manufacturers, contract manufacturers, and distributors build inventory buffers and arrange alternate sourcing.
Competitive Landscape
Competition remains moderate, with the top five manufacturers controlling half of premium hardware revenue and leveraging service contracts to deepen customer lock-in . BD’s USD 4.2 billion acquisition of Edwards Lifesciences’ Critical Care line extended its footprint into advanced monitoring, enabling bundled deals that pair pumps with analytics dashboards[2]Source: Becton, Dickinson and Company, “BD to Acquire Edwards Lifesciences Critical Care Product Group,” news.bd.com. Baxter’s Novum IQ platform differentiates through bi-directional EMR connectivity and customizable drug libraries, helping the company secure sole-source contracts with large IDNs.
Regulatory compliance shapes rivalry; FDA warning letters issued to ICU Medical and Fresenius Kabi over quality-system lapses illustrate the high cost of non-conformance, occasionally driving customers to switch suppliers mid-contract. Meanwhile, B. Braun’s DUPLEX ready-to-use drug system, which reduced medication errors by 54% in multicenter trials, signals a design trend toward combination devices that embed pharmaceuticals with hardware. Terumo’s Rika apheresis platform demonstrates how adjacent therapy modalities can cross-pollinate infusion-device engineering, broadening competitive parameters.
Strategic capacity expansions underscore a race for supply reliability. BD committed USD 2.5 billion to US manufacturing upgrades through 2030, aiming to onshore critical tubing and catheter production. Teleflex is re-engineering vascular-access components for 30% faster assembly, targeting cost leadership while preserving compatibility with hospital EHR ecosystems. As AI-enabled placement systems mature, hardware–software convergence is likely to concentrate market power among firms capable of underwriting cloud-infrastructure investments.
Intravenous Therapy And Vein Access Industry Leaders
Becton, Dickinson and Company
Terumo Medical Corporation
Vygon SAS
Teleflex Incorporated
Fresenius Kabi
- *Disclaimer: Major Players sorted in no particular order
Intravenous Therapy And Vein Access Market Companies Covered in this Report
- Beckton Dickinson
- B. Braun
- Baxter
- Fresenius
- ICU Medical
- Terumo
- Smiths Group
- Teleflex
- AngioDynamics
- Vygon
- Nipro
- Poly Medicure Ltd.
- Cook Group
- Cardinal Health
- CODAN Medizinische Geräte GmbH
- Grifols
- Mindray
- Q-Core Medical
- Becton Dickinson – C.R. Bard Access Systems
- Vascular Solutions LLC
- Hamilton Medical
Read Analysis of Intravenous Therapy And Vein Access Companies

Market Opportunities and Future Outlook
Opportunities are concentrating on technologies that simplify insertion, reduce contamination touchpoints, and improve first-attempt success in difficult access cases, which aligns with infection-control mandates and ongoing workforce constraints. In April 2026, BD commercially launched the BD CentroVena One Insertion System in the United States and positioned it within the FDA Safer Technologies Program (STeP), pointing to ongoing demand for consolidated, procedure-standardizing platforms for central-line placement. Adoption pathways also benefit from provider-system purchasing mechanisms, including BD securing a Vizient Innovative Technology contract for CentroVena One in June 2026.
Long-term access and vessel-preservation programs are also carving out whitespace in extended-dwell catheters and implantable ports, supported by evolving clinical practice guidance and regulatory clearances. In January 2026, the Association for Vascular Access (AVA) published adult clinical practice guidelines, and the Association of Anaesthetists' 2025 guidance emphasized safer vascular access practices such as ultrasound-guided insertion and vessel health preservation, which supports stronger uptake of vein visualization, training, and standardized protocols. On the product and geography front, Vygon expanded its extended-dwell catheter position through its February 2026 acquisition of Stiletto technology and received Health Canada approval to commercialize Stiletto extended-dwell catheters in June 2026, reinforcing the commercial runway for differentiated insertion approaches beyond traditional Seldinger workflows.
Recent Industry Developments in Intravenous Therapy And Vein Access Market
- June 2026: BD was awarded a Vizient Innovative Technology contract for the BD CentroVena One Insertion System. The contract status increases visibility across a major provider-led purchasing channel and supports standardized evaluation of a new central line insertion workflow in US health systems.
- February 2026: Vygon acquired the Stiletto extended-dwell catheter technology from Avia Vascular. The deal expands Vygon's vascular access portfolio in a segment used to bridge peripheral and central access needs, strengthening its ability to offer differentiated insertion systems alongside catheter products.
- April 2024: Baxter received FDA clearance for the Novum IQ large-volume infusion pump and Dose IQ Safety Software. The clearance reinforced the shift toward interoperability and software-enabled medication safety features, supporting competitive differentiation through connected infusion platforms.


Intravenous Therapy And Vein Access Market Report Scope and Research Methodology
Market Definition and Coverage
This market covers the value of products used to deliver fluids and drugs through intravenous therapy and to gain and maintain vein access, across care settings where infusion is performed.
Scope exclusions: We exclude non-intravenous drug revenue, clinical service fees, and broad hospital consumables that are not directly used for infusion delivery or vascular access.
Segments Covered in This Report
- By Product Type
- Intravenous Catheters
- Infusion Pumps
- Administration Sets & Connectors
- IV Fluids & Solutions
- Needles & Syringes
- Accessories (Caps, Dressings, Securement)
- By Application
- Oncology
- Infectious Diseases
- Gastroenterology & Parenteral Nutrition
- Neurology
- Other Applications
- By End-User
- Hospitals & Clinics
- Homecare Settings
- Ambulatory Surgical Centers
- Long-term Care Facilities
- By Geography
- North America
- United States
- Canada
- Mexico
- Europe
- Germany
- United Kingdom
- France
- Italy
- Spain
- Rest of Europe
- Asia-Pacific
- China
- India
- Japan
- South Korea
- Australia
- Rest of Asia-Pacific
- South America
- Brazil
- Argentina
- Rest of South America
- Middle East and Africa
- GCC
- South Africa
- Rest of Middle East and Africa
- North America
Data Sources, Market Sizing, and Validation
Desk Research
Desk work starts by pinning down the demand pool for IV therapy and access products, then mapping where usage happens across hospitals, clinics, and other care sites. We used public sources such as the US CDC, the US FDA device databases, the WHO, and OECD health statistics to understand procedure volumes, safety signals, and care delivery trends that influence infusion use.
To keep assumptions grounded, we also reviewed sources such as customs and trade statistics (import and export series), peer-reviewed clinical journals on infusion practices and catheter use, and hospital and payer publications that discuss therapy patterns and site-of-care shifts. Company filings and investor presentations were used to sanity-check product mix direction and regional exposure. A paid subscription focused on company financials and a patent database supported tracking of innovation cadence. These source examples are not exhaustive, and many other public documents and datasets were also used to validate data points and clarify open questions.
Primary Interviews and Surveys
Primary work was used to pressure-test what the desk findings implied about real-world utilization and pricing, especially for infusion pumps, IV sets, implantable ports, and central venous catheters. We spoke with a mix of manufacturers, distributors, hospital pharmacy and materials teams, and clinicians who place or manage vascular access. Respondent inputs were balanced across major regions so assumptions do not tilt toward a single healthcare system.
Distribution of primary research fieldwork respondents
| Company type | Respondent position | Region |
|---|---|---|
| Top tier: 30% | CXOs: 12% | APAC: 46% |
| Mid tier: 54% | Functional/Unit leaders: 30% | EMEA: 34% |
| Smaller Players: 16% | Managers: 58% | Americas: 20% |
Market-Sizing & Forecasting
The core build uses top-down and bottom-up logic, where healthcare activity indicators are converted into product demand and then translated into value using average selling prices. Top-down, procedure and therapy intensity signals help reconstruct the likely pool of infusion events and access placements, which are then filtered through typical device and consumable use per event.
To corroborate totals, we also ran selective bottom-up checks using supplier and channel signals, including sampled ASP x volume for key product groups and a reasonableness review against company revenue exposure where it was visible. Inputs that mattered most included infusion pump placement and replacement cycles, catheter utilization patterns by setting of care, protocol-driven changes in safety and infection control, product mix shifts between basic and advanced access, and regional hospital purchasing behavior that impacts pricing. Where bottom-up visibility was incomplete, gaps were handled using conservative penetration ranges that were later narrowed through interviews.
For forecasting, scenario analysis was applied around a central outlook so the model stays realistic when reimbursement, staffing, or tender timing shifts demand. Growth rates were adjusted by region based on expert views about care migration, chronic disease load, and infusion practice changes. The final curve was cross-checked for smoothness rather than abrupt year-to-year jumps.
Data Validation & Update Cycle
Validation is done through repeated cross-checks, where the model output is compared against independent signals like procedure direction, trade movement for relevant device categories, and publicly discussed pricing changes. Outliers are investigated and reconciled by revisiting assumptions, and when a variance cannot be logically explained, additional calls are triggered with respondents closest to pricing and usage.
Before sign-off, the work is reviewed in steps by another analyst who checks units, conversions, and the link between each assumption and its supporting evidence. Reports refresh annually, with interim updates when large regulatory actions, reimbursement shifts, or major supply disruptions are observed. Right before delivery, we run a final pass so clients receive the most current view available at that time.
Mordor Intelligence's Intravenous Therapy and Vein Access Market Sizing Compared With Other Published Estimates
Published market values can spread out because the scope line is drawn differently, and because pricing is treated differently across inflation, discounting, and regional mix. Timing matters too, since some estimates anchor to an older base year and do not recheck assumptions after material events.
In this market, gaps usually come from whether infusion pumps are counted as full device value or only incremental accessories, how central venous catheters and implantable ports are grouped, and whether hospital pharmacy and retail pharmacy channels are treated as distribution only or as extra value layers. Differences also show up in currency conversion timing and how average selling prices are rolled forward, particularly when tenders and contract renewals change realized pricing within a year.
Benchmark comparison
| Source | Market Size | Gaps in Research Methodology |
|---|---|---|
| Mordor Intelligence | USD 28.37 B (2026) | |
| Global Consultancy A | USD 25.90 B (2026) | Uses a narrower scope that emphasizes disposable IV sets and excludes most infusion pump device value, and it applies a flat ASP uplift that does not reflect tender-led price resets. |
| Industry Association B | USD 31.40 B (2026) | Blends adjacent vascular access and infusion-related supplies into one total, and it often relies on reported list pricing rather than validated realized pricing across hospital contracts. |
The spread across the table largely follows how pricing is refreshed and how adjacent product buckets are counted, and a model stays more repeatable when it ties ASP moves to contract cycles and validates them with channel feedback, which is the refresh-led approach used for this estimate by Mordor Intelligence.


Key Questions Answered in the Report
What is the current value of the intravenous therapy and vein access market?
The intravenous therapy and vein access market was valued at USD 28.37 billion in 2026 and is forecast to reach USD 35.66 billion by 2031.
Which product type is growing fastest?
Infusion pumps exhibit the highest growth, with a projected 5.19% CAGR through 2031 as hospitals prioritize connected, error-reducing technologies.
Why is home infusion gaining traction?
Home infusion lowers total care costs by up to 30%, improves patient comfort, and is reimbursed under new Medicare G-codes, driving a 5.78% CAGR in the segment.
How are AI technologies influencing IV therapy?
AI-guided catheter placement systems achieve over 90% first-attempt success and reduce procedure times, enhancing patient outcomes and freeing nursing resources.
Page last updated on:


 Your data is secure and never sold or shared.


