Passenger Ferries Market Size and Share
Market Overview
| Study Period | 2020 - 2031 |
|---|---|
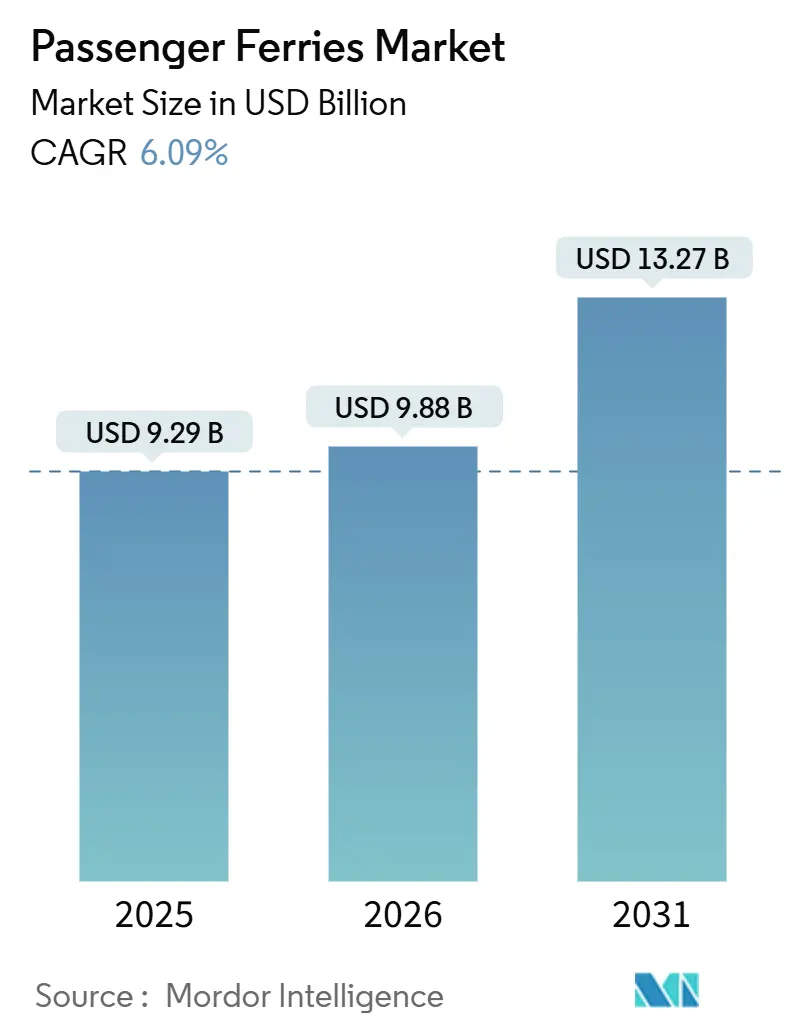
| Market Size (2026) | USD 9.88 Billion |
| Market Size (2031) | USD 13.27 Billion |
| Growth Rate (2026 - 2031) | 6.09% CAGR |
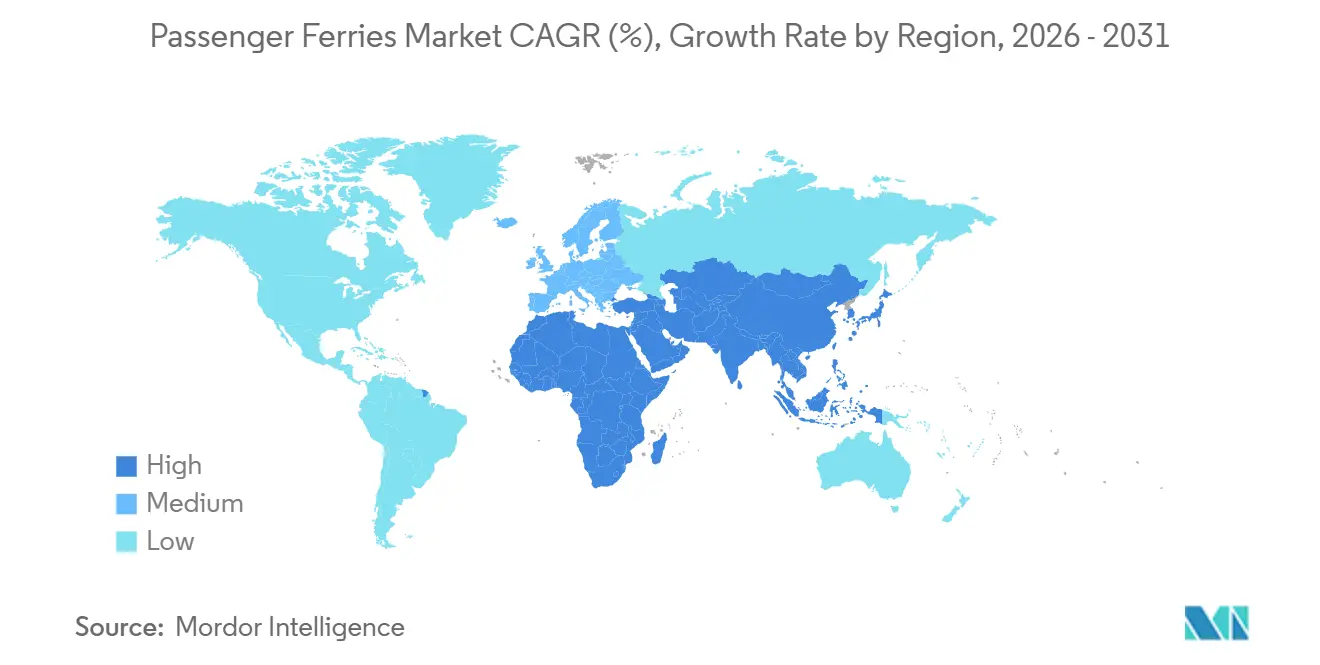
| Fastest Growing Market | Asia Pacific |
| Largest Market | Europe |
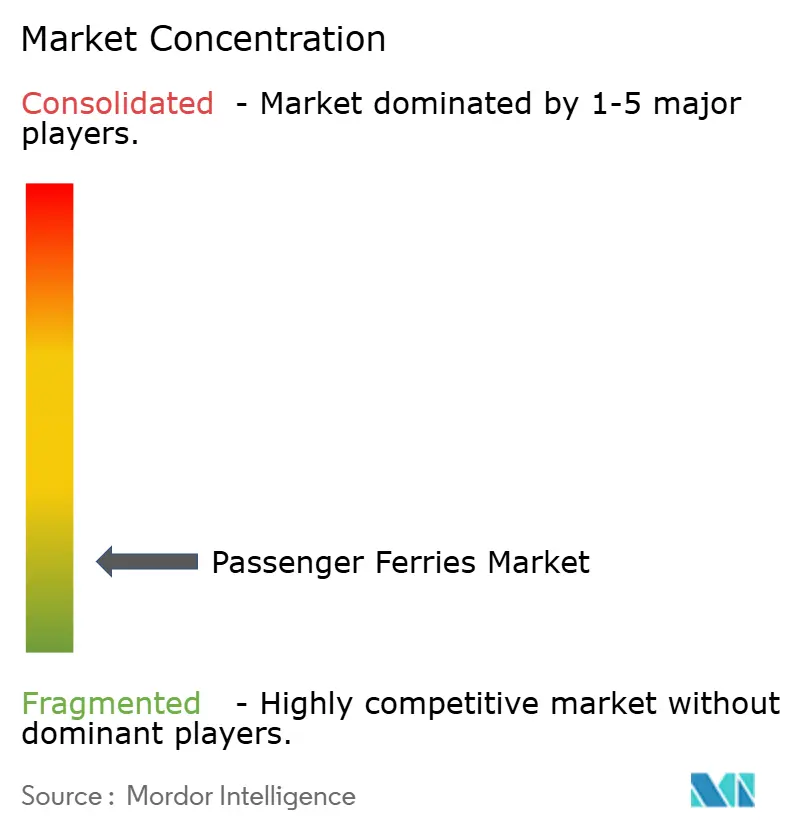
| Market Concentration | Medium |
Major Players *Disclaimer: Major Players sorted in no particular order Image © Mordor Intelligence. Reuse requires attribution under CC BY 4.0. | |
Passenger Ferries Market Analysis by Mordor Intelligence
The passenger ferries market size is projected to expand from USD 9.29 billion in 2025 and USD 9.88 billion in 2026 to USD 13.27 billion by 2031, registering a 6.09% CAGR between 2026 and 2031.
Stringent International Maritime Organization (IMO) Carbon Intensity Indicator (CII) rules, the surge in government-backed island-connectivity programs, and mounting demand for dual-purpose vessels that serve both public transport and offshore-wind construction are reshaping the passenger ferries market. Operators with deep capital reserves are accelerating fleet renewal to secure favorable CII ratings, while smaller players explore battery-as-a-service (BaaS) leases to avoid balance-sheet strain. Automated docking, remote-operation technology, and modular floating terminals are improving route economics at congested urban ports. At the same time, potential supply bottlenecks for e-methanol and green hydrogen introduce investment risk, and rising insurance premiums tied to lithium-battery fire concerns temper the speed of electrification.
Key Report Takeaways
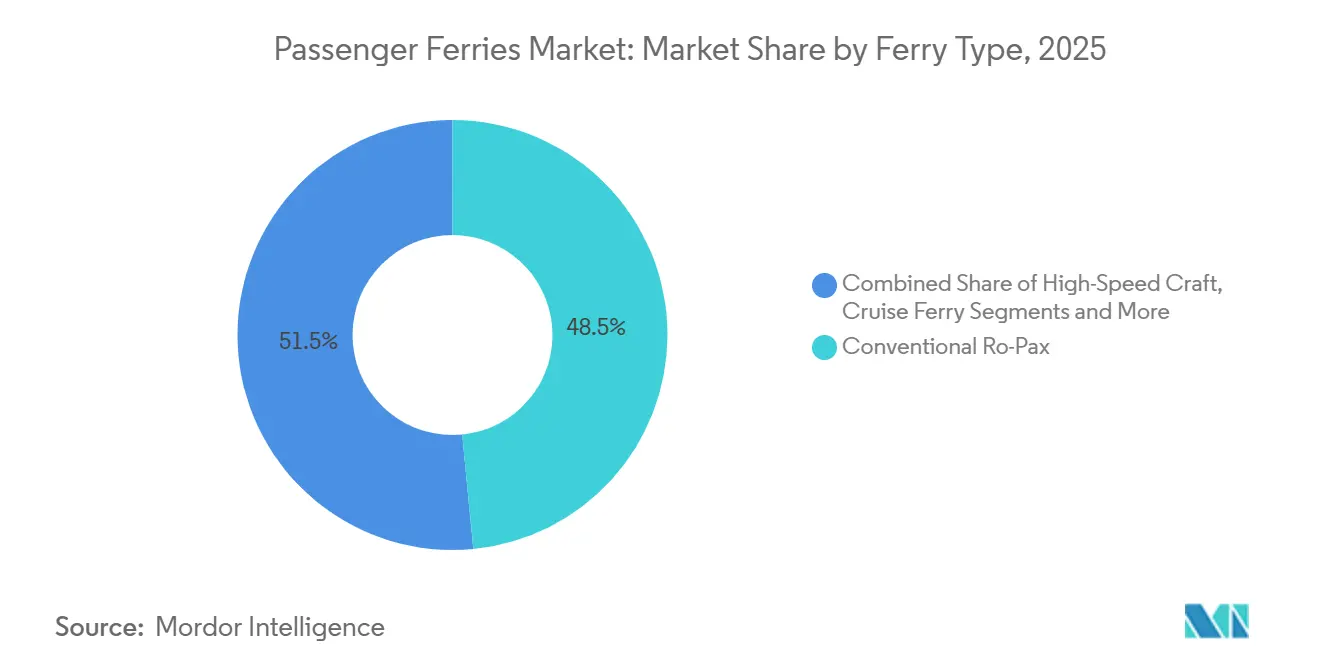
- By ferry type, conventional ro-pax vessels led with 48.46% of passenger ferries market share in 2025, hydrofoil & hovercraft designs are advancing at a 10.03% CAGR through 2031.
- By propulsion, diesel systems accounted for 68.68% of the passenger ferries market size in 2025, while fully electric/battery ferries are forecast to grow at an 11.60% CAGR to 2031.
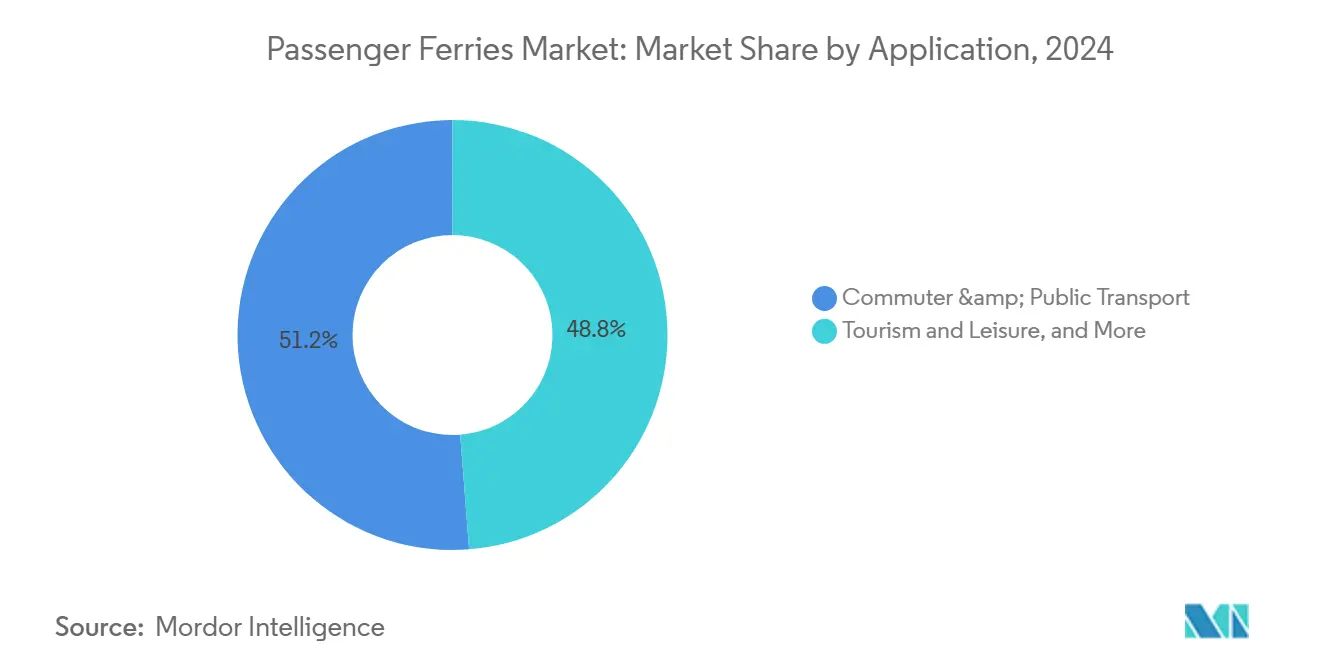
- By application, commuter & public transport captured 51.23% of the passenger ferries market share in 2025, tourism & leisure is projected to expand at a 9.11% CAGR over 2026-2031.
- By operator type, government/public entities held 61.73% of the passenger ferries market size in 2025, whereas private commercial operators are set to record the highest 7.40% CAGR by 2031.
- By region, Europe commanded 35.51% of the passenger ferries market share in 2025, and Asia-Pacific is pacing the global field at an 8.10% CAGR during the outlook period.
Note: Market size and forecast figures in this report are generated using Mordor Intelligence’s proprietary estimation framework, updated with the latest available data and insights as of January 2026.
Global Passenger Ferries Market Trends and Insights
Drivers Impact Analysis*
| Driver | (~) % Impact on CAGR Forecast | Geographic Relevance | Impact Timeline |
|---|---|---|---|
| Government-Funded Island-Connectivity Corridors Catalyzing New Routes | +1.3% | Europe & APAC (Scotland, Greece, Indonesia) | Long term (≥ 4 years) |
| Looming IMO CII Compliance Deadlines Triggering Accelerated Fleet Renewal | +1.6% | Global (North America & Europe most exposed) | Short term (≤ 2 years) |
| Battery-As-A-Service Leasing Models Lowering Adoption Barriers for Operators | +0.8% | North America & Northern Europe, expanding to APAC | Medium term (2-4 years) |
| Automated Docking & Remote-Operations Tech Shrinking Port Turnaround Times | +0.7% | Developed markets with advanced ports | Medium term (2-4 years) |
| Offshore-Wind Service Synergies Creating Dual-Purpose Passenger Transfer Demand | +0.5% | North Sea, U.S. East Coast, and emerging in APAC | Long term (≥ 4 years) |
| Modular Floating Terminals Enabling Rapid Launch of Pop-Up Commuter Services | +0.4% | Urban coasts in North America, Europe, SE Asia | Medium term (2-4 years) |
| Source: Mordor Intelligence | |||
Government-Funded Island-Connectivity Corridors Catalyzing New Routes
Long-term public contracts guarantee cash flow, encouraging operators to modernize fleets, expand routes, and sustain affordable fares for remote communities. Scotland’s GBP 580 million (USD 780 million) commitment to CalMac until 2028 underwrites new zero-emission tonnage and shields operators from demand volatility. Greece and Indonesia follow similar subsidy models that convert ferries into public goods rather than commercial luxuries, giving the passenger ferry market durable volume baselines. Predictable income improves credit profiles, lowering borrowing costs for new-build programs. Contractual performance metrics linked to punctuality and emissions accelerate digitalization and energy-efficiency upgrades. Shipyards benefit from multi-year order pipelines that justify investments in alternative-propulsion production lines.
Looming IMO CII Compliance Deadlines Triggering Accelerated Fleet Renewal
The CII framework rates operational carbon efficiency yearly and mandates corrective plans for vessels stuck in D or E bands for three straight years. Faced with retrofit costs that frequently exceed residual values, operators are decommissioning older hulls early and ordering new builds optimized for A or B ratings. Stena Line’s NewMax class illustrates pre-emptive compliance, using optimized hulls and hybrid power to future-proof European routes. Procurement schedules are now anchored to CII windows instead of mechanical life cycles. Lenders increasingly tie interest margins to anticipated CII scores, further tilting capital toward high-efficiency projects. The rule also pressures under-utilized services to consolidate sailings, intensifying competition on high-frequency corridors within the passenger ferries market.
Battery-As-A-Service Leasing Models Lowering Adoption Barriers for Operators
Leasing packages convert steep battery capex into predictable opex, transferring technology-obsolescence risk to energy-storage specialists. Operators gain access to performance guarantees, maintenance, and end-of-life recycling, enabling them to prioritize hull investments over battery ownership. Public ferry agencies with fixed annual budgets can align lease payments to subsidy inflows, smoothing cash flow. Flexible swap-out provisions let vessels scale capacity as shore-power improves, a crucial hedge against rapidly evolving chemistries. In the passenger ferries industry, BaaS bridges the finance-technology gap that slows electrification in cash-constrained regions like Southeast Asia, while giving lessors long-horizon revenue streams tied to vessel service lives.
Automated Docking & Remote-Operations Tech Shrinking Port Turnaround Times
Sensor-fusion platforms such as Kongsberg’s AutoDock guide ferries within centimeters of the quay, trimming dwell times and curbing hull damage. Remote-operation centers enable one shore team to supervise multiple craft, mitigating labor shortages and standardizing safety protocols. Faster berth cycles elevate asset utilization, letting operators add peak-hour departures without extra tonnage. Predictive data from automated systems lowers unplanned downtime, reinforcing schedule reliability that commuters demand. These gains position advanced ports as preferred nodes, shaping competitive route maps inside the passenger ferries market[1]Kongsberg Maritime, “AutoDock Automated Docking,” kongsberg.com.
Restraints Impact Analysis*
| Restraint | (~) % Impact on CAGR Forecast | Geographic Relevance | Impact Timeline |
|---|---|---|---|
| Uncertain Green-Fuel Supply Chains (E-Methanol / Green H₂) Raising Project Risk | -1.2% | Global, acute, where hydrogen strategies dominate | Medium term (2-4 years) |
| Rising Insurance Premiums Linked to Lithium-Battery Fire-Safety Concerns | -0.9% | Global, concentrated among early electric adopters | Short term (≤ 2 years) |
| Berth Scarcity & Urban Port Congestion Limiting Schedule Expansion | -0.7% | Major urban terminals in Europe, North America, and APAC | Long term (≥ 4 years) |
| Exchange-Rate Volatility Compressing Fare Margins in Emerging Economies | -0.5% | Southeast Asia, South America, Africa | Short term (≤ 2 years) |
| Source: Mordor Intelligence | |||
Uncertain Green-Fuel Supply Chains (E-Methanol / Green H₂) Raising Project Risk
Operators confront a mismatch between 25-year hull lives and fuel contracts seldom extending beyond a decade. Maersk’s experience financing its own methanol production spotlights the capital hurdle smaller ferry firms cannot match. Hydrogen faces steeper costs and safety protocols, making infrastructure scarce. The stalemate deters orders for alternative-fuel vessels, nudging buyers toward battery options for sub-30 nm runs. Without long-term fuel offtake agreements, lenders discount future cash flows, inflating project-finance costs. As a result, green-fuel uncertainty chips 1.2 percentage points off forecast CAGR across the passenger ferries market.
Rising Insurance Premiums Linked to Lithium-Battery Fire-Safety Concerns
Construction quotes now bake in advanced suppression, thermal-runaway sensors, and crew-training budgets, adding roughly 10-15% to capex. Limited actuarial data on maritime battery longevity sustains a risk surcharge that dilutes operating-cost savings from cheap electricity. Some underwriters cap coverage unless operators prove segregated battery compartments and rapid-vent systems. Elevated insurance costs slow electric adoption in the passenger ferries industry until larger data pools improve risk pricing[2]Lloyd’s List, “Felicity Ace Fire Highlights EV Battery Risks,” lloydslist.com.
*Our forecasts treat driver/restraint impacts as directional, not additive. The impact forecasts reflect baseline growth, mix effects, and variable interactions.
Segment Analysis
By Ferry Type: Ro-Pax Versatility Versus Hydrofoil Efficiency
Conventional Ro-Pax vessels’ 48.46% stake in the 2025 passenger ferries market size reflects their ability to carry both passengers and vehicles across varying sea states, leveraging established roll-on infrastructure. Operators pursue hull-streamlining retrofits and hybrid powerplants to protect CII ratings without wholesale fleet replacement. Cruise ferries monetize onboard retail and hospitality, cushioning fuel-price swings. High-speed craft address time-sensitive commuters willing to pay premium fares, whereas double-ended hulls excel on ultra-short straits by eliminating vessel turning.
Hydrofoil & hovercraft platforms, expanding at a 10.03% CAGR, capitalize on active-foil stabilization that cuts drag by up to 80%, slashing energy use and securing high CII grades. Advances in composite materials and real-time control algorithms now permit operations in rougher seas, enlarging their route map. Lower operating costs counterbalance higher capex, encouraging fleets in Scandinavia and the Gulf to pilot foiling services. Within the wider passenger ferries market, these craft unlock previously marginal commuter corridors where shore-based alternatives remain congested.


By Propulsion Type: Diesel Durability Meets Electric Momentum
Diesel engines retained 68.68% of the passenger ferries market size thanks to global fuel distribution and range flexibility, yet fully electric hulls are registering an 11.60% CAGR as battery prices fall. Washington State Ferries projects 25% fuel-saving gains by converting Jumbo Mark II vessels to hybrid, underscoring transitional value. LNG offers partial compliance relief but faces methane-slip scrutiny, dampening order books.
Battery-electric craft excel on sub-30 nm sectors where daily distance aligns with shore-charging windows, delivering 60-70% lower energy costs and simplified maintenance. The passenger ferries market size for electric segments is poised to accelerate as megawatt-scale chargers proliferate. Hydrogen fuel-cell prototypes such as Japan’s Hanaria prove technical feasibility yet remain niche until bunkering ecosystems mature.
By Application: Commuter Staples Versus Tourism Upside
Commuter & public transport secured 51.23% of passenger ferries market share, anchored by predictable daily ridership and integrated ticketing that streamlines first-mile connections. Governments bundle service contracts with performance incentives, fostering punctuality and emissions goals. Vehicle-transport ro-pax units cater to logistics flows where trucking corridors lack bridges or tunnels.
Tourism & leisure voyages, expanding at a 9.11% CAGR, leverage experiential demand as travelers seek scenic transit combined with destination-style onboard amenities. Brittany Ferries, for instance, retrofits lounges and gastronomy zones to turn crossings into mini-cruises. Seasonal peaks create fleet-utilization challenges, prompting mixed-use interiors that toggle between freight lanes and passenger saloons throughout the year, a flexibility trend permeating the passenger ferries market.
By Operator Type: Public Dominance And Private Agility
Government/public entities controlled 61.73% of passenger ferries market size owing to mandated island lifeline services and subsidy frameworks. Access to concessional loans, e.g., BC Ferries’ USD 1 billion Canada Infrastructure Bank facility, underwrites large hybrid orders that smaller rivals cannot match. Such backing accelerates the adoption of zero-emission technologies, reshaping procurement norms across the passenger ferries industry.
Private commercial firms, growing at 7.40% CAGR, exploit niche routes and flexible pricing but wrestle with higher capital costs. They often pioneer modular terminals and BaaS schemes to sidestep infrastructure barriers. Mixed public-private joint ventures are emerging to blend subsidy security with entrepreneurial efficiency, signaling governance innovation that may rebalance the passenger ferries market share landscape over the next decade.
Geography Analysis
Europe’s 35.51% contribution to the passenger ferries market share rests on dense coastal populations, robust tourism flows, and stringent EU emission caps that push operators toward hybrid and electric tonnage. The bloc’s extension of its Emissions Trading System to short-sea shipping in 2026 will impose carbon costs on diesel craft, nudging fleet planners toward low-carbon designs. Northern Europe also hosts pilot hydrogen and autonomous-ferry corridors, positioning the region as a technology export hub within the passenger ferries market.
Archipelagic geographies and megacity congestion propel Asia-Pacific’s leading 8.10% CAGR. Indonesia’s ASDP now links 154 ports across 13,000 km, anchoring regional demand while China’s large-scale electric-vessel programs lower unit costs globally. Japanese yards are scaling hydrogen fuel-cell know-how, and South Korean builders are accelerating battery-ready hull lines, collectively advancing propulsion innovation[3]China State Shipbuilding Corporation, “Zero-Carbon Water Transportation,” cssc.net.cn .
North America trails Europe in share, but commands outsized influence on propulsion standards through marquee projects such as Washington State Ferries’ hybrid conversions and New York’s zero-emission fast-ferry trials. Federal infrastructure grants reward domestic build programs, stimulating shipyard modernization. Elsewhere, South America and Africa present untapped latent demand restrained by currency volatility, port deficits, and limited financing, challenges that multinational lenders and development banks aim to address to grow the passenger ferries market.

Competitive Landscape
Global competition remains moderately fragmented. Top regional incumbents often hold protected public-service contracts, yet face technology disruptors introducing electric hydrofoils with radically lower operating costs. Washington State Ferries’ USD 714.5 million order from Eastern Shipbuilding illustrates how large tenders can shift industrial capacity and influence supply-chain scaling. Stena Line’s NewMax launch underscores first-mover advantages in CII compliance and passenger amenity leadership.
Strategic plays revolve around asset flexibility, with dual-purpose wind-crew ferries grabbing multi-sector charters. Technology alliances between propulsion vendors and operators speed up the scaling of autonomous docking and energy-storage swaps. Venture-financed startups, notably in Norway and the U.K., deploy electric hydrofoils and offer pay-per-use platform licenses, threatening legacy operators on short urban links. Insurance cost spikes for lithium-fire risk and green-fuel supply gaps create entry hurdles that favor capital-strong incumbents, yet also motivate collaborations with battery lessors and fuel producers. Within the passenger ferries market, competitive intensity is projected to tighten as CII non-compliant vessels exit service and berth scarcity in core ports caps supply, raising the strategic value of viable terminal slots[4]Riviera Maritime Media, “Stena Line’s Second NewMax Ship Launches,” rivieramm.com.
Passenger Ferries Industry Leaders
Stena Line
DFDS Seaways
BC Ferries
Washington State Ferries
Fjord1
- *Disclaimer: Major Players sorted in no particular order

Recent Industry Developments
- March 2026: BC Ferries launched the 10th Island Class vessel in their fleet renewal program, representing major increases in passenger and vehicle capacity and progress toward more modern, sustainable vessels.
- December 2025: AS Tallink Grupp extended the charter of SILJA EUROPA (used for accommodation in the Netherlands) up to 31 Jan 2027 with further options.
- November 2025: P&O Ferries launched a new ticketing platform (in partnership with Expian) to ease agent bookings and upsell extras like cabins, food & drink, upgrades, improving digital sales across services.
- November 2025: Stena Line entered a temporary space charter collaboration with Irish Ferries, where Stena Line carried Irish Ferries’ freight/passengers while conducting vessel maintenance; this ensured continuity and cross operator support.


Global Passenger Ferries Market Report Scope
| Conventional Ro-Pax |
| High-Speed Craft |
| Cruise Ferry |
| Double-Ended Ferry |
| Hydrofoil & Hovercraft |
| Diesel |
| Diesel-Electric Hybrid |
| Fully Electric / Battery |
| LNG |
| Hydrogen Fuel Cell |
| Commuter & Public Transport |
| Tourism & Leisure |
| Vehicle Transport (Ro-Pax) |
| Island / Remote Connectivity |
| Mixed-Use Transport (Cargo + Passenger) |
| Government / Public |
| Private Commercial |
| Mixed Public-Private |
| North America | United States |
| Canada | |
| Mexico | |
| South America | Brazil |
| Peru | |
| Chile | |
| Argentina | |
| Rest of South America | |
| Asia-Pacific | India |
| China | |
| Japan | |
| Australia | |
| South Korea | |
| South East Asia (Singapore, Malaysia, Thailand, Indonesia, Vietnam, and Philippines) | |
| Rest of Asia-Pacific | |
| Europe | United Kingdom |
| Germany | |
| France | |
| Spain | |
| Italy | |
| BENELUX (Belgium, Netherlands, and Luxembourg) | |
| NORDICS (Denmark, Finland, Iceland, Norway, and Sweden) | |
| Rest of Europe | |
| Middle East and Africa | United Arab Emirates |
| Saudi Arabia | |
| South Africa | |
| Nigeria | |
| Rest of Middle East And Africa |
| By Ferry Type (Value) | Conventional Ro-Pax | |
| High-Speed Craft | ||
| Cruise Ferry | ||
| Double-Ended Ferry | ||
| Hydrofoil & Hovercraft | ||
| By Propulsion Type (Value) | Diesel | |
| Diesel-Electric Hybrid | ||
| Fully Electric / Battery | ||
| LNG | ||
| Hydrogen Fuel Cell | ||
| By Application (Value) | Commuter & Public Transport | |
| Tourism & Leisure | ||
| Vehicle Transport (Ro-Pax) | ||
| Island / Remote Connectivity | ||
| Mixed-Use Transport (Cargo + Passenger) | ||
| By Operator Type (Value) | Government / Public | |
| Private Commercial | ||
| Mixed Public-Private | ||
| By Geography (Value) | North America | United States |
| Canada | ||
| Mexico | ||
| South America | Brazil | |
| Peru | ||
| Chile | ||
| Argentina | ||
| Rest of South America | ||
| Asia-Pacific | India | |
| China | ||
| Japan | ||
| Australia | ||
| South Korea | ||
| South East Asia (Singapore, Malaysia, Thailand, Indonesia, Vietnam, and Philippines) | ||
| Rest of Asia-Pacific | ||
| Europe | United Kingdom | |
| Germany | ||
| France | ||
| Spain | ||
| Italy | ||
| BENELUX (Belgium, Netherlands, and Luxembourg) | ||
| NORDICS (Denmark, Finland, Iceland, Norway, and Sweden) | ||
| Rest of Europe | ||
| Middle East and Africa | United Arab Emirates | |
| Saudi Arabia | ||
| South Africa | ||
| Nigeria | ||
| Rest of Middle East And Africa | ||


Key Questions Answered in the Report
How large will global passenger-ferry revenues be by 2031?
The passenger ferries market size is forecast to reach USD 13.27 billion by 2031, reflecting a 6.09% CAGR from 2026 to 2031.
Which vessel category is growing fastest?
Hydrofoil & hovercraft ferries are advancing at a 10.03% CAGR as their energy-efficient designs align with strict CII ratings.
What propulsion technology is gaining the most traction?
Fully electric/battery systems show the sharpest uptake, expanding at an 11.60% CAGR, where shoreside charging supports short-distance routes.
Why are governments critical to market stability?
Subsidized island-connectivity contracts guarantee revenue streams that finance new zero-emission vessels and keep fares affordable for remote communities.
Who dominates ferry operations—public or private owners?
Government and public operators account for 63.70% of market share, but private commercial services are expanding faster at 6.60% CAGR by targeting tourism and premium commuter routes.
Which region offers the highest growth runway?
Asia-Pacific leads with an 8.10% CAGR, driven by archipelagic geographies, urban congestion, and large-scale electrification initiatives.
Page last updated on:


