Europe Bus Market Size and Share
Market Overview
| Study Period | 2019 - 2031 |
|---|---|
| Forecast Data Period | 2026 - 2031 |
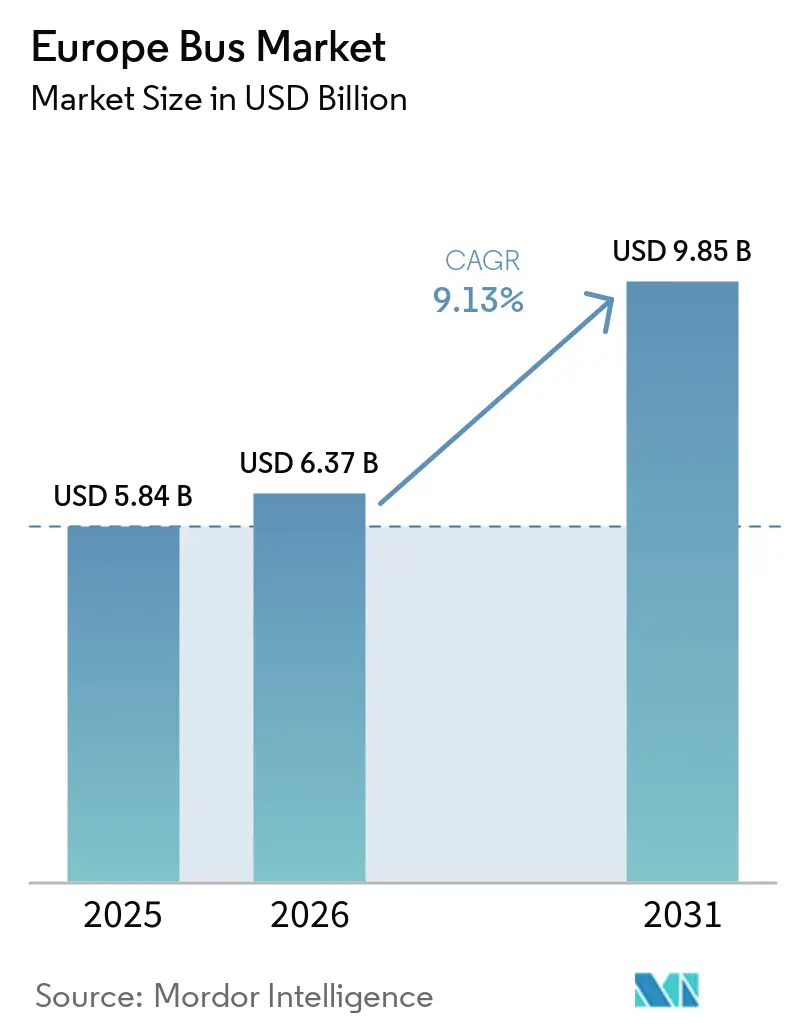
| Base Year Market Size (2025) | USD 5.84 Billion |
| Market Size (2026) | USD 6.37 Billion |
| Market Size (2031) | USD 9.85 Billion |
| Growth Rate (2026 - 2031) | 9.13% CAGR |
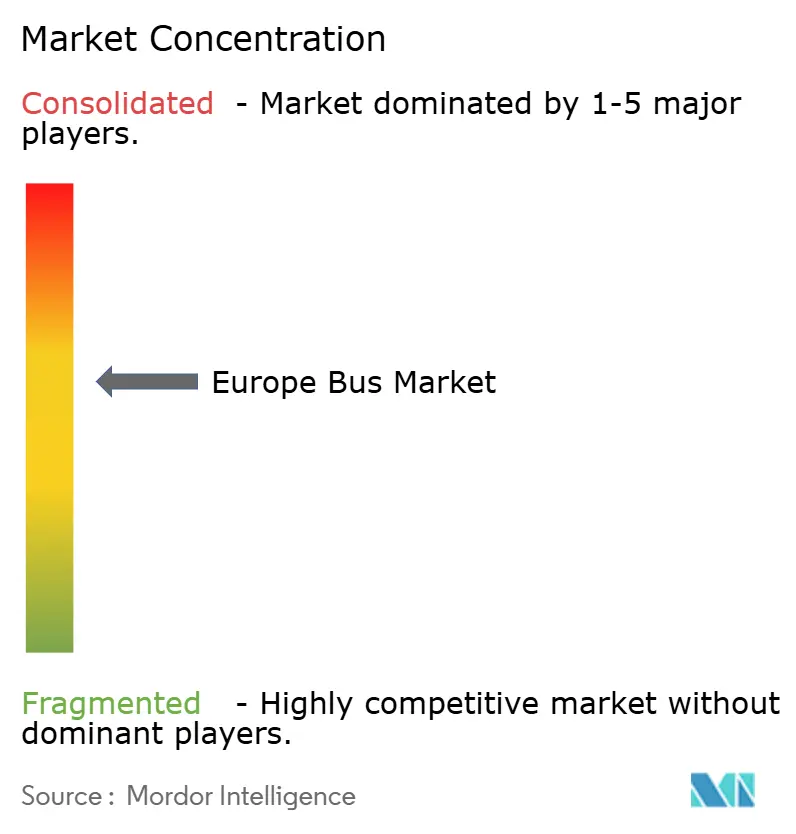
| Market Concentration | Medium |
Major Players *Disclaimer: Major Players sorted in no particular order Image © Mordor Intelligence. Reuse requires attribution under CC BY 4.0. | |
Europe Bus Market Analysis by Mordor Intelligence
The Europe bus market size is expected to grow from USD 5.84 billion in 2025 to USD 6.37 billion in 2026 and is forecast to reach USD 9.85 billion by 2031 at a 9.13% CAGR over 2026–2031. Several factors are driving growth, including regulatory quotas mandating transit agencies to purchase zero-emission vehicles, the establishment of numerous municipal zero-emission zones, and urban ridership returning to a significant portion of pre-pandemic levels. Operators are shifting their procurement focus from diesel to battery-electric vehicles, and in select pilot programs, to hydrogen fuel-cell platforms. This shift comes as total cost of ownership (TCO) models begin to favor these alternatives over diesel in various high-mileage duty cycles. Sovereign stimulus, funneled through the EU Recovery and Resilience Facility, national KsNI grants, and city-level initiatives like MOVES III, is mitigating upfront capital risks. However, with subsidy reductions anticipated in 2026, there's a growing emphasis on battery-as-a-service, residual-value guarantees, and leasing structures. Competitive dynamics are heating up: Chinese entrants are capitalizing on reduced battery costs, while established European OEMs are countering by bundling financing, telematics, and depot-integration services to maintain their market share.
Key Report Takeaways
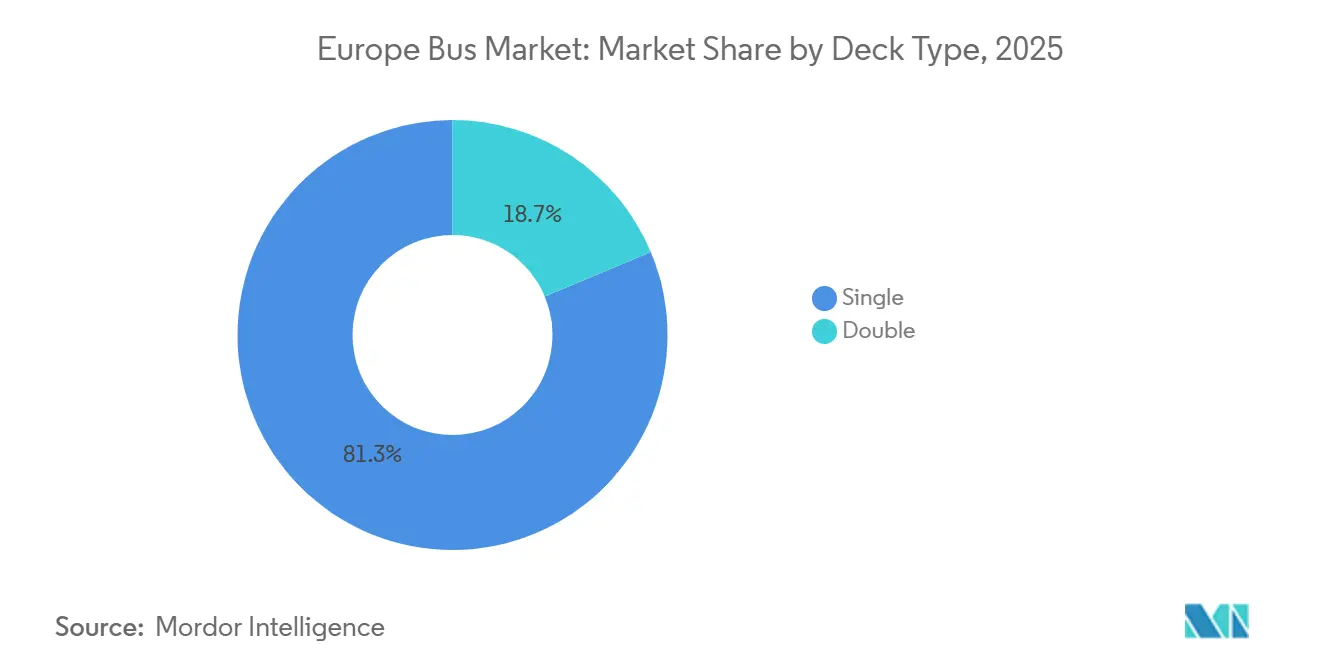
- By deck type, single-deck models led with an 81.31% share in 2025, while double-deckers are growing at a 9.15% CAGR.
- By application, transit buses accounted for 67.37% of the European bus market size in 2025; intercity coaches posted the fastest 9.21% CAGR to 2031.
- By fuel type, diesel captured 56.71% of the European bus market share in 2025, and battery electric vehicles are advancing at a 9.24% CAGR through 2031.
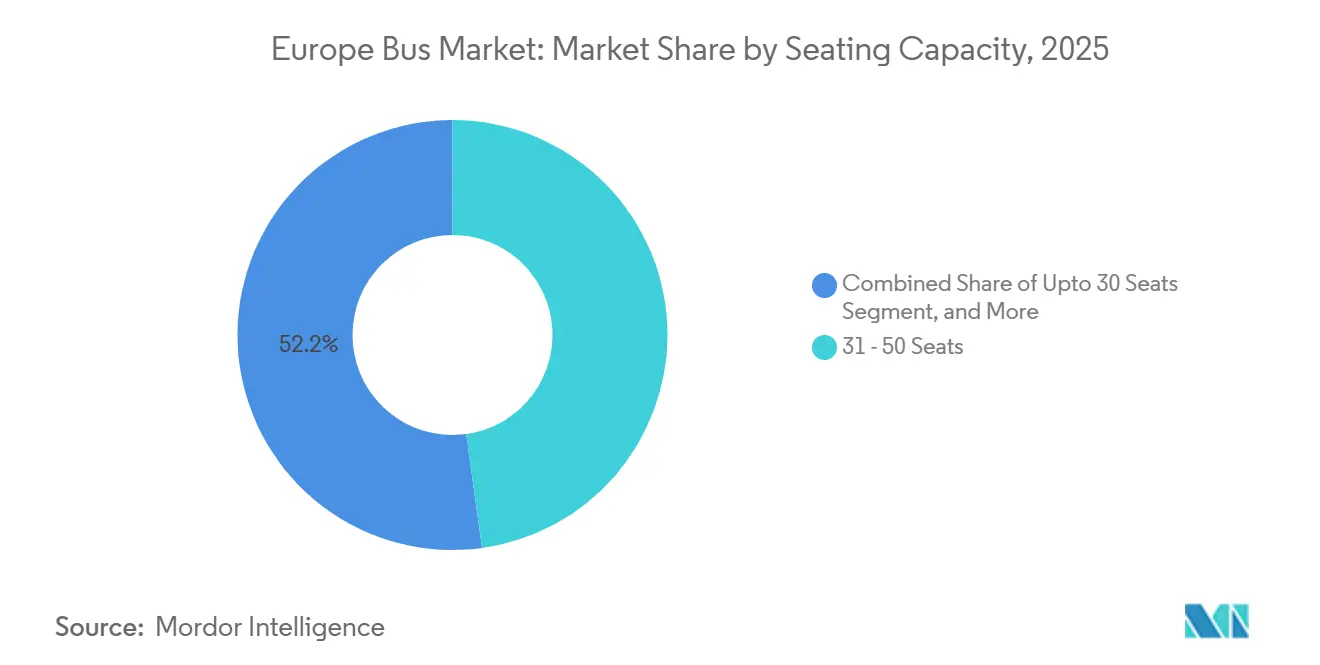
- By seating capacity, the 31–50 seat class held 47.83% share in 2025, whereas minibuses of up to 30 seats are expanding at 9.17% CAGR.
- By length, 9–12 m units represented 63.47% of 2025 deliveries; sub-9 m buses are rising at 9.27% CAGR.
- By country, Germany commanded 28.71% of 2025 revenue, but Italy is the fastest-growing geography at 9.19% CAGR on the back of PNRR-funded megatenders.
Note: Market size and forecast figures in this report are generated using Mordor Intelligence’s proprietary estimation framework, updated with the latest available data and insights as of January 2026.
Europe Bus Market Trends and Insights
Drivers Impact Analysis*
| Driver | (~) % Impact on CAGR Forecast | Geographic Relevance | Impact Timeline |
|---|---|---|---|
| EU Clean-Bus Mandate | +2.4% | EU-wide, strongest in Germany, France, Netherlands | Medium term (2-4 years) |
| Expansion of Urban Low-/Zero-Emission Zones | +2.1% | Western Europe core (UK, France, Germany, Italy), expanding to Spain, Poland | Short term (≤ 2 years) |
| EU Recovery and Resilience Facility Capital Spending | +1.8% | Southern and Eastern Europe (Italy, Spain, Poland, Romania) | Medium term (2-4 years) |
| Post-COVID Public-Transport Ridership Rebound | +1.5% | Global, with faster recovery in Scandinavia, Germany, France | Short term (≤ 2 years) |
| OEM "Battery-As-A-Service" and Residual-Value Guarantees | +1.2% | EU-wide, early adoption in UK, Netherlands, Germany | Medium term (2-4 years) |
| Growth of Intercity Low-Entry E-Bus Tenders | +0.9% | Germany, Sweden, Netherlands, France | Long term (≥ 4 years) |
| Source: Mordor Intelligence | |||
EU Clean-Bus Mandate (2025/30 Targets)
Under the Clean Vehicle Directive, member states must ensure that by 2025, a significant percentage of procured buses are clean, with this requirement increasing further by 2030 [1]EUR-Lex, “Directive (EU) 2019/1161 on the Promotion of Clean and Energy-Efficient Road Transport Vehicles,” eur-lex.europa.eu . Notably, half of these buses must feature zero-emission drivetrains. In response, operators are securing their positions: DB Regio, for instance, has placed a substantial multi-year order for thousands of units. This move not only sidesteps potential penalties but also solidifies demand for battery-electric platforms. Evidence of over-compliance is apparent: in 2024, nearly half of new city buses delivered in the EU were zero-emission, a notable increase from the previous year, showcasing a shift in fleet planning [2]Transport & Environment, “Zero-Emission Buses Excel in 2024 European Market,” transportenvironment.org . OEMs boasting modular platforms adaptable to various member-state regulations stand to gain the most, positioning themselves for rapid scaling.
Expansion of Urban Low-/Zero-Emission Zones
Thirty-five cities across Europe have either implemented or announced zero-emission zones, effectively banning diesel buses in specific areas. This move is hastening the early retirement of internal combustion engine (ICE) assets. London currently boasts over 1,800 electric buses and has mandated that all new double-decker buses must be zero-emission starting in 2025 [3]London Mayor’s Office, “London Fleet Electrification Update 2025,” london.gov.uk. Similarly, Paris is on track to fully electrify its RATP fleet by 2025, necessitating 4,700 electric buses and corresponding charging infrastructure upgrades. These zero-emission zones have led to a divided market: urban operators grapple with strict compliance deadlines, while their suburban counterparts still have the flexibility to use diesel, driving up the demand for nimble sub-9-meter buses adept at navigating the city's historic districts.
Post-COVID Public-Transport Ridership Rebound
In Germany, France, and Scandinavia, fare-box receipts have nearly returned to pre-pandemic levels, rejuvenating cash flows for operators who had postponed fleet investments. With ridership stabilizing, DB Regio secured a significant framework agreement, mirroring similar tenders in the UK and Spain. Corridors that faced overcrowding in late 2024 are now introducing articulated battery-electric and double-decker buses, boosting per-trip capacity without increasing labor expenses.
EU Recovery and Resilience Facility Capital Spending
With the substantial RRF funding, public-transport electrification receives a significant boost. Municipalities in Austria, Italy, and Spain are racing against the clock, needing to commit funds within a few years. Austria has allocated a considerable amount specifically for e-bus purchases and charging depots. Meanwhile, Italy's PNRR directs comparable investments into the cities of Rome and Milan. OEMs like Solaris, Daimler, and Volvo, who can promise swift deliveries, are consistently outpacing their competitors. However, in a twist, cost-conscious cities in Spain and Poland are leaning towards the offerings of BYD and Yutong.
Restraints Impact Analysis*
| Restraint | (~) % Impact on CAGR Forecast | Geographic Relevance | Impact Timeline |
|---|---|---|---|
| Phase-Down of National E-Bus Purchase Subsidies | -1.3% | Germany, UK, France, Spain | Short term (≤ 2 years) |
| Depot Grid-Connection and Power-Capacity Delays | -1.1% | Dense urban areas (London, Paris, Berlin, Milan) | Medium term (2-4 years) |
| Professional-Driver Shortages | -0.8% | UK, Germany, France, Spain | Short term (≤ 2 years) |
| High Upfront Cost of Hydrogen Fuel-Cell Buses | -0.7% | Germany, Netherlands, UK (pilot markets) | Long term (≥ 4 years) |
| Source: Mordor Intelligence | |||
Phase-Down of National E-Bus Purchase Subsidies
Germany has reduced its KsNI subsidy to a significantly lower portion of the list price. Meanwhile, the UK's ZEBRA program lapsed in March 2024, and there's no immediate replacement in sight. To navigate financing challenges, operators are turning to battery-leasing and residual-value agreements with OEMs like Daimler and Volvo. Given their capital constraints, regional fleets might postpone electrification, leading to a temporary dip in orders until fresh fiscal solutions are introduced.
Depot Grid-Connection and Power-Capacity Delays
In dense metros like London, Berlin, and Milan, approvals for distribution network operators can take a significant amount of time, delaying the rollout of large fleets. In response, operators are staging deliveries and testing opportunity-charging solutions to ease depot loads. However, the added infrastructure costs extend payback periods and temper immediate growth.
*Our forecasts treat driver/restraint impacts as directional, not additive. The impact forecasts reflect baseline growth, mix effects, and variable interactions.
Segment Analysis
By Deck Type: Double-Deckers Gain Urban Traction
Double-deckers are advancing at a 9.15% CAGR through 2031. The Europe bus market size for this deck type will therefore widen faster than that of single-decks, even though single-decks commanded 81.31% share in 2025. Recent contracts include 104 Wrightbus StreetDeck Electroliners delivered to Go-Ahead Oxford and an 800-unit framework awarded by Ireland’s National Transport Authority, signaling strong replacement demand in the UK and Ireland. Chinese OEMs are also testing the segment: Yutong’s U11DD trial offers 662 kWh of battery capacity aimed at long-range intercity work. Growth is tied to the need for high-capacity vehicles on constrained curb space, especially in London, Dublin, and Belfast.
Single-deckers will keep dominating everyday urban operations because of lower acquisition cost, broader height clearance, and mature service networks. However, their slower growth rate suggests incremental rather than breakout volume. OEM differentiation will hinge on offering modular layouts that can be homologated quickly for varying door positions and interior specifications across continental Europe.


By Application: Intercity Coaches Electrify Long-Distance Routes
Transit buses drove 67.37% of 2025 deliveries but intercity and motorcoach applications will post the quickest 9.21% CAGR to 2031, transforming the Europe bus market. Volvo’s 8900 Electric secured 60-unit orders from Sweden’s Svealandstrafiken, while DB Regio added 200 BYD electric coaches to serve regional corridors. Operators cite 500-700 km certified range as the tipping point for diesel replacement on popular lines such as Berlin–Hamburg and Madrid–Valencia.
Although school and charter niches remain small, the shift toward step-free, low-entry coach designs to comply with EU accessibility mandates adds incremental demand. OEMs with platforms that share drivetrains and electronics across transit and intercity variants capture scale efficiencies, boosting margins while simplifying parts inventory for operators.
By Fuel Type: Battery-Electric Overtakes Diesel
Diesel became the single largest revenue contributor to the European bus market with a 56.71% share in 2025, and battery electric vehicles are projected to grow at a 9.24% CAGR. The transition is powered by cheaper lithium-iron phosphate chemistries that push pack prices below USD 120 per kWh, faster three-hour depot charging, and regulatory zero-tailpipe-emission rules.
Fuel-cell electric buses remain pilot-scale, limited by hydrogen costs north of USD 8 per kg and sparse refueling infrastructure. Germany and the Netherlands each field fewer than 200 units today. Plug-in hybrids and CNG are transitional and lose share because urban access rules tighten around zero-emission compliance.
By Seating Capacity: Minibuses Serve First-Mile Demand
Minibuses with up to 30 seats will expand at a 9.17% CAGR as cities invest in first-/last-mile circulators for low-emission zones. The Europe bus market size for this class is underpinned by models such as IVECO’s eDaily and Karsan’s e-JEST, both offering sub-200 km range suitable for feeder routes. Ageing demographics in Western Europe also favor step-free compact units.
Medium 31–50 seat layouts retain the largest 47.83% share in 2025, balancing capacity and maneuverability for most suburban routes. Double-axle versions in this class can easily be adapted to both city and intercity duty cycles, extending residual value and supporting higher fleet-replacement intervals.

By Bus Length: Compact Models Navigate Historic Districts
Sub-9 m buses are the fastest length segment and are forecast to grow at 9.27% CAGR. Historic districts in Rome, Seville, Lisbon, and Stockholm increasingly restrict large vehicles, making compact models the only viable option. Bluebus’s 6 m variant, for example, offers a 280 km urban range on a 126 kWh pack—adequate for 16-hour duty with midday top-ups.
The standard 9–12 m bracket will continue to dominate overall deliveries due to its versatility across route types, with 63.47% market share in 2025. However, competition intensifies as nearly every major OEM now markets at least two electric models within this length, eroding price premiums once commanded by early movers.
Geography Analysis
Germany retained a 28.71% share of the European bus market in 2025. Growth is bolstered by Federal KsNI grants, which cover a significant portion of depot infrastructure costs, and a substantial framework from DB Regio for thousands of units. Berlin, with hundreds of e-buses already in operation, aims for complete fleet electrification by the end of the decade. While Hamburg and Munich are on similar trajectories, grid-capacity limitations at inner-city depots have extended their roll-out timelines by over a year.
France, the UK, and Spain together represent a considerable portion of the market sales. Due to a substantial subsidy plan, France's RATP secured options for thousands of e-buses. Meanwhile, Spain's MOVES III program allocated significant funding to both Barcelona and Madrid. London boasts the largest electric bus fleet in Europe, with a notable number of units. However, the expiration of the ZEBRA scheme has compelled English operators to rely on local-authority funds and private leasing, leading to diminished order visibility in the coming years.
Italy is the fastest-expanding national segment at 9.19% CAGR, catalyzed by PNRR funds that must be committed by 2026. Contracts like IVECO’s significant deal for hundreds of e-buses in Rome and ATM Milan’s tender for a substantial number of units highlight the urgency in procurement. Meanwhile, growth prospects are also brightening in Poland, Romania, and the Baltic states, where grants from the cohesion fund align with competitive bids from manufacturers like BYD and Yutong.
Competitive Landscape
In the competitive European bus market, established players are fiercely defending their market share through service contracts, while low-cost entrants are challenging traditional pricing norms. In 2025, major players like Daimler, Volvo, MAN, and Solaris collectively secured a significant volume of orders for electric buses, leveraging their extensive parts and maintenance networks across the continent. Meanwhile, BYD and Yutong are capitalizing on substantial cost advantages in batteries, allowing them to clinch tenders in price-sensitive markets like Italy, Spain, and Eastern Europe.
Niche players are carving out their space by honing in on specific applications: Wrightbus is spearheading the electrification of double-decker buses in the UK; Irizar and VDL are the go-to names for low-entry intercity coach bids in Scandinavia; and Karsan’s e-JEST is the preferred choice for urban shuttle contracts operating at lower speeds. Ebusco is making waves with its lightweight composite 3.0 model, boasting an impressive range and positioning itself as a formidable competitor on total cost of ownership (TCO).
Innovative financing solutions are setting players apart in the market. Daimler and Volvo have introduced a 'battery-as-a-service' model, offering a package that includes energy storage, predictive maintenance, and recycling, all for a fixed monthly fee based on annual mileage. In response, Chinese OEMs are rolling out comprehensive packages that bundle vehicles with depot solutions, enabling a swift implementation timeline, especially beneficial in areas with straightforward grid upgrades.
Europe Bus Industry Leaders
Volvo Buses
Mercedes Benz Group AG
Solaris Bus & Coaches
MAN Truck & Bus
BYD Company Limited
- *Disclaimer: Major Players sorted in no particular order

Recent Industry Developments
- May 2025: Daimler Buses wins contract to build an electric-bus depot in Lüneburg, Germany, with 20 charging points and 20 eCitaro units, backed by EUR 9.6 million (USD 10.75 million) federal funding.
- May 2025: VAG Nuremberg receives 31 eCitaro G articulated buses, cementing the city’s shift to electric public transport.


Research Methodology Framework and Report Scope
Market Definitions and Key Coverage
Our study defines the Europe bus market as revenue generated from the sale of new, factory-built single-deck, double-deck, articulated, and coach-style buses with a gross weight above 5 metric tons that are licensed for public or private passenger transport across EU-27, U.K., EFTA, and candidate countries. According to Mordor Intelligence, this scope follows UNECE M2/M3 classifications and captures diesel, hybrid, battery-electric, and fuel-cell drivetrains while leaving out micro-shuttles and aftermarket services.
Scope Exclusions: The model omits revenue from van-derived minibuses, second-hand imports, and parts or maintenance contracts.
Segmentation Overview
- By Deck Type
- Single
- Double
- By Application
- Transit Bus
- Intercity Bus / Motorcoach
- School Bus
- Others
- By Fuel Type
- Diesel
- Battery Electric
- Plug-in Hybrid
- Fuel Cell Electric
- Others
- By Seating Capacity
- Up to 30 seats
- 31 - 50 seats
- More than 50 seats
- By Bus Length
- Up to 9 m
- 9 - 12 m
- More than 12 m
- By Country
- Germany
- France
- United Kingdom
- Italy
- Spain
- Rest of Europe
Detailed Research Methodology and Data Validation
Primary Research
Interviews with European fleet operators, leasing banks, chassis OEM product heads, and charging-infrastructure planners helped us test secondary findings, sense-check adoption hurdles, and benchmark average selling prices across diesel and zero-emission variants. Surveys with city procurement officers in Germany, Italy, and the Nordics validated replacement cycles and subsidy pass-through assumptions. This direct feedback let us tighten cost-of-ownership differentials embedded in our findings.
Desk Research
We began with open statistics from Eurostat passenger-kilometer tables, ACEA new bus registrations, and EU Clean Vehicles Directive quota filings, which framed baseline demand. Additional context came from national transport ministries, DVV Media Group's e-bus deployment reports, trade data lodged with UN Comtrade, and peer-reviewed papers on battery cost curves. For company-level clues, our analysts tapped D&B Hoovers and Dow Jones Factiva, while Marklines supplied model-specific production totals. These sources, cited as illustrations only, feed an internal repository that Mordor analysts reference for every quarterly refresh; many further publications were also consulted for cross-checks and clarification.
Market-Sizing & Forecasting
A top-down reconstruction starts with 2024 new-registration and import-export data, which are then valued using median OEM invoice prices adjusted for incentive offsets; selective bottom-up supplier roll-ups act as a plausibility screen. Key model drivers include battery-pack price per kWh, Clean Bus quota escalation, municipal tender pipeline, real GDP growth, and diesel-to-BEV total-cost-of-ownership parity timing. Multivariate regression links these variables to historic unit swings, and an ARIMA overlay captures cyclical shocks before projections extend to 2030. Gaps in smaller economies are bridged using penetration-rate analogs from demographically similar peers.
Data Validation & Update Cycle
Outputs undergo variance scans against ACEA quarterly releases, Euro exchange-rate re-runs, and headline OEM disclosures; anomalies trigger analyst rechecks. Two reviewers sign off before publication. Reports update annually, with interim edits whenever subsidy schemes, major tenders, or emission rules materially shift the baseline.
Why Our Europe Bus Baseline Commands Reliability
Published estimates often diverge because firms pick dissimilar vehicle classes, price stacks, and refresh cadences.
Key gap drivers include whether coaches and minibuses are folded in, how electric-bus incentives are netted, and the currency year used for conversions. Mordor's disciplined scope alignment, annual refresh, and dual-path validation keep our figures consistent and decision-ready.
Benchmark comparison
| Market Size | Anonymized source | Primary gap driver |
|---|---|---|
| USD 6.41 Bn (2025) | Mordor Intelligence | |
| USD 10.6 Bn (2025) | Global Consultancy A | Adds long-distance coaches and shuttle vans without de-duplication |
| USD 14.44 Bn (2024) | Industry Journal B | Bundles aftermarket parts, uses 2023 FX and linear CAGR carry-forward |
| USD 5.12 Bn (2024) | Regional Consultancy C | Covers only eight core EU states and omits zero-emission units |
These comparisons show that once scope mismatches and pricing assumptions are stripped away, Mordor's balanced approach offers the most transparent, reproducible baseline for investors and planners.


Key Questions Answered in the Report
What is the current value of the European bus market?
The market is expected to generate USD 6.37 billion in revenue in 2026 and is forecast to reach USD 9.85 billion by 2031.
Which technology leads new bus orders in Europe?
Diesel leads, accounting for 56.71% of 2025 deliveries, while battery electric vehicles are growing at a 9.24% CAGR through 2031.
Why are double-deck buses gaining popularity?
Cities like London and Dublin need high-capacity vehicles that meet zero-emission rules without expanding curb space, driving a 9.15% CAGR for double-deckers.
How are subsidy reductions affecting procurement?
Lower per-unit grants in Germany and the UK push operators toward battery-leasing and residual-value guarantees instead of upfront purchases.
Which country is the fastest-growing market through 2031?
Italy posts the highest 9.19% CAGR, boosted by time-limited PNRR recovery funds and large tenders in Rome and Milan.
What is the main infrastructure challenge for e-bus adoption?
Obtaining sufficient grid-connection capacity at depots, which can delay large fleet roll-outs by 12-18 months in dense urban areas.
Page last updated on:


