
Technology, Media and Telecom
5th MayPricing Strategy for Semiconductor Components
3 Min Read
The Interactive Projector Market Report is Segmented by Dimension (2D, and 3D), Technology (3LCD, and More), Projection Distance (Ultra-Short-Throw, and More), Light Source (Lamp, Laser, and More), Resolution (HD, Full HD, and 4K and Above), Connectivity (Wired, and Wireless), Application (Education, Corporate and Enterprise, and More), and Geography. The Market Forecasts are Provided in Terms of Value (USD).
Market Overview
| Study Period | 2020 - 2031 |
|---|---|
| Market Size (2026) | USD 4.41 Billion |
| Market Size (2031) | USD 8.75 Billion |
| Growth Rate (2026 - 2031) | 14.73 % CAGR |
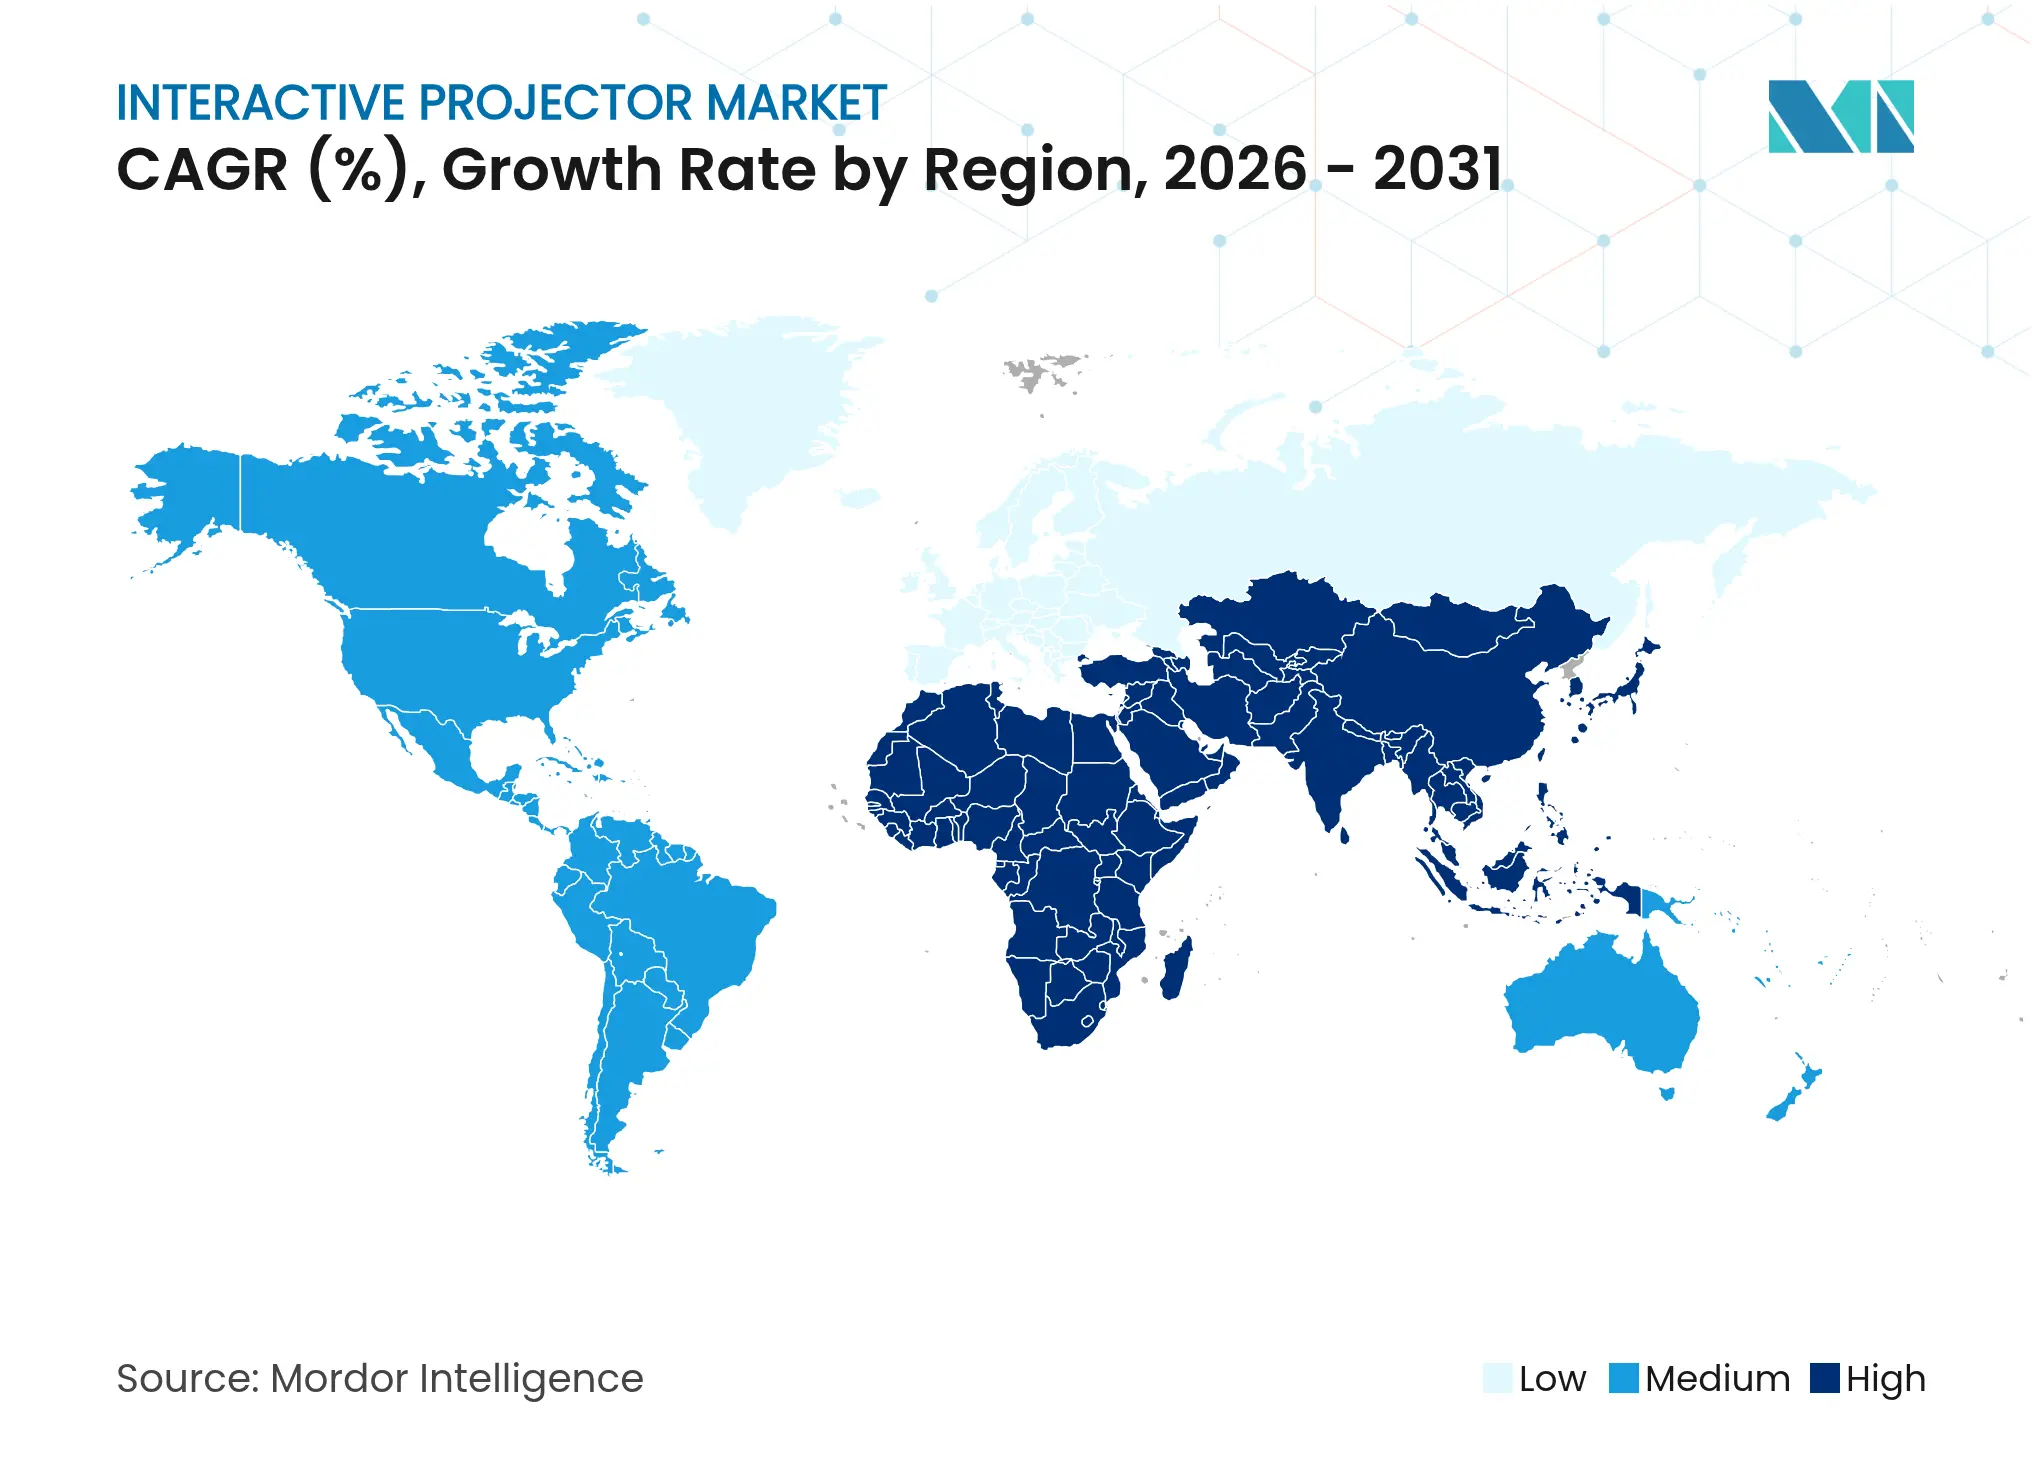
| Fastest Growing Market | Asia Pacific |
| Largest Market | North America |
| Market Concentration | Medium |
Major Players *Disclaimer: Major Players sorted in no particular order. Image © Mordor Intelligence. Reuse requires attribution under CC BY 4.0. |
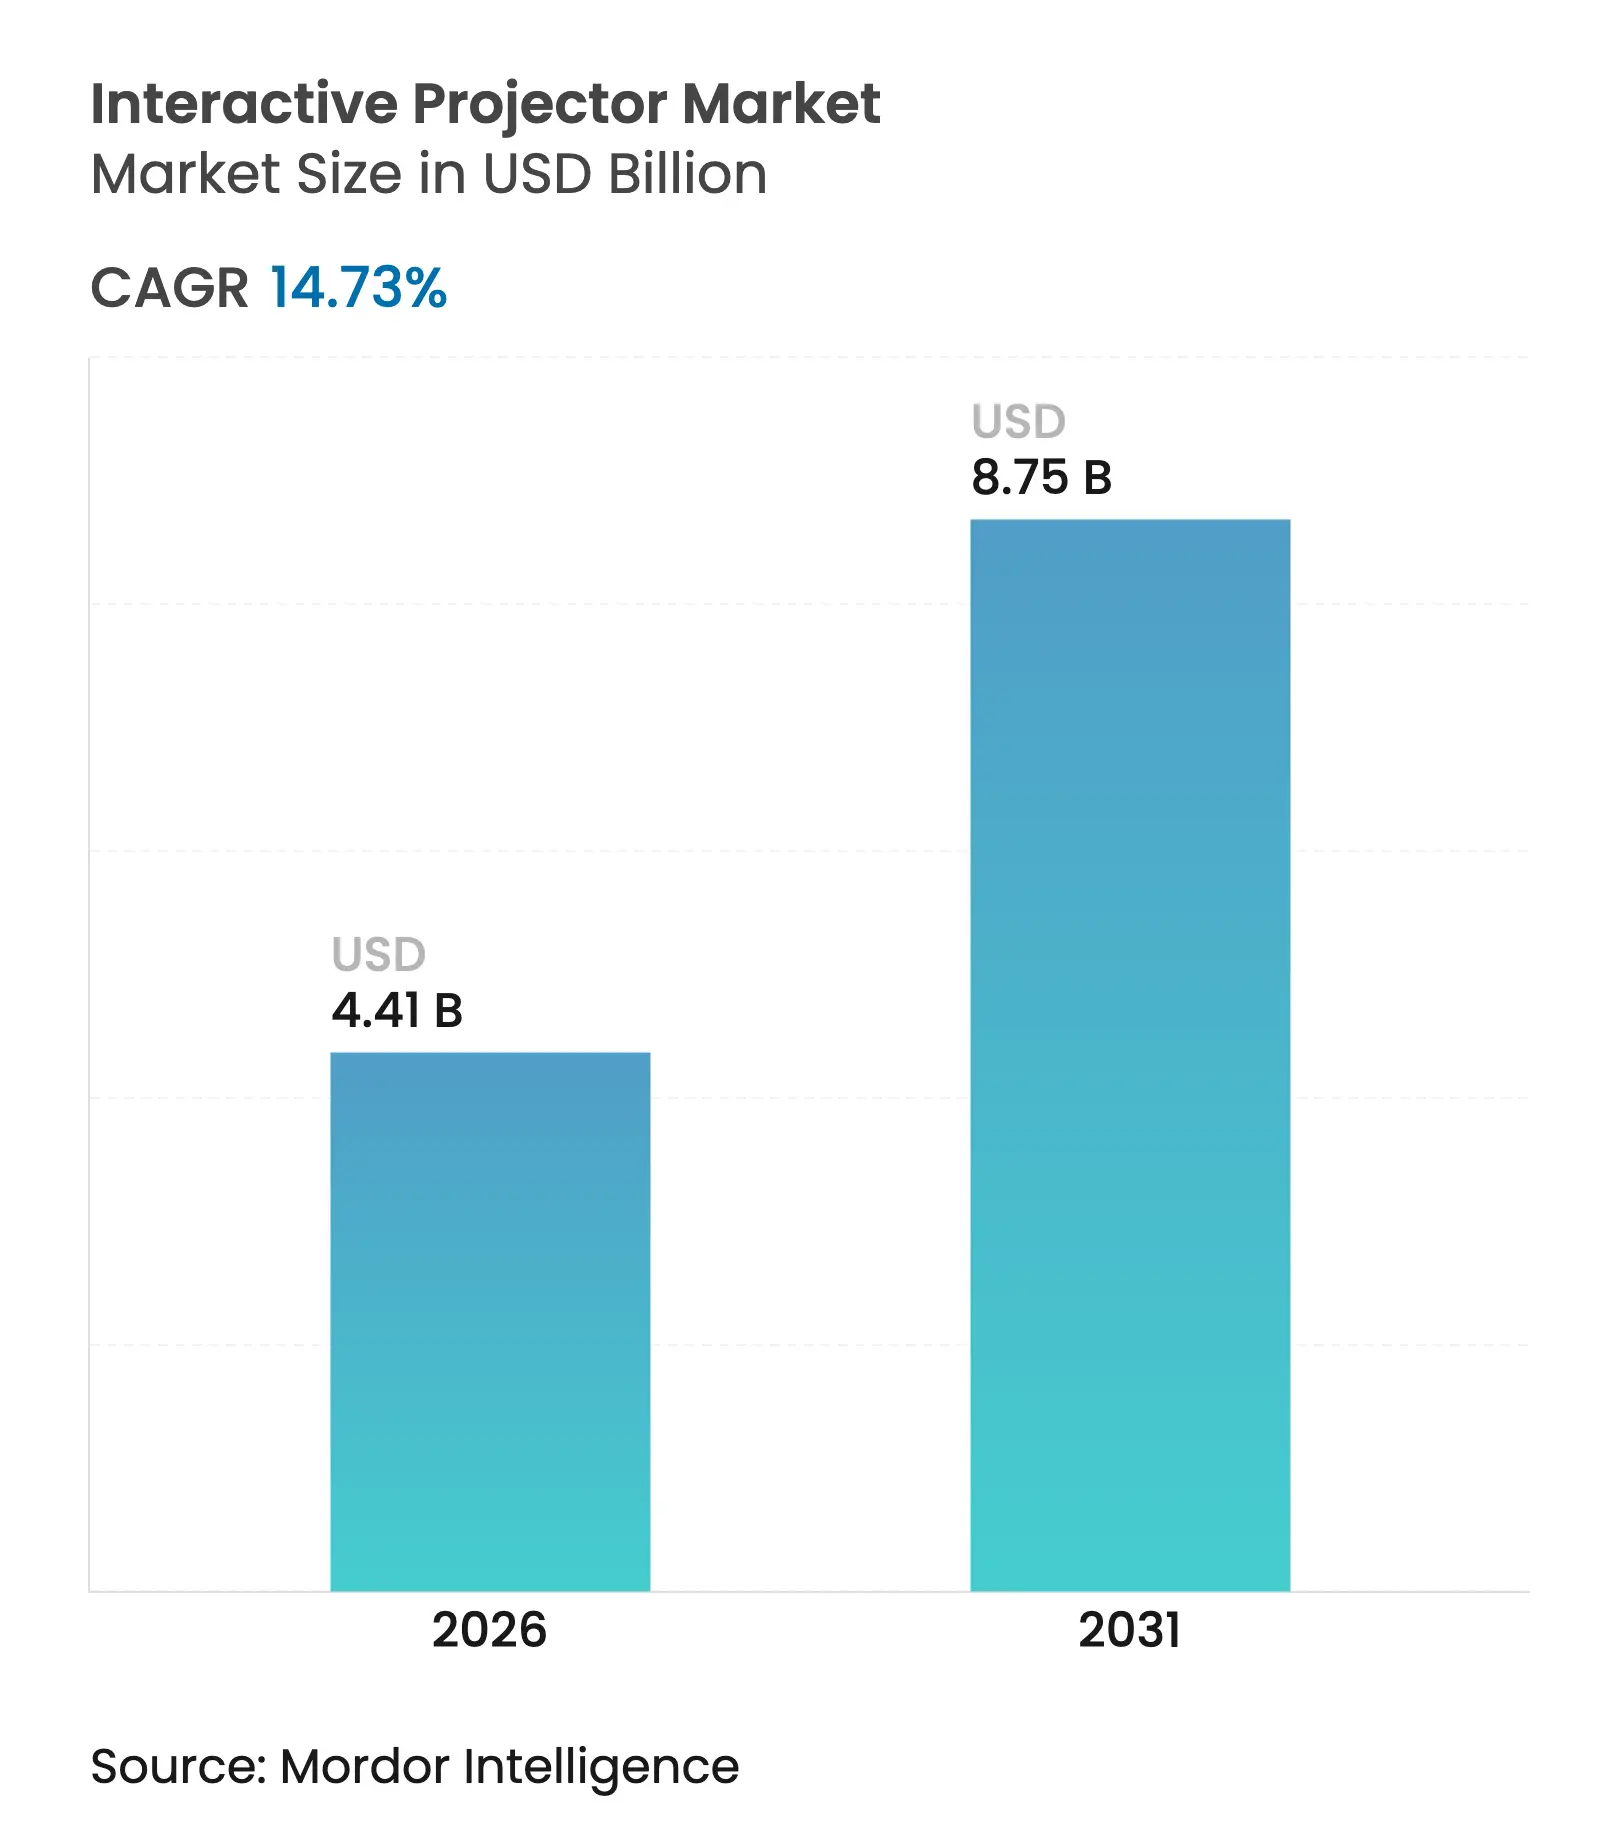
The interactive projector market size is expected to grow from USD 3.84 billion in 2025 to USD 4.41 billion in 2026 and is forecast to reach USD 8.75 billion by 2031 at 14.73% CAGR over 2026-2031. Strong demand stems from school districts normalizing hybrid classrooms, enterprises upgrading training rooms for distributed teams and governments funding smart-classroom infrastructure. Laser-based ultra-short-throw (UST) engines, falling component costs and widening 4K content adoption reinforce shipment growth. Vendors that bundle collaboration software, wireless casting and multi-user touch support are winning preference over bare-metal hardware suppliers. Corporate refresh cycles and premium education projects continue to favor higher-margin 3LCD and LCoS models, while price-sensitive buyers in emerging markets keep lamp units relevant.
Key Report Takeaways
Note: Market size and forecast figures in this report are generated using Mordor Intelligence's proprietary estimation framework, updated with the latest available data and insights as of 2026.
Drivers Impact Analysis
| Driver | (~)% Impact on CAGR Forecast | Geographic Relevance | Impact Timeline | |||
|---|---|---|---|---|---|---|
Surge in hybrid-learning models Surge in hybrid-learning models | +3.2% | United States, United Kingdom, South Korea | Medium term (2-4 years) | (~)% Impact on CAGR Forecast: +3.2% | Geographic Relevance:United States, United Kingdom, South Korea | Impact Timeline:Medium term (2-4 years) |
Corporate L&D shift to phygital suites Corporate L&D shift to phygital suites | +2.8% | North America, DACH region | Short term (≤ 2 years) | |||
Government-funded smart-classroom stimulus Government-funded smart-classroom stimulus | +3.5% | India, Saudi Arabia, emerging markets | Long term (≥ 4 years) | |||
Rapid penetration of UST laser engines Rapid penetration of UST laser engines | +2.1% | Global | Medium term (2-4 years) | |||
Rise of multi-user collaboration tools Rise of multi-user collaboration tools | +1.9% | Global | Short term (≤ 2 years) | |||
Retail and hospitality immersive signage Retail and hospitality immersive signage | +1.4% | Asia-Pacific airports, retail | Medium term (2-4 years) | |||
| Source: Mordor Intelligence | ||||||
Surge in Hybrid-Learning Models in K-12 and Higher-Ed
School systems now structure curricula around blended delivery, not emergency measures. Learning management systems integrate live annotation, cloud content and multi-party workspaces that rely on touch-enabled projection for group engagement.[1]Khalid Ilias Basheer Qolamani and Mohammad Mahdi Mohammed, “The Digital Revolution in Higher Education: Transforming Teaching and Learning,” ResearchGate, researchgate.net Higher engagement scores sustain budget allocation even after immediate pandemic pressures faded. U.S., U.K. and South Korean districts direct stimulus toward permanent UST displays, boosting the interactive projector market. Publishers rushing to interactive e-textbook formats further lock in projector demand.
Corporate L&D Shift to “Phygital” Training Suites
Enterprises replace slide-only sessions with blended physical-digital learning rooms that needs projectors capable of touchback, WebEx Board tie-ins and simultaneous annotation. North American and German firms adopt these suites to improve retention and shorten onboarding cycles. The shift converts one-time training budgets into evergreen infrastructure contracts, enlarging the interactive projector market’s service attach revenue.
Government-Funded Smart-Classroom Stimulus
India earmarked INR 22,919 crore (USD 275 million) to spur domestic display and projection component output, targeting USD 4,56,500 crore cumulative production value.[2]Press Information Bureau, “Cabinet Approves Electronics Component Manufacturing Scheme for Making India Atmanirbhar in Electronics Supply Chain,” pib.gov.in Saudi Arabia’s Vision 2030 channels funding toward immersive digital learning. Long-horizon grants give school boards certainty to procure interactive displays in bulk, supporting predictable factory utilization and lowering per-unit prices across the interactive projector market.
Rapid Penetration of Ultra-Short-Throw Laser Engines
UST laser models dropped below the USD 2,000 threshold at CES 2025 where 4K, 3,000-lumen units debuted.[3]Jeremy Glowacki, “The Evolution of Lifestyle Projectors and USTs at CES 2025,” Projector Central, projectorcentral.com Zero-shadow imaging, instant start and 20,000-hour light sources solve prior classroom pain points. Component cost declines driven by automotive laser demand reinforce adoption and step-change the interactive projector market toward solid-state dominance.
Restraints Impact Analysis
| Restraint | (~)% Impact on CAGR Forecast | Geographic Relevance | Impact Timeline | |||
|---|---|---|---|---|---|---|
High TCO of laser/LED sources vs. lamp High TCO of laser/LED sources vs. lamp | -1.8% | Global price-sensitive markets | Short term (≤ 2 years) | (~)% Impact on CAGR Forecast: -1.8% | Geographic Relevance: Global price-sensitive markets | Impact Timeline: Short term (≤ 2 years) |
Ceiling-height & ambient-light limits Ceiling-height & ambient-light limits | -1.2% | Europe, North America legacy sites | Long term (≥ 4 years) | |||
Low refresh-rate limits for STEM/VR Low refresh-rate limits for STEM/VR | -0.9% | Technical colleges, VR labs | Medium term (2-4 years) | |||
Shortage of certified AV integrators Shortage of certified AV integrators | -0.7% | Asia-Pacific, Middle East, Africa | Long term (≥ 4 years) | |||
| Source: Mordor Intelligence | ||||||
Surge in Hybrid-Learning Models in K-12 and Higher-Ed
Laser units list 40-60% higher than lamp models, deterring price-sensitive schools despite lifecycle savings. The budget hurdle is acute during economic slowdowns, as shown by Epson’s 1.4% Q2 2024 revenue dip tied to deferred upgrades.[4]Source: Seiko Epson Corporation, “Second Quarter Financial Results Fiscal Year 2024,” epson.com As diode production scales, the gap is narrowing, tempering the restraint over time.
Ceiling-Height and Ambient-Light Constraints
Retrofit classrooms in Europe and North America often lack 3 meter ceilings or blackout shades. Suboptimal mounting angles degrade image size and brightness, raising installation costs. Facilities teams may delay adoption until broader renovations occur, moderating near-term unit volumes in mature markets.
By Dimension: 3D Technology Gains Traction
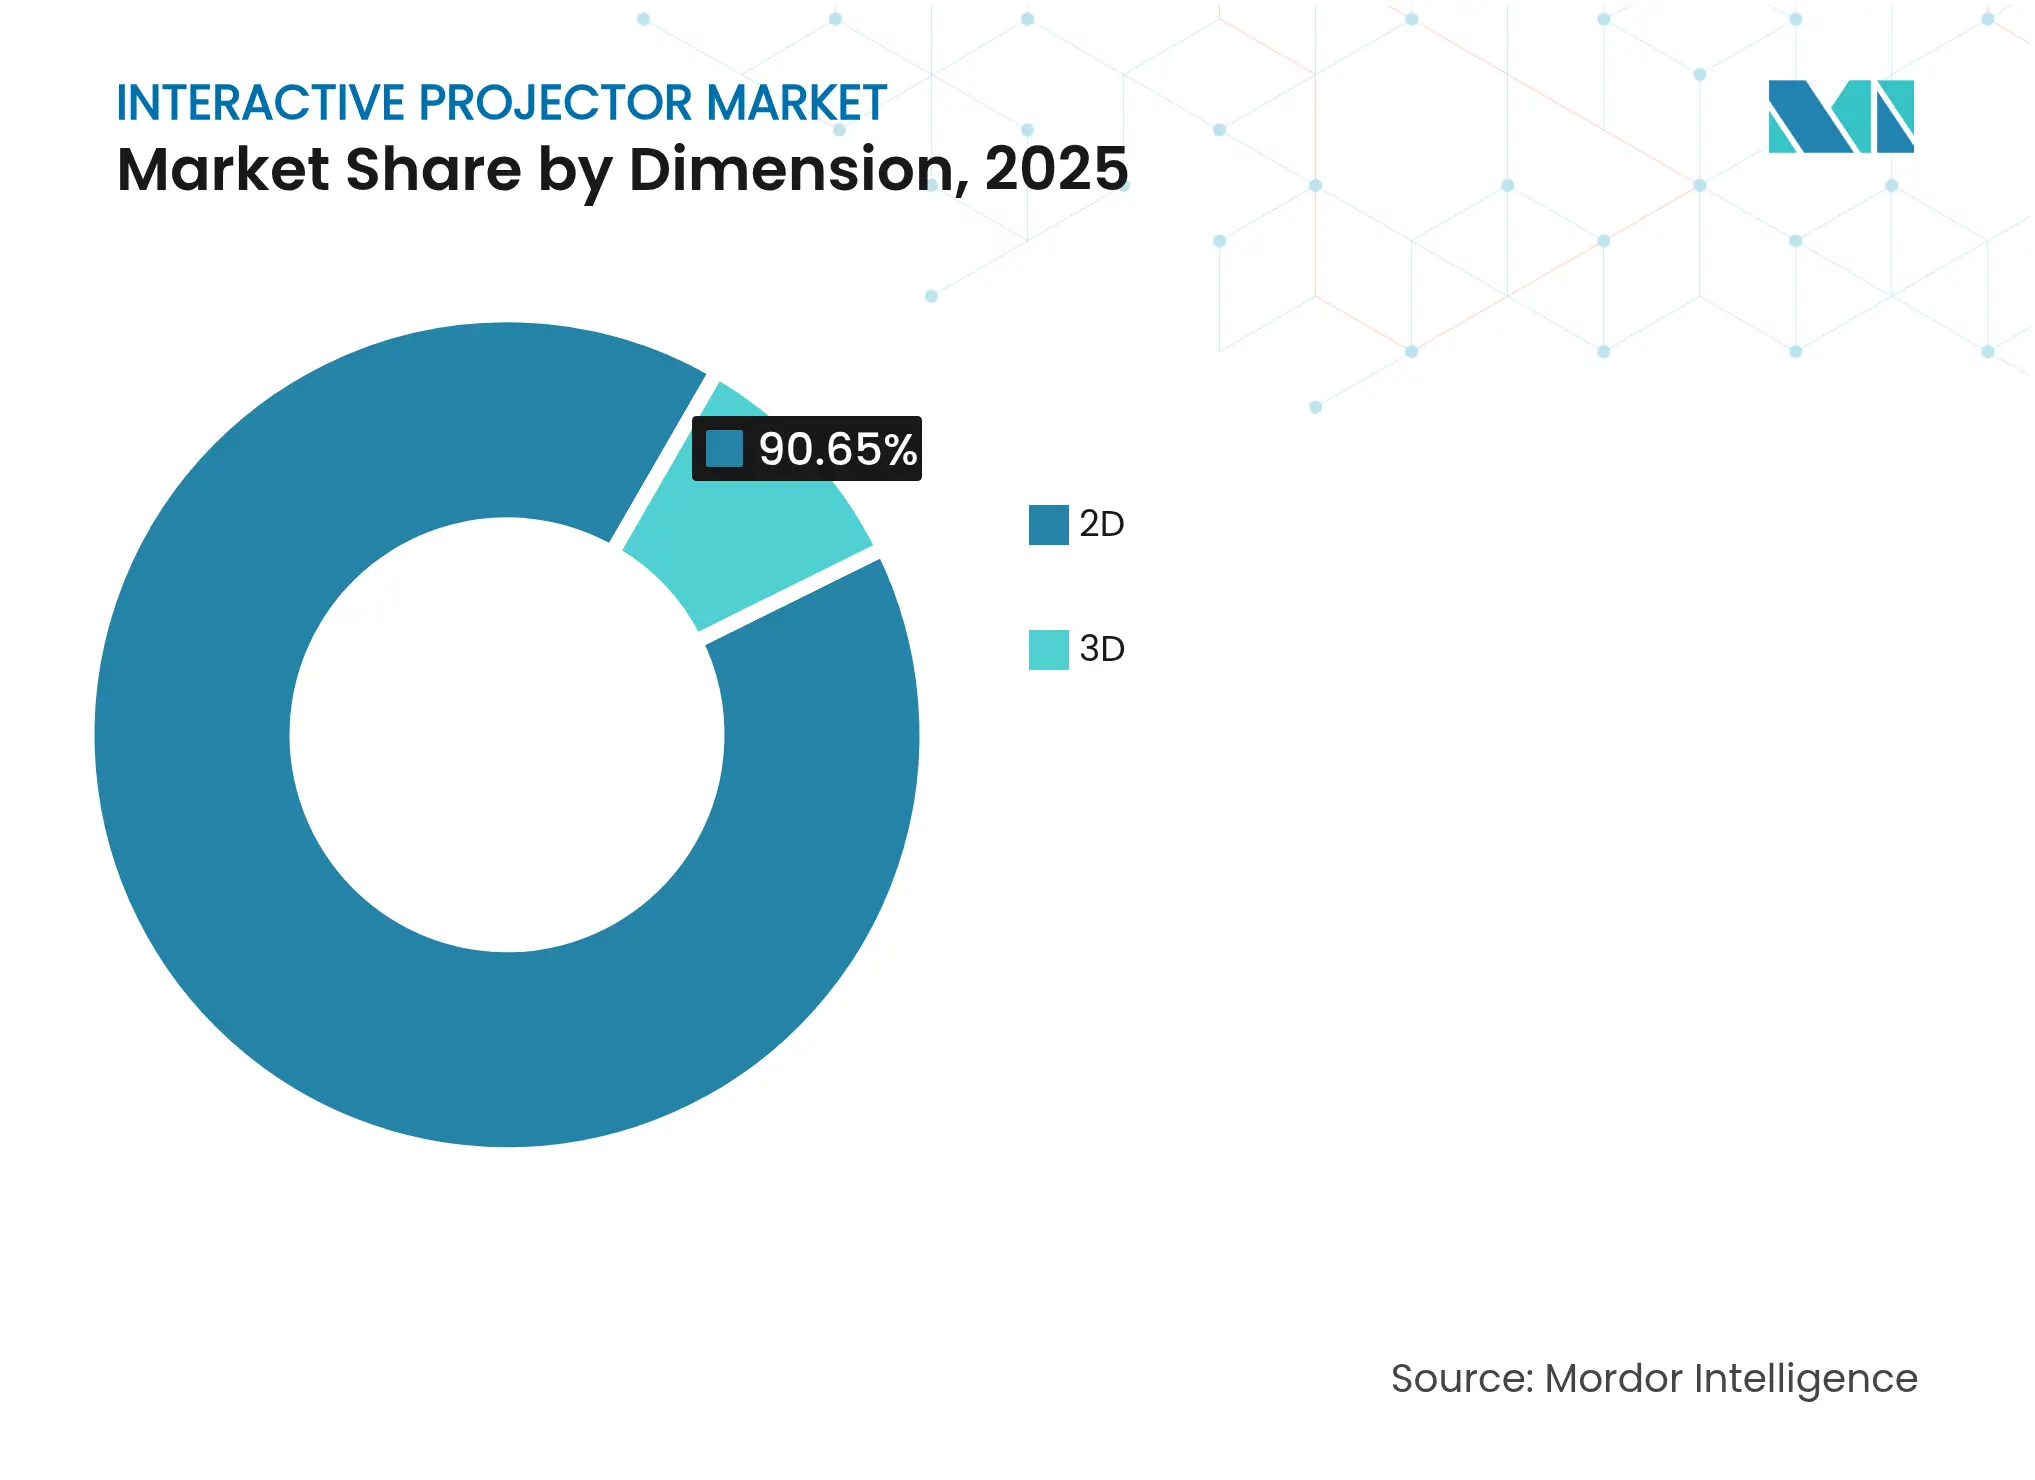
Two-dimensional models kept 90.65% of the interactive projector market in 2025. They remain the default for lesson delivery and boardroom decks. The smaller 3D niche, growing at 15.2% CAGR, serves surgical planning, engineering walkthroughs and immersive safety drills. Medical schools used 3D units to visualize anatomy, lifting skill-retention rates in pilot studies. As specialized content libraries expand, 3D demand grows but stays constrained by creation complexity and higher ticket prices.
Educators in architecture leverage 3D models for live design critiques, while manufacturers employ them for assembly training. Content authoring firms now produce turnkey 3D lesson kits, lowering entry barriers. Still, mainstream classrooms continue to favor affordable 2D sets, keeping 3D a high-value adjunct rather than a mass-market default.
Note: Segment shares of all individual segments available upon report purchase
By Technology: LCoS Emerges as Premium Solution
3LCD retained 56.02% share by providing balanced brightness and cost. DLP appealed to corporates seeking compact chassis and high contrast. LCoS, though smaller today, posts a 15.7% CAGR into 2031. Radiology departments and graphic studios specify LCoS for pixel-density and color-fidelity advantages. Falling panel costs and higher ASP headroom entice suppliers to expand LCoS lines.
Institutions running medical imaging or critical color work migrate to LCoS even at 20-30% price premiums. Meanwhile, K-12 districts remain loyal to 3LCD given budget strictures and simpler maintenance. The interactive projector market size for LCoS units is projected to triple by 2030, yet 3LCD’s installed base keeps overall dominance intact.
By Projection Distance: Ultra-Short-Throw Dominance
Ultra-short-throw captured 66.05% share of the interactive projector market size in 2025. The ability to throw 100-inch images from 30 cm eliminates presenter shadows and fits tight classrooms. CES 2025 prototypes delivered 5,000-lumen 4K output in low-profile housings, widening applicability. Short-throw models gain in seminar rooms that need some distance flexibility, booking a 14.95% CAGR.
UST buyers value easier cabling, lower installation labor and safer eye protection. Lamp UST SKUs still ship into budget-capped districts, while mid-tier institutions shift to laser UST to curb bulb swaps. Standard-throw remains for halls and auditoriums where throw distance is available and screen size must exceed 200 inches.

Recognized by Experts. Trusted by Leaders.
A trusted intelligence partner to global decision-makers across 90+ countries.


By Light Source: Laser Technology Acceleration
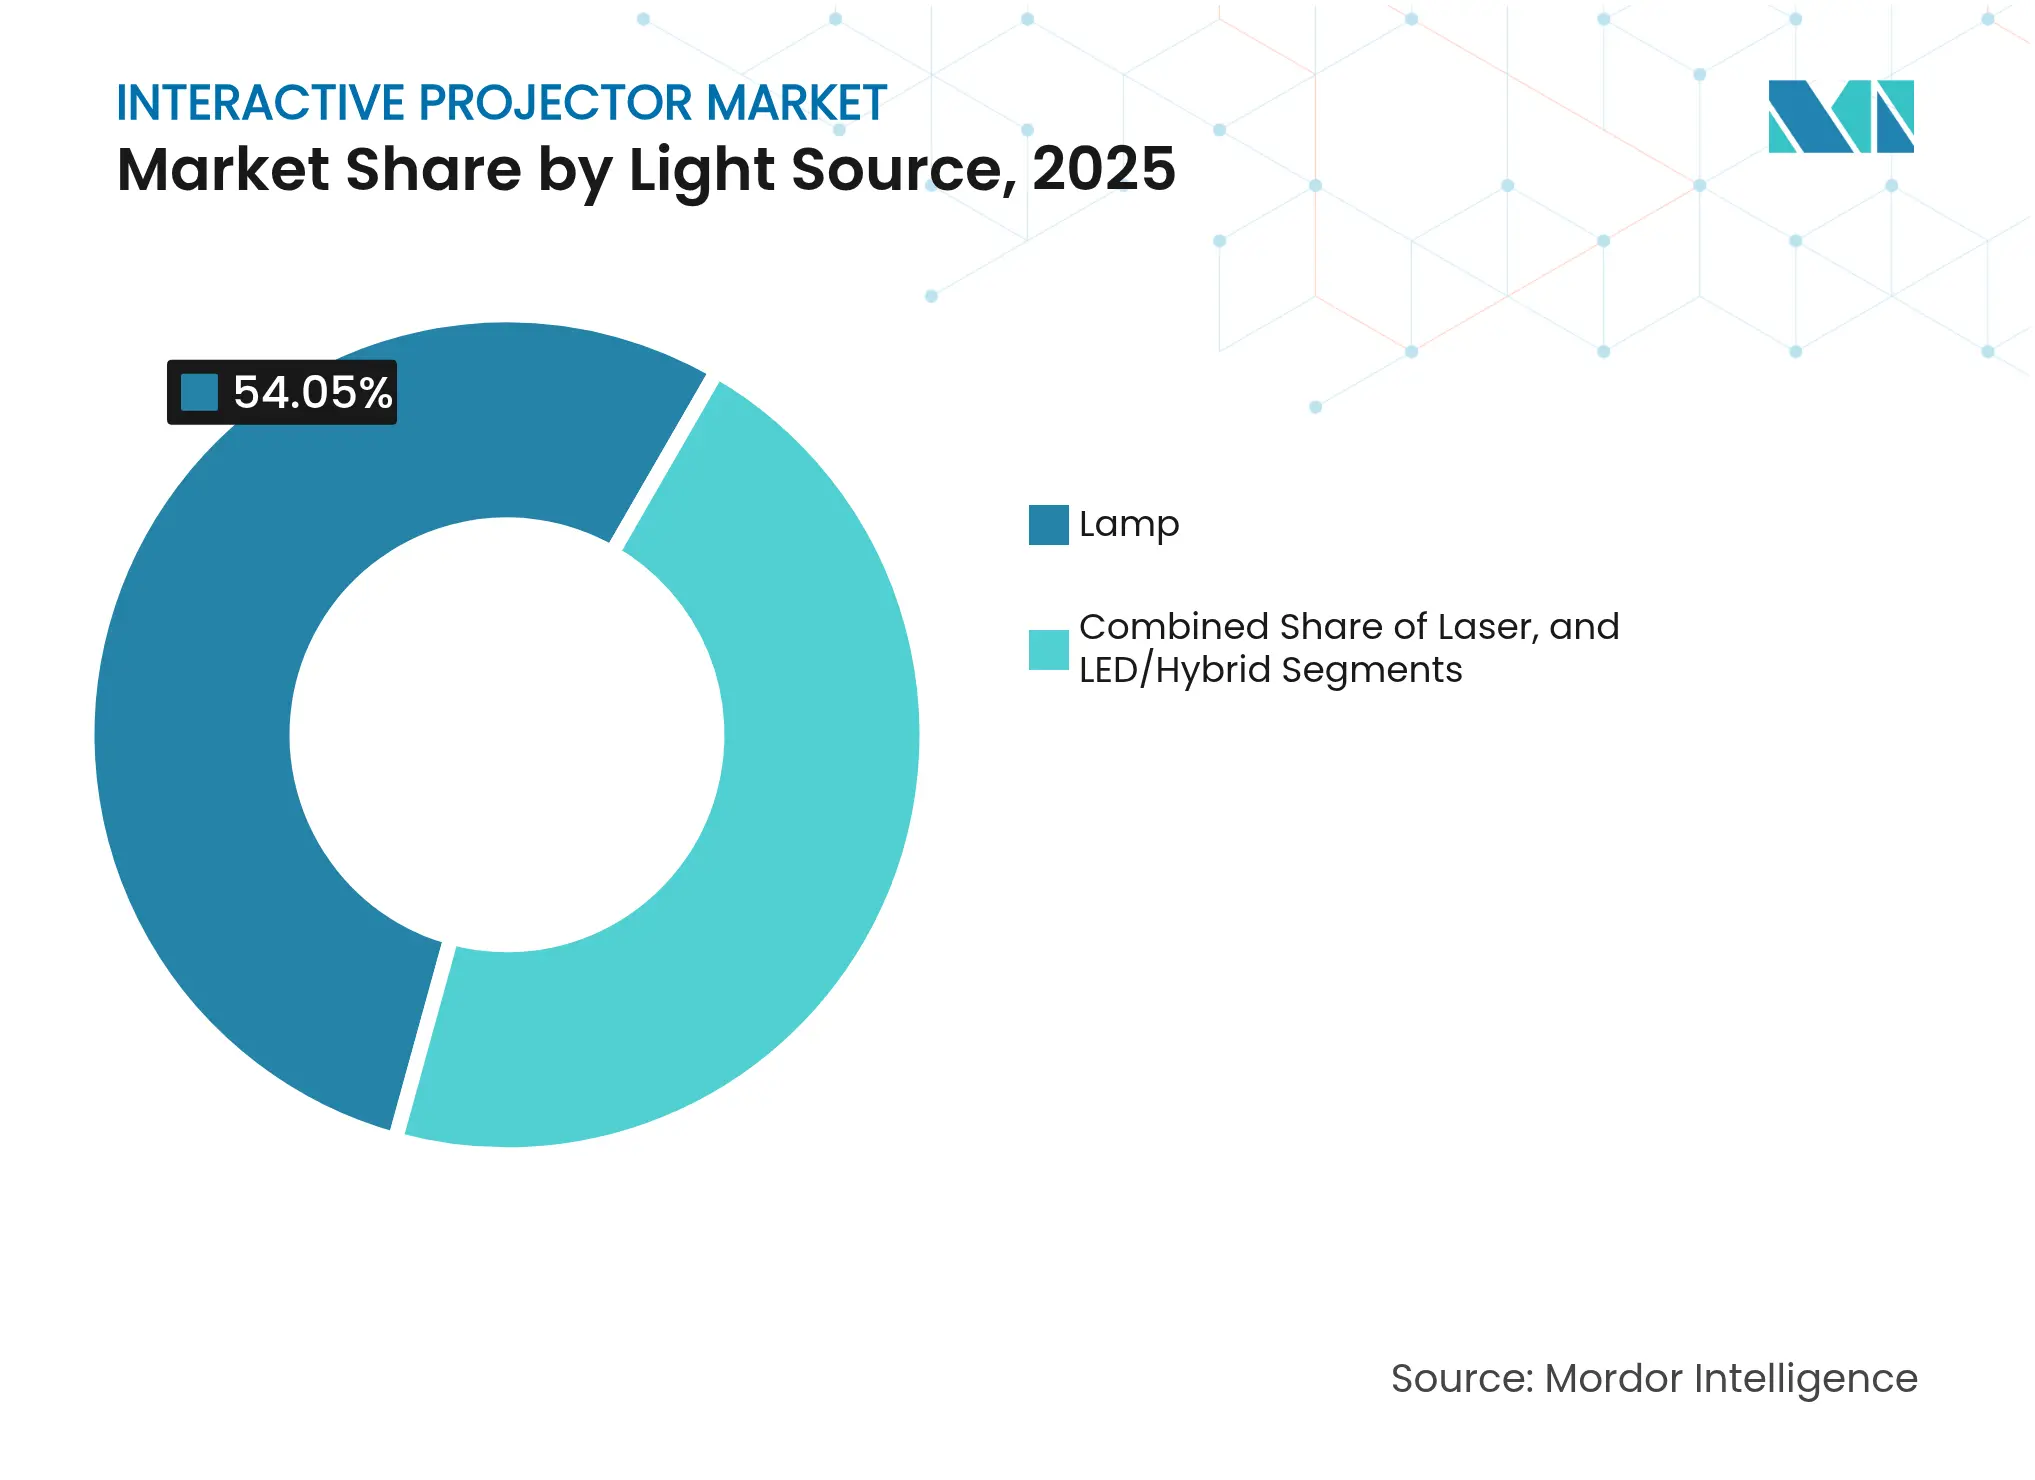
Lamp systems kept 54.05% share in 2025 due to sub-USD 700 entry packs. However, laser projectors are growing 17.1% per year as diode costs fall and lamps incur rising replacement fees. Buyers prioritize uptime and brightness consistency; a single failed lamp can derail class schedules. The interactive projector market sees LED/hybrid adoption as a mid-stepping stone, yet the long-run endpoint is solid-state.
Hospitals, design studios and national libraries migrated first because downtime costs outweigh capex. Emerging-market universities still deploy lamps but budget for laser in future stages. Component vendors forecast parity pricing with lamps by 2028, at which point the restraint tied to high TCO will fade.
Note: Segment shares of all individual segments available upon report purchase
By Resolution: 4K Drives Premium Growth
WXGA and below held 48.05% in 2025; they remain adequate for text-heavy curricula. Yet 4K shipments rise 17.6% per year. Consumers accustomed to UHD screens expect similar clarity in lecture halls. Healthcare and engineering use cases require fine detail, pushing 4K adoption. The interactive projector market size for 4K units is on pace to surpass USD 1.68 billion by 2031 beside a 22.9% revenue CAGR.
Full HD remains the workhorse for corporate spaces where price sensitivity still exists. Vendors push firmware upscaling to bridge the gap for existing content until native 4K lesson libraries mature.
By Connectivity: Wireless Integration Accelerates
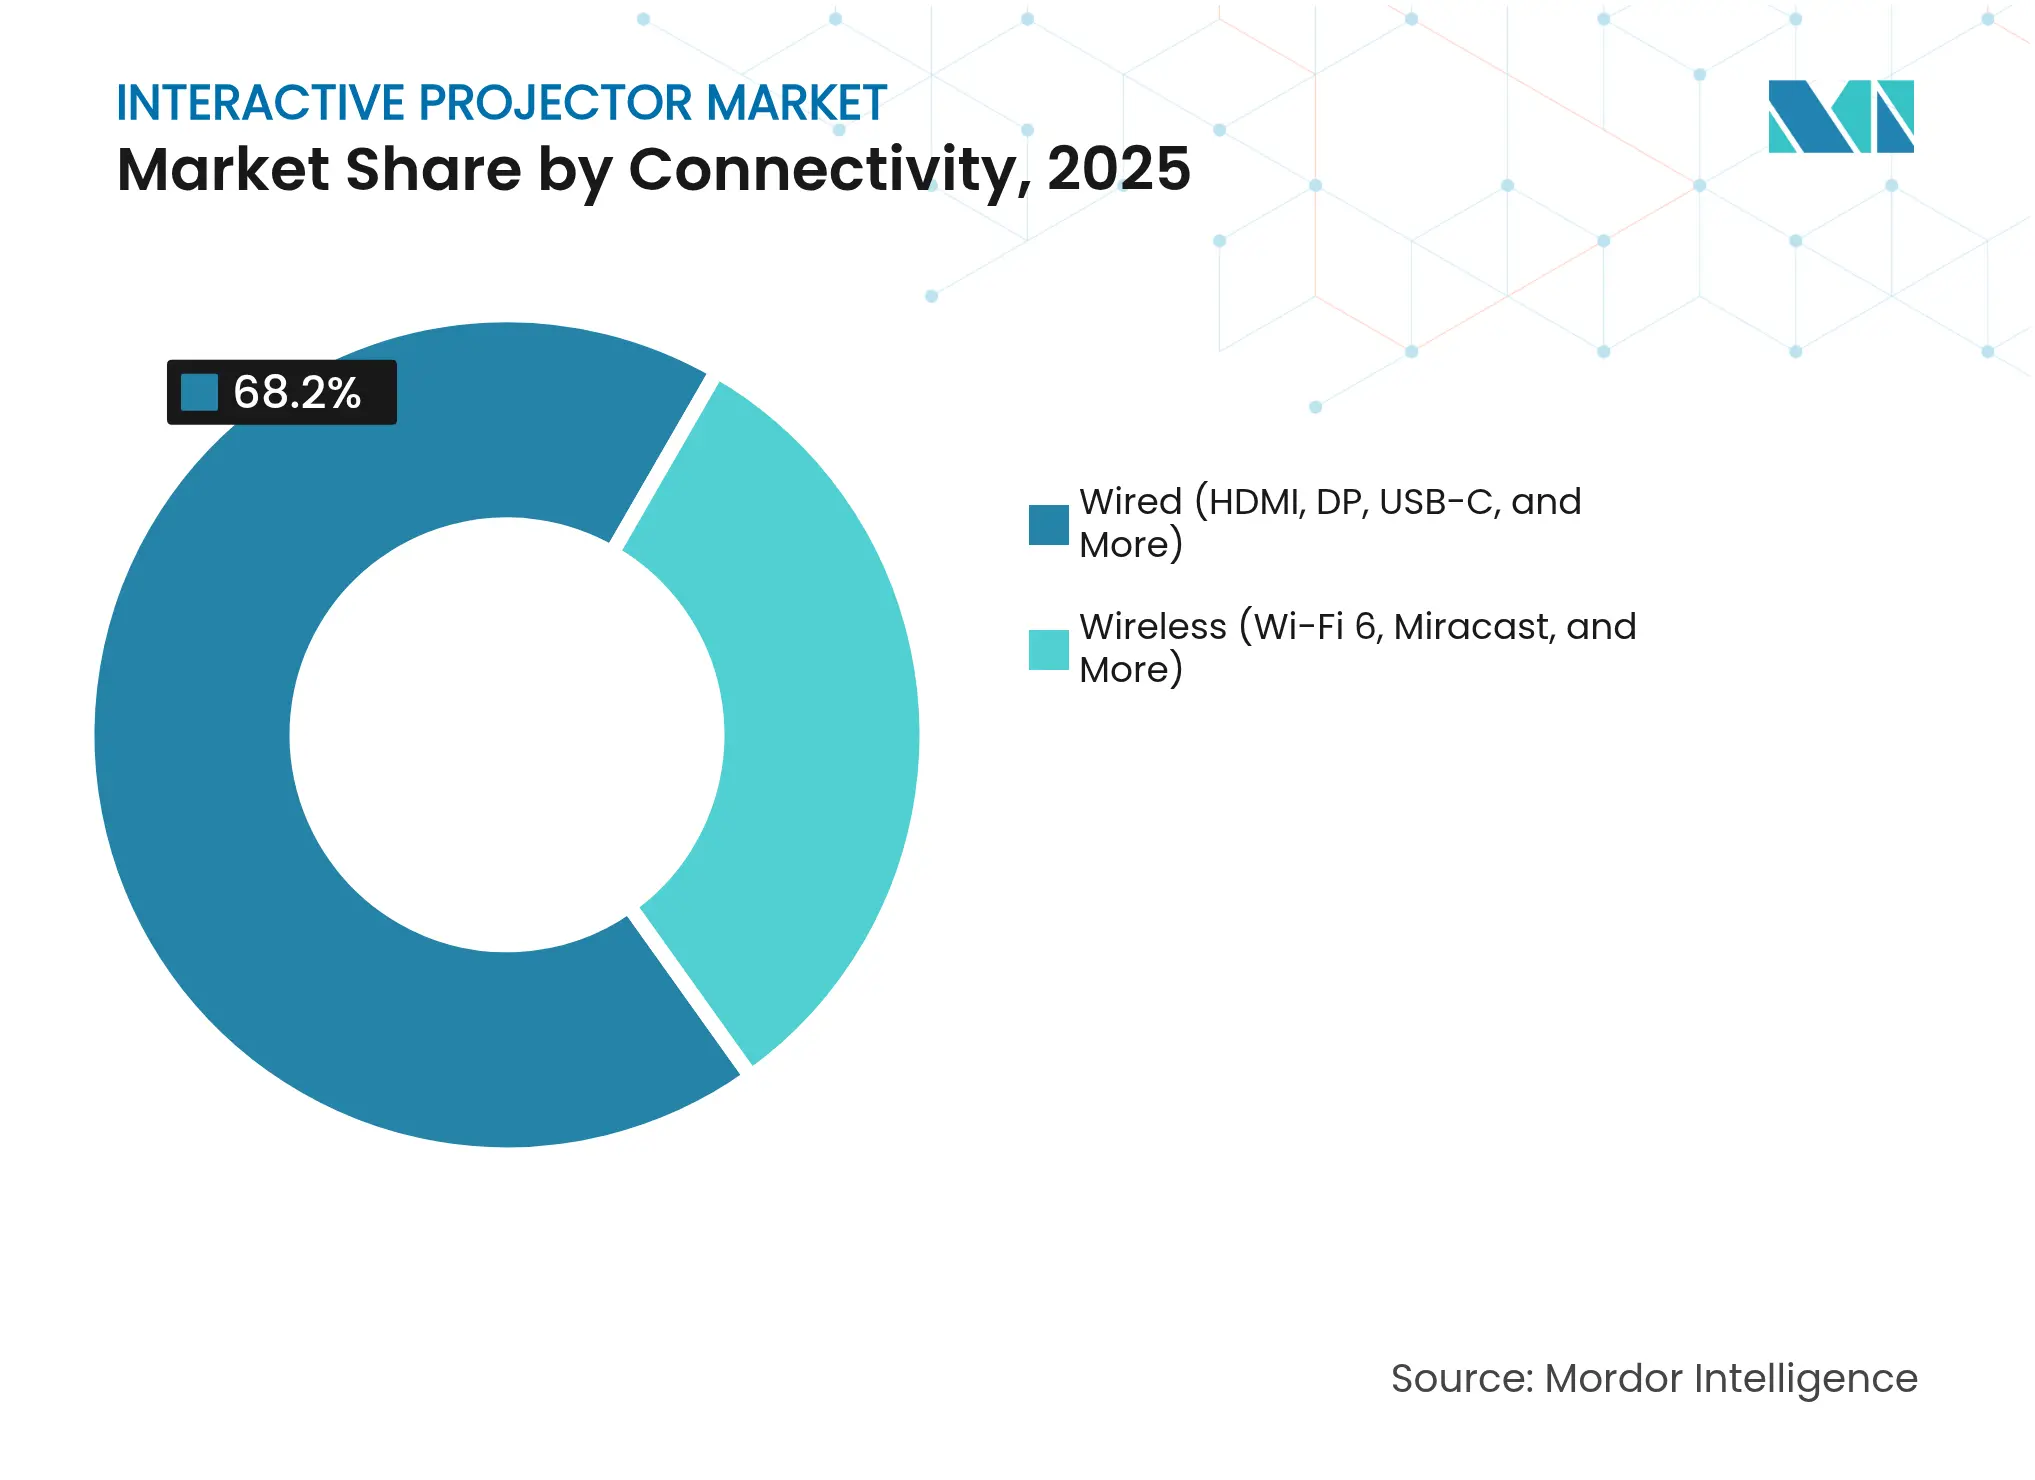
Hardwired HDMI and USB-C ports still anchor 68.20% of shipments. Reliability and low latency suit exam invigilation and legal proceedings. Yet wireless-enabled models advance 15.95% CAGR. Wi-Fi 6 speeds and security protocols meet enterprise standards, letting employees cast from any laptop or phone within seconds.
Schools adopt wireless to support student devices without cable swaps, cutting downtime between classes. Vendors bundle proprietary dongles that auto-pair, raising accessory revenue. Wired ports remain essential backups, preserving compatibility with legacy PCs and document cameras.
Note: Segment shares of all individual segments available upon report purchase
By Application: Healthcare Emerges as Growth Leader
Education kept 45.60% segment share in 2025. District refresh funding and curriculum digitization underpin volume. Corporate training follows as firms standardize hybrid meeting rooms. Healthcare, however, records the fastest 15.65% CAGR. Anatomy visualization, operating-theatre simulations and patient consulting require high-resolution, color-accurate, touch-driven displays. Interactive projection brings group visibility that individual VR headsets lack, improving collaboration.
Retail and hospitality roll out gesture-responsive floor projections that boost dwell time. Museums use interactive walls for immersive storytelling. These emerging verticals add diversity but remain secondary to core education revenue for most suppliers.
North America owned 38.90% of the interactive projector market share in 2025. Mature tech budgets and hybrid learning norms spur premium adoption. Yet macro headwinds, evidenced by Epson’s revenue slide, introduce caution in 2025 projections. Larger school districts proceed with multi-year UST rollouts, while smaller ones defer upgrades. Corporate refresh momentum persists as human-capital strategies emphasize continuous learning.
Europe ranks second and shows steady replacement demand. Germany prioritizes smart factories, embedding projectors in technical training centers. Legacy building dimensions and daylight exposure complicate retrofits, keeping integrator revenues elevated. UK universities channel research grants into immersive labs, sustaining mid-level volume. EU energy-efficiency rules accelerate the pivot to laser light sources.
Asia-Pacific is the growth engine at 15.05% CAGR. India’s electronics incentive boosts domestic supply chains, trimming lead times and prices. China’s curriculum reforms mandate interactive display ratios per classroom, stimulating bulk tenders. Japan and South Korea adopt LCoS for advanced manufacturing R&D centers. Saudi Arabia spearheads Middle East demand via Vision 2030 digital campuses. ASEAN airports deploy immersive signage that ups the vertical diversification of the interactive projector market.
Market Concentration
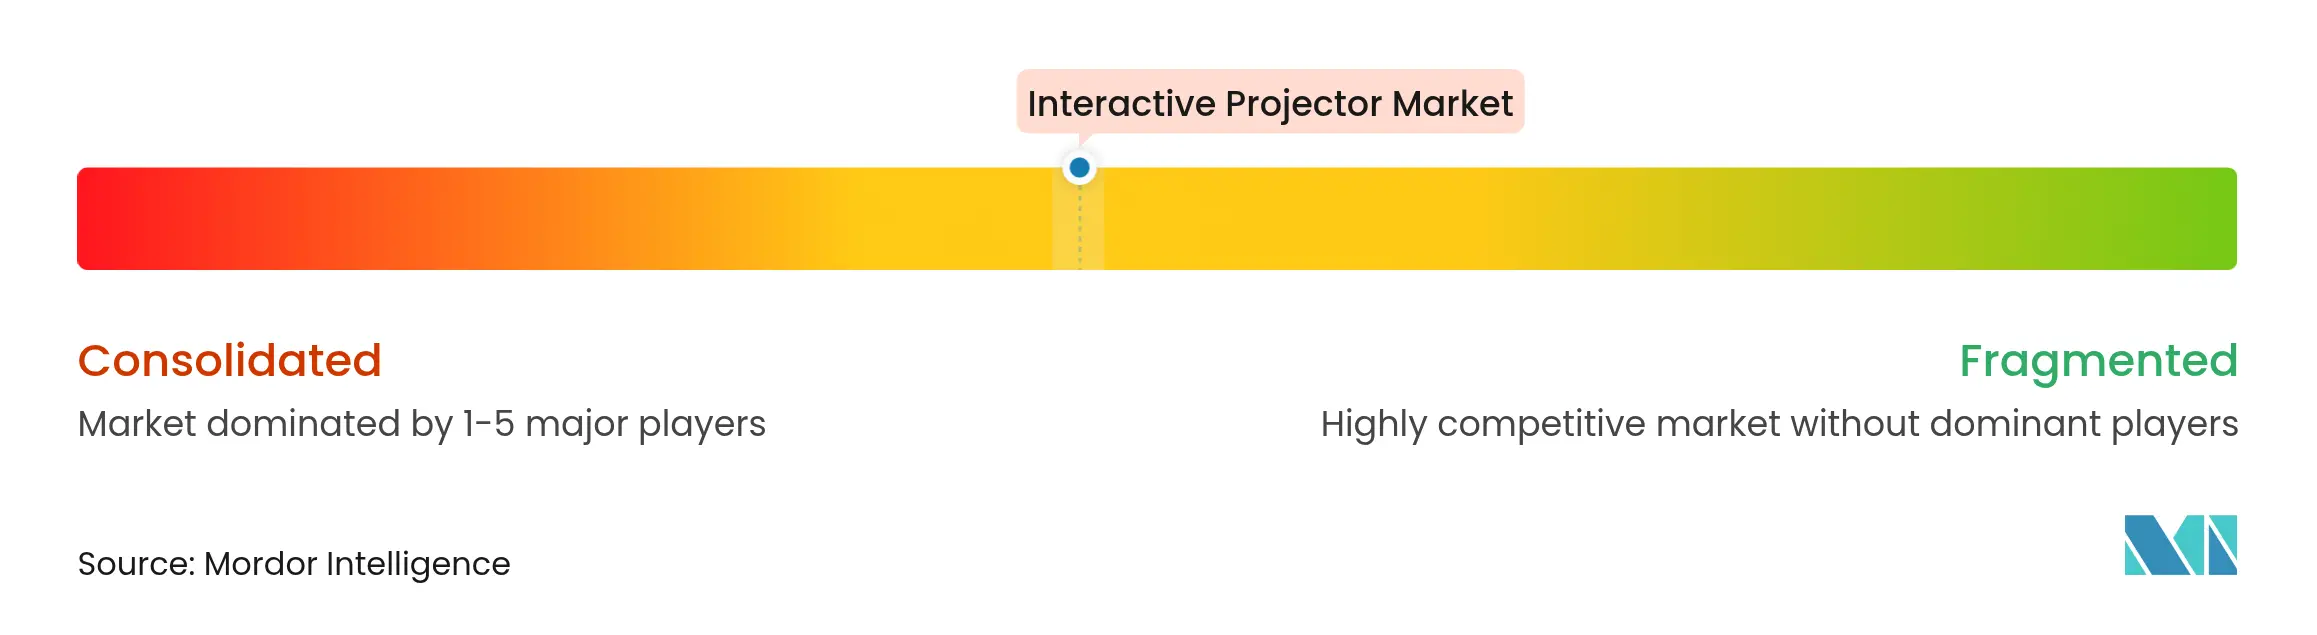
The interactive projector industry remains moderate fragmentation. Epson, BenQ and Dell together control just over 40% revenue, leveraging brand reputation, channel depth and proprietary software. Panasonic restructured, selling 80% of its projector unit to ORIX to fund supply-chain software expansion. The move signals hardware margin compression and a shift to solution-centric strategies.
Hisense, Samsung and LG entered premium UST segments showcased at CES 2025, integrating AI upscaling and wireless hubs. New Chinese entrants exploit economies of scale in diode manufacturing to undercut incumbents. Software stack integration-whiteboarding apps, cloud collaboration and analytics-emerges as the main differentiator rather than raw ANSI lumen counts.
Vendor alliances with ed-tech and conferencing platforms deepen ecosystem lock-in, raising switching costs. Component suppliers pursue miniaturized laser engines and higher refresh controllers to serve VR-aligned use cases, enabling niche specialists to disrupt high-performance tiers. Overall, competitive pressure shifts from price wars to bundled value proposition.

*Disclaimer: Major Players sorted in no particular order
1. INTRODUCTION
2. RESEARCH METHODOLOGY
3. EXECUTIVE SUMMARY
4. MARKET LANDSCAPE
5. MARKET SIZE AND GROWTH FORECASTS (VALUES)
6. COMPETITIVE LANDSCAPE
7. MARKET OPPORTUNITIES AND FUTURE OUTLOOK
Interactive projector is defined as a device that turns any surface into an interactive whiteboard which can be used through bare fingers touching or its interactive pens. Interactive projectors are generally ultra-short throw projectors with projection mapping.
The interactive projector market is segmented by dimension (2D, 3D), by display type (LCoS, DLP, LCD), by end-user (media and entertainment, healthcare, education, tourism and hospitality, other end-users), by geography (North America, Europe, Asia-Pacific, Latin America, Middle East and Africa). The market sizes and forecasts are provided in terms of value (USD) for all the above segments.
Pricing Strategy for Semiconductor Components
3 Min Read
Accelerating Additive Manufacturing Adoption in India
3 Min Read
Feasibility Analysis for FBO Services in East Africa
3 Min Read
When decisions matter, industry leaders turn to our analysts. Let’s talk.