Projector Market Size and Share
Market Overview
| Study Period | 2020 - 2031 |
|---|---|
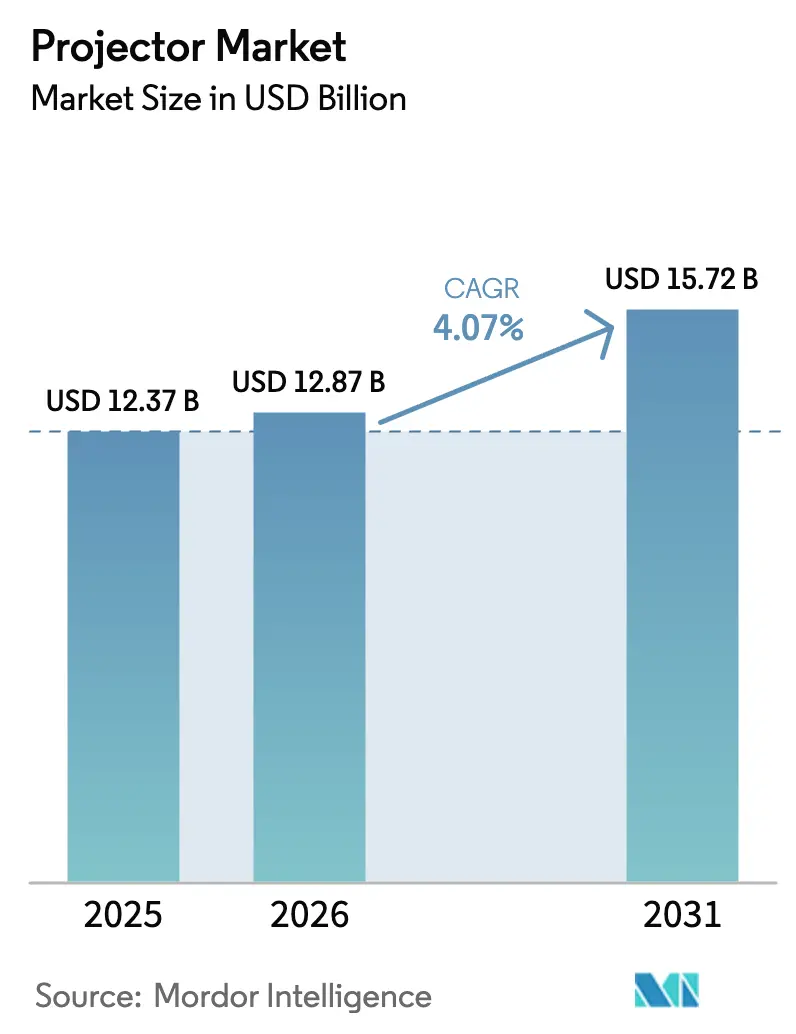
| Market Size (2026) | USD 12.87 Billion |
| Market Size (2031) | USD 15.72 Billion |
| Growth Rate (2026 - 2031) | 4.07% CAGR |
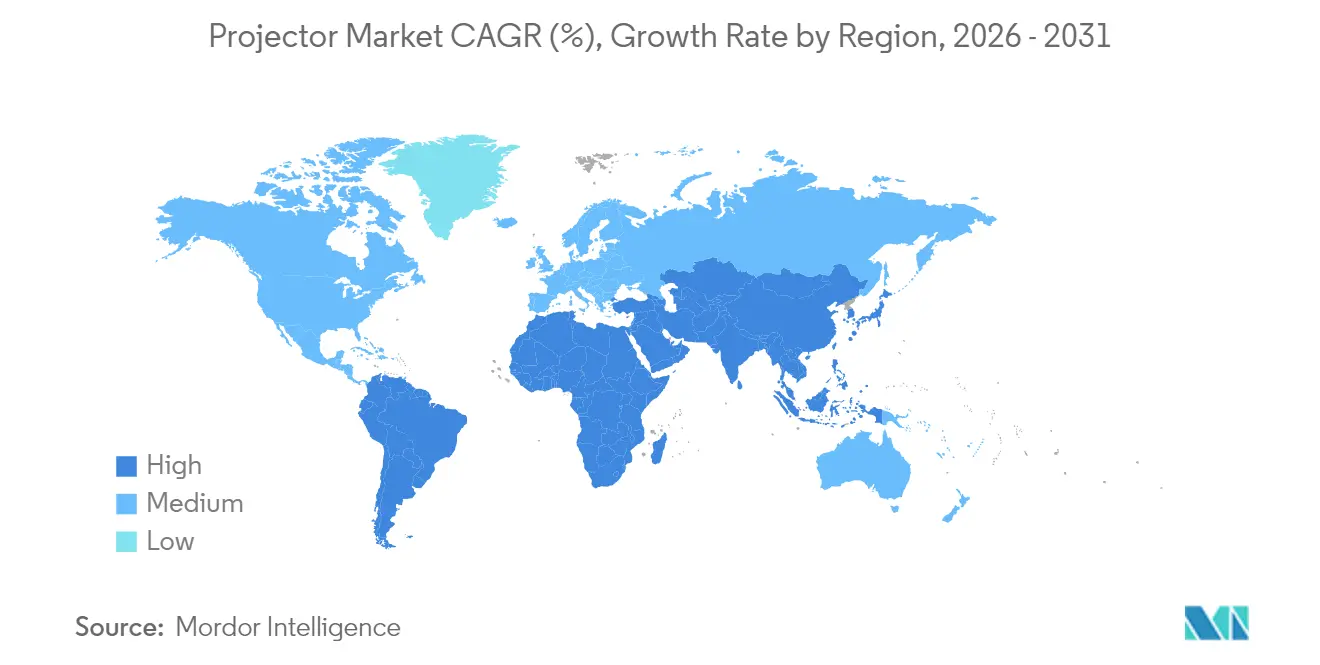
| Fastest Growing Market | Middle East and Africa |
| Largest Market | Asia Pacific |
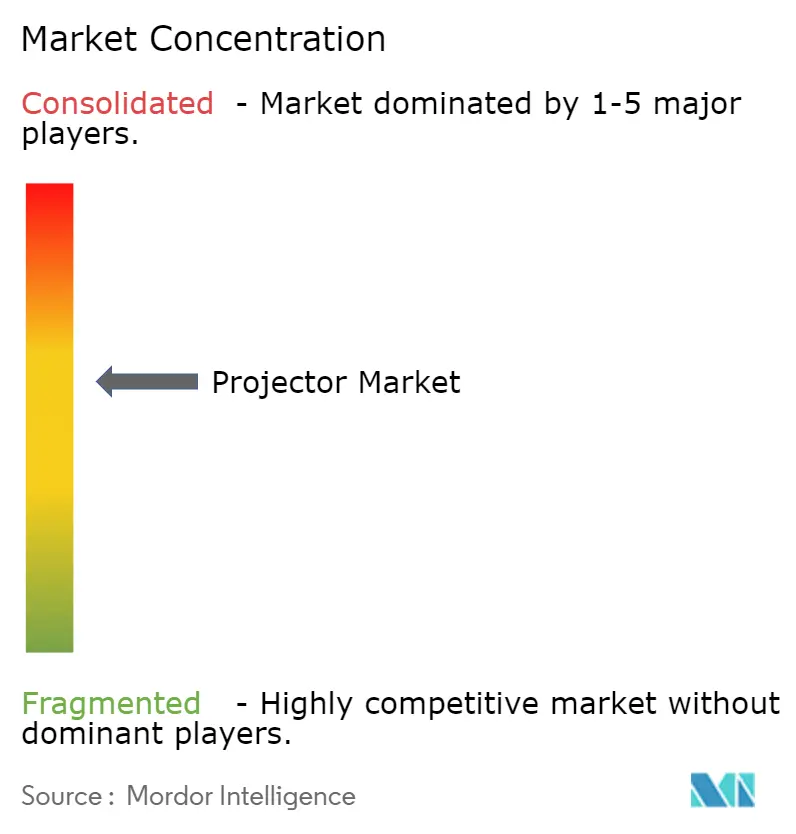
| Market Concentration | Medium |
Major Players *Disclaimer: Major Players sorted in no particular order Image © Mordor Intelligence. Reuse requires attribution under CC BY 4.0. | |
Projector Market Analysis by Mordor Intelligence
The Projector Market size was valued at USD 12.37 billion in 2025 and estimated to grow from USD 12.87 billion in 2026 to reach USD 15.72 billion by 2031, at a CAGR of 4.07% during the forecast period (2026-2031). Solid-state illumination now sets the competitive tempo as regulatory bans on mercury lamps converge with corporate demand for low-maintenance devices. Asia-Pacific manufacturers leverage cost advantages and vertical supply chains, while European firms accelerate laser roll-outs to comply with the 2026 EU mandate. Government digital-classroom programs, the rise of ultra-short-throw solutions for hybrid offices, and immersive projection-mapping attractions continue to steer purchasing priorities. At the same time, large-format LED walls and DLP chipset shortages temper growth momentum.
Key Report Takeaways
- By light source, lamp-based systems held 55.48% of projector market share in 2025, yet RGB pure-laser units are advancing at a 8.88% CAGR through 2031.
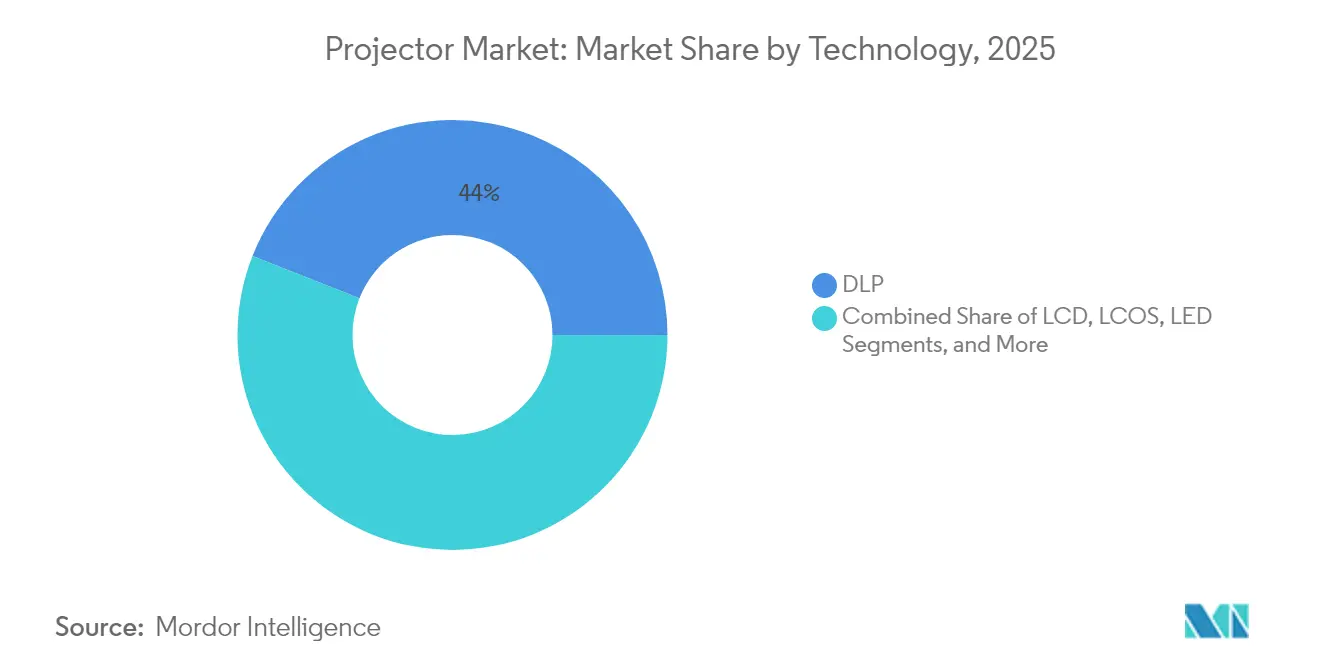
- By technology, DLP captured 44.02% revenue share in 2025; LED is projected to expand at a 9.78% CAGR to 2031.
- By resolution, WXGA dominated with 33.28% share in 2025, whereas 4K-and-above projectors are advancing at a 6.74% CAGR through 2031.
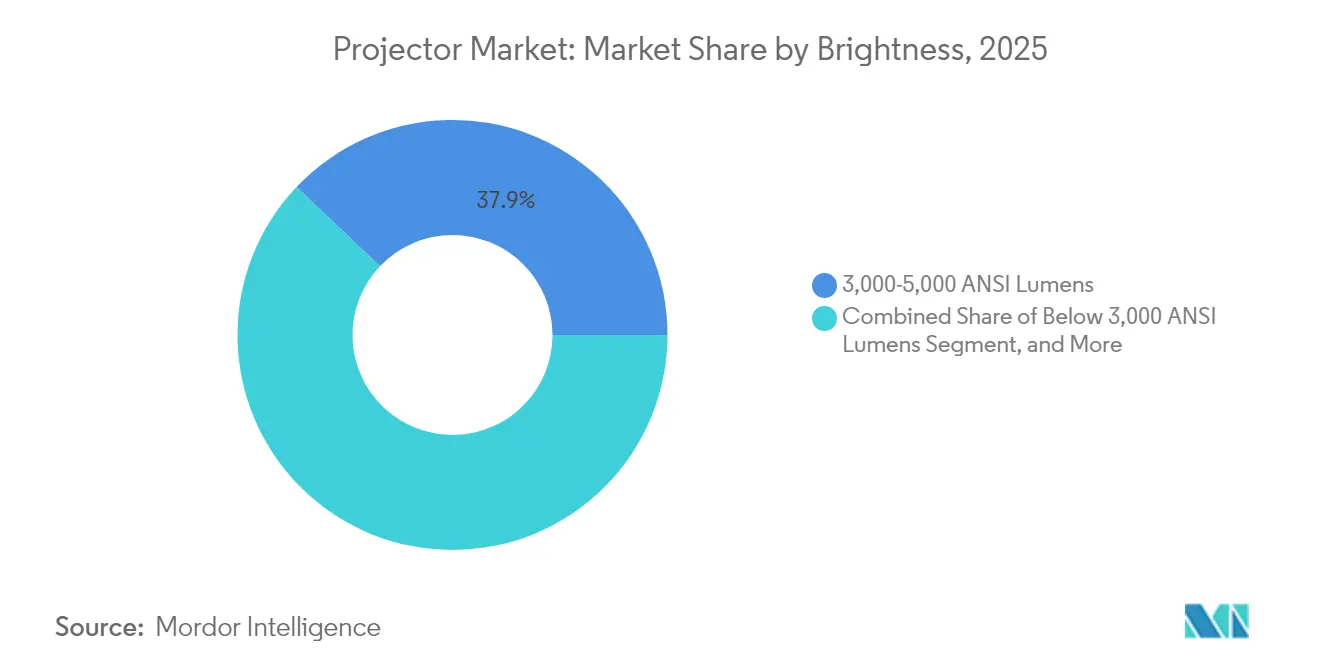
- By brightness, the 3,000-5,000-lumen band commanded 37.92% share in 2025, while sub-3,000-lumen units are growing fastest at an 7.78% CAGR to 2031.
- By form factor, standard-throw projectors led with 45.63% share in 2025; ultra-short-throw models are projected to climb at a 5.56% CAGR through 2031.
- By application, education and government accounted for 31.12% of the projector market size in 2025, while home entertainment and cinema is tracking a 6.05% CAGR through 2031.
- By geography, Asia-Pacific led with 43.35% revenue share in 2025; the Middle East and Africa is the fastest-growing region at 5.08% CAGR to 2031.
Note: Market size and forecast figures in this report are generated using Mordor Intelligence’s proprietary estimation framework, updated with the latest available data and insights as of 2026.
Global Projector Market Trends and Insights
Drivers Impact Analysis*
| Driver | (~) % Impact on CAGR Forecast | Geographic Relevance | Impact Timeline |
|---|---|---|---|
| Government-funded smart-classroom roll-outs | +0.8% | India, GCC, ASEAN | Medium term (2-4 years) |
| Ultra-short-throw laser adoption for hybrid work | +1.2% | North America, Europe | Short term (≤ 2 years) |
| Immersive projection-mapping in Asian theme parks | +0.4% | Asia-Pacific, global spillover | Long term (≥ 4 years) |
| Rapid shift to 4K/8K home-cinema units | +0.6% | China, South Korea, wider APAC | Medium term (2-4 years) |
| Interactive touch-enabled K-12 projection | +0.5% | Global, early in developed markets | Medium term (2-4 years) |
| Lower TCO of laser/LED light sources | +0.9% | Global | Short term (≤ 2 years) |
| Source: Mordor Intelligence | |||
Government-funded smart-classroom roll-outs drive institutional demand
India’s Rs 76,000 crore Semicon India programme, approved in April 2025, earmarks fiscal support for domestic display fabs that supply critical projector components.[1]Press Information Bureau, “Government of India Spurs Chip Manufacturing…,” pib.gov.in The United Arab Emirate’s USD 2.7 billion digital-education budget in 2024 demonstrated how Gulf governments treat projection as core hybrid-learning infrastructure. These publicly funded procurements create predictable, multi-year refresh cycles that reward vendors able to satisfy local assembly clauses and warranty mandates. They also accelerate specification upgrades-interactive touch, wide-color-gamut laser, and network management-because institutions procure in bulk rather than piecemeal. Consequently, the projector market benefits from stable education demand even when corporate spending moderates.
Accelerating adoption of ultra-short-throw laser projectors for hybrid workplaces
Post-pandemic floor-plan reductions made long-throw installations unworkable, prompting facilities teams to embrace ultra-short-throw units that cast 100-inch images from under 30 cm. Sharp/NEC reports laser lifespans exceeding 20,000 hours, erasing lamp-replacement downtime and lowering service costs.[2]Sharp/NEC, “Laser Projectors,” sharpnecdisplays.eu Texas Instruments’ DLPC8445 controller further tailors hardware to video-conferencing needs with 240 Hz frame rates and sub-millisecond latency.[3]Texas Instruments, “Smallest-ever TI DLP display controller…,” ti.com As enterprises upscale collaboration suites, willingness to pay a premium for space-efficient, maintenance-free projection strengthens the near-term growth outlook for the projector market.
Expansion of immersive projection-mapping attractions across Asian theme parks
Christie Digital’s multi-projector blend at Taiwan’s Xpark Aquarium in 2024 illustrated how high-brightness RGB units can transform walls and floors into dynamic storytelling canvases.[4]Christie Digital, “Newsroom,” christiedigital.com Theme-park operators favor projectors over LED walls for temporary show scenes because rigs weigh less, install faster, and adapt content assets more flexibly. As visiting audiences seek Instagram-ready experiences, park owners budget for periodic pixel-density upgrades that sustain repeat purchases. Demand then spreads to live concerts, museums, and flagship retail stores, extending the projector market’s reach beyond legacy cinema.
Rapid consumer shift to 4K/8K home-cinema projectors in China and South Korea
South Korea recorded a 300 billion won (USD 255.8 million) projector sector in 2024, with households accounting for 20% of unit sales against a 5% global average. Brands such as LG and XGIMI package voice control, IMAX-enhanced streaming, and DTS audio to position projectors as lifestyle products rather than AV peripherals. Enthusiast gamers chase 240 Hz 4K modes that flat panels seldom reach at comparable sizes, bolstering premium sell-through. This consumer-led surge widens the projector market’s addressable base beyond education and enterprise contracts.
Restraints Impact Analysis*
| Restraint | (~) % Impact on CAGR Forecast | Geographic Relevance | Impact Timeline |
|---|---|---|---|
| Large-format LED walls cannibalising venue demand | -1.1% | Global, strongest in North America & Europe | Short term (≤ 2 years) |
| DLP DMD chipset shortages | -0.7% | Global, acute in Asian fabs | Medium term (2-4 years) |
| Margin compression from aggressive ASP decline | -0.5% | Global, heavier in consumer lines | Short term (≤ 2 years) |
| EU RoHS mercury-lamp restrictions | -0.3% | Europe, global supply spillover | Short term (≤ 2 years) |
| Source: Mordor Intelligence | |||
Proliferation of large-format LED video walls cannibalising projector demand
Falling LED cost per pixel lures stadiums and convention centers toward seamless direct-view alternatives that outperform projection in uncontrolled lighting. Operators value the bezel-free visuals and 24/7 uptime, undermining renewal orders for 10,000-lumen projectors that once dominated these venues. As integrators standardize LED calibration software, the transition accelerates, shaving 1.1 percentage points from the projector market’s forecast CAGR.
Supply-chain shortages of DLP DMD chipsets creating production bottlenecks
Texas Instruments remains the sole volume source for advanced 0.47-inch and 0.66-inch 4K DMDs, so when semiconductor lead times stretched to 40 weeks in late 2024, OEMs missed peak season launches. Smaller brands pivoted to LCD engines but faced brightness compromises, while established vendors prioritized margin-rich models, limiting breadth of entry-level assortments. Production volatility, therefore, trims near-term unit shipments and complicates channel inventory planning.
*Our forecasts treat driver/restraint impacts as directional, not additive. The impact forecasts reflect baseline growth, mix effects, and variable interactions.
Segment Analysis
By Technology: LED acceleration challenges entrenched DLP leadership
DLP technology secured 44.02% revenue share in 2025 owing to brightness efficiency and reliability in professional venues. Nevertheless, LED projectors post a 9.78% CAGR through 2031 as enterprises and educators pursue mercury-free compliance and 30,000-hour duty cycles. The projector market responds with slimmer chassis enabled by Texas Instruments’ 90% size-reduced DLPC8445 driver that fits compact 4K housings.
LCD engines remain cost-efficient for sub-5,000-lumen classrooms, whereas LCOS entices premium home-cinema buyers chasing deep black levels. Vendors differentiate via proprietary color algorithms, edge-blending, and low-input-lag firmware, ensuring no single technology monopolizes upcoming bids. The resulting product stratification broadens the projector market’s appeal across price tiers while sustaining competitive experimentation.


By Light Source: Solid-state transition gains irreversible momentum
Lamp-based systems still accounted for the majority of shipments, yet the RGB pure-laser category is advancing at a 8.88% CAGR as theater chains and museums upgrade to wide-gamut output. The upcoming EU mercury ban has already triggered corporate purchasing moratoriums on replacement lamps, shifting tender specifications toward laser-phosphor modules that trim service calls. As a result, the projector market size tied to solid-state engines is climbing faster than total industry value.
LED hybrids dominate pico and ultra-portable models, where low heat and instant on/off outweigh absolute brightness. Across all tiers, steady lumen maintenance and 20,000-hour warranties attract finance teams seeking lower lifecycle cost, further compressing the addressable pool for lamp replacements.
By Resolution: 4K surge influences gaming and cinema workflows
WXGA led units at 33.28% share in 2025 because schools and SMEs prize affordability over pixel density. Yet the 4K-and-above tranche grows 6.74% annually to 2031 as streamers release HDR content and esports organizers demand 240 Hz projection. For the projector market, higher resolution translates into ASP uplift that partly offsets volume pressure elsewhere.
1080p remains the migration path for users upgrading from 4:3 legacy gear, and XGA clings to price-sensitive geographies. Vendors emphasize chipset-level upscaling and low-latency processing so gamers perceive minimal difference between 4K projectors and high-refresh LCD monitors. This resolution ladder ensures buyers can scale budgets without exiting the projector market.
By Brightness: Portable low-lumen category picks up speed
The <3,000-lumen bracket delivers an 7.78% CAGR to 2031, powered by battery-enabled lifestyle models targeting Netflix-on-the-balcony use cases. Meanwhile, the 3,000-5,000 lumen band commands 37.92% share in 2025 as universities and corporates find it the sweet spot for mixed-light classrooms.
Orders for 5,001-10,000 lumen rigs cluster around auditoriums and sanctuaries where ambient light control is limited. Above 10,000 lumens, laser engines underpin enormous venue canvases and cinema auditoriums topping 70,000 lumens in specialized installs. The projector market thereby spans pocket devices and stadium-grade towers, reflecting the sector’s unique breadth.
By Form Factor: Ultra-short-throw enjoys corporate makeover
Standard-throw units retained 45.63% shipments in 2025 thanks to entrenched ceiling-mount footprints in classrooms. Ultra-short-throw, however, is set to expand 5.56% annually as hybrid offices retrofit huddle rooms without invasive construction. Laser light sources and wide-angle optics mitigate glare and shadowing, elevating productivity use cases.
Pico/portable designs capitalize on influencer culture, doubling as Bluetooth speakers and power banks. Installation and large-venue chassis aim for dual-lamp redundancy and remote lens memories, supporting staging companies that redeploy assets weekly. The projector market thus navigates between permanent installs and mobile improvisation, with each form factor aligned to specific spatial constraints.
By Application: Consumer entertainment eclipses historical anchors
Education and government contributed 31.12% of 2025 revenue on the back of multi-year digital-classroom grants. Yet home entertainment and cinema is the quickest climber at a 6.05% CAGR as buyers in China and South Korea outfit apartments with 100-inch cinematic screen. The projector market size for living-room installations has expanded accordingly, attracting lifestyle brands that bundle streaming OS, acoustic fabric grills, and décor-friendly finishes.
Corporate/business usage faces panel and LED wall competition, but remains essential for training halls that exceed 120-inch diagonal needs. Rental and staging rebounds with festivals and trade shows, while simulation harnesses low-latency 4K projectors for pilot and surgeon training. This diversity insulates the overall projector market from single-segment shocks.
Geography Analysis
Asia-Pacific led the projector market with 43.35% revenue share in 2025, powered by China’s vast manufacturing cluster and South Korea’s unusually high 20% household adoption rate. Brands such as XGIMI translated domestic volume into global competitiveness, booking CNY 3.39 billion (USD 467 million) by integrating IMAX and DTS certifications. Japan kept a technology edge through Epson’s 50-year legacy, while India’s semiconductor subsidies extend upstream gains to optical component fabs.
North America features regulatory stability that lets buyers continue lamp sourcing until asset depreciation ends, yet corporations actively pivot toward ultra-short-throw laser units to maximize remodeled spaces. United States integrators prize remote fleet-management firmware, and Canadian distributors market bilingual OS menus. Mexico’s maquiladora corridor offers tariff-free assembly routes for brands addressing NAFTA content rules, ensuring the projector market remains regionally diversified.
Europe faces the sharpest disruption, as Regulation (EU) 2023/2049 eliminates mercury lamps from January 2026. Sony exited European projector sales in March 2025, paving the way for laser-centric competitors to gain shelf space. Germany and France channel partners are fast-tracking lamp stock clearance, while Nordic schools accelerate LED roll-outs to meet environmental procurement codes.
The Middle East and Africa is forecast to post a 5.08% CAGR through 2031, catalyzed by the UAE’s USD 2.7 billion digital-education pledge. Saudi Arabia and Qatar replicate similar EdTech spending as part of Vision 2030 diversification agendas. South African universities adopt laser projectors to avoid frequent lamp imports, supporting regional aftermarket revenue.
South America remains the smallest slice but shows upside as Brazil’s public-school modernization tenders stipulate interactive projection. Chile and Colombia convene tender rounds tied to telecom connectivity programs, promising incremental unit lift for value-priced LCD models. Political and currency risks keep vendors cautious, yet the projector market retains footholds via local distributors that bundle financing and maintenance.

Competitive Landscape
The projector market exhibits moderate fragmentation, with global share spread across Japanese, American, and Chinese manufacturers. Epson sustained top rank by launching 12 new PowerLite L-Series models in February 2025, featuring up to 8,000 lumens and 30,000-hour laser engines. Sharp/NEC scales brightness ceilings to 70,000 lumens for rental giants, while Christie Digital monetizes software such as Cinergy to lock-in cinema chains.
Chinese challengers narrow technology gaps through SoC partnerships; XGIMI’s alliances with Google and MediaTek power Android TV interfaces and AI autofocus, which helped it secure CNY 3.39 billion (USD 467 million) revenue in 2024. JMGO courts audiophiles via Devialet sound systems, differentiating on home-theater acoustics. Competitive tactics span crowdfunding previews, influencer seeding, and cross-border e-commerce, enabling rapid international reach without heavy retail footprints.
Legacy lamp-portfolio vendors must retool to avoid stranded inventory ahead of EU deadlines. Sony’s strategic European exit underscores transition risk. Barco concentrates on 3-chip DLP flagship cinemas, shielding margins through bespoke service contracts. Meanwhile, start-ups pursue pico and laser-TV niches where industrial design and OTT integration matter more than lumen race. As a result, pricing pressure persists in sub-USD 1,000 tiers, even as premium venues maintain healthy margins.
Projector Industry Leaders
Epson Corporation
BenQ Corporation
Sony Corporation
LG Electronics Inc.
Panasonic Corporation
- *Disclaimer: Major Players sorted in no particular order

Recent Industry Developments
- June 2025: Epson marked the 50th anniversary of its projector brand, spotlighting flagship EB-L25000U high-brightness model.
- April 2025: India approved the Rs 76,000 crore Semicon programme, offering 50% fiscal support for display fabs.
- March 2025: Sony exited European projector distribution in response to EU mercury-ban regulations.
- February 2025: Epson released 12 PowerLite L-Series portable laser projectors with up to 8,000 lumens.
- January 2025: ES 2025 premieres included Hisense L9Q TriChroma, Samsung 8K Premiere, and LG compact 4K UST models.


Global Projector Market Report Scope
A projector is an optical device that displays images, videos, or other visual content onto surfaces such as screens, walls, or any flat area. By shining light through or reflecting it off a specialised lens, the projector magnifies the image, projecting it onto a larger surface for audience viewing.
The study tracks the revenue accrued through the sale of the projector by various players across the globe. The study also tracks the key market parameters, underlying growth influencers, and major vendors operating in the industry, which supports the market estimations and growth rates over the forecast period. The study further analyses the overall impact of COVID-19 aftereffects and other macroeconomic factors on the market. The report’s scope encompasses market sizing and forecasts for the various market segments.
The projector market is segmented by technology (DLP (digital light processing), LCD (liquid crystal display), LED (light emitting diode), and laser projectors), application (home entertainment and cinema, business, education and government, large venues, and other applications), and geography (North America, Europe, Asia Pacific, Middle East & Africa, and Latin America). The market sizes and forecasts regarding value (USD) for all the above segments are provided.
| DLP |
| LCD |
| LCOS |
| LED |
| Laser/Hybrid |
| 4K/8K Native Chipset |
| Lamp-based |
| Laser Phosphor |
| LED/Hybrid |
| RGB Pure-Laser |
| XGA and Below |
| WXGA |
| 1080p |
| 4K and Above |
| Below 3,000 |
| 3,000-5,000 |
| 5,001-10,000 |
| Above 10,000 |
| Pico/Portable |
| Ultra-Short-Throw |
| Standard Throw |
| Installation/Large-Venue |
| Home Entertainment and Cinema |
| Corporate/Business |
| Education and Government |
| Rental and Staging/Large Venues |
| Simulation and Visualization |
| Others |
| North America | United States | |
| Canada | ||
| Mexico | ||
| Europe | Germany | |
| United Kingdom | ||
| France | ||
| Nordics | ||
| Rest of Europe | ||
| South America | Brazil | |
| Rest of South America | ||
| Asia-Pacific | China | |
| Japan | ||
| India | ||
| South-East Asia | ||
| Rest of Asia-Pacific | ||
| Middle East and Africa | Middle East | Gulf Cooperation Council Countries |
| Turkey | ||
| Rest of Middle East | ||
| Africa | South Africa | |
| Rest of Africa | ||
| By Technology | DLP | ||
| LCD | |||
| LCOS | |||
| LED | |||
| Laser/Hybrid | |||
| 4K/8K Native Chipset | |||
| By Light Source | Lamp-based | ||
| Laser Phosphor | |||
| LED/Hybrid | |||
| RGB Pure-Laser | |||
| By Resolution | XGA and Below | ||
| WXGA | |||
| 1080p | |||
| 4K and Above | |||
| By Brightness (ANSI Lumens) | Below 3,000 | ||
| 3,000-5,000 | |||
| 5,001-10,000 | |||
| Above 10,000 | |||
| By Form Factor | Pico/Portable | ||
| Ultra-Short-Throw | |||
| Standard Throw | |||
| Installation/Large-Venue | |||
| By Application | Home Entertainment and Cinema | ||
| Corporate/Business | |||
| Education and Government | |||
| Rental and Staging/Large Venues | |||
| Simulation and Visualization | |||
| Others | |||
| By Geography | North America | United States | |
| Canada | |||
| Mexico | |||
| Europe | Germany | ||
| United Kingdom | |||
| France | |||
| Nordics | |||
| Rest of Europe | |||
| South America | Brazil | ||
| Rest of South America | |||
| Asia-Pacific | China | ||
| Japan | |||
| India | |||
| South-East Asia | |||
| Rest of Asia-Pacific | |||
| Middle East and Africa | Middle East | Gulf Cooperation Council Countries | |
| Turkey | |||
| Rest of Middle East | |||
| Africa | South Africa | ||
| Rest of Africa | |||


Key Questions Answered in the Report
What is the current size of the global projector market?
The projector market size stood at USD 12.87 billion in 2026 and is projected to reach USD 15.72 billion by 2031
How will the EU mercury-lamp ban affect projector buyers?
From January 2026, lamp-based projectors cannot be sold in the EU, prompting organizations to shift budgets toward laser and LED models that comply with Regulation (EU) 2023/2049.
Which region is growing fastest for projectors?
The Middle East and Africa leads with a projected 5.08% CAGR through 2031 due to government-funded digital-education initiatives.
Why are ultra-short-throw laser units popular in offices?
They fit large images into small meeting rooms, eliminate lamp maintenance, and deliver low-latency performance critical for hybrid collaboration.
What technology trend offers the highest brightness levels today?
High-end laser projectors now exceed 70,000 lumens, meeting the demands of large venues and outdoor mapping installations
Who are the emerging challengers in consumer projection?
Chinese brands like XGIMI and JMGO are gaining ground by bundling premium streaming ecosystems and design-centric form factors at aggressive price points.
Page last updated on:


