Market Overview
| Study Period | 2020 - 2031 |
|---|---|
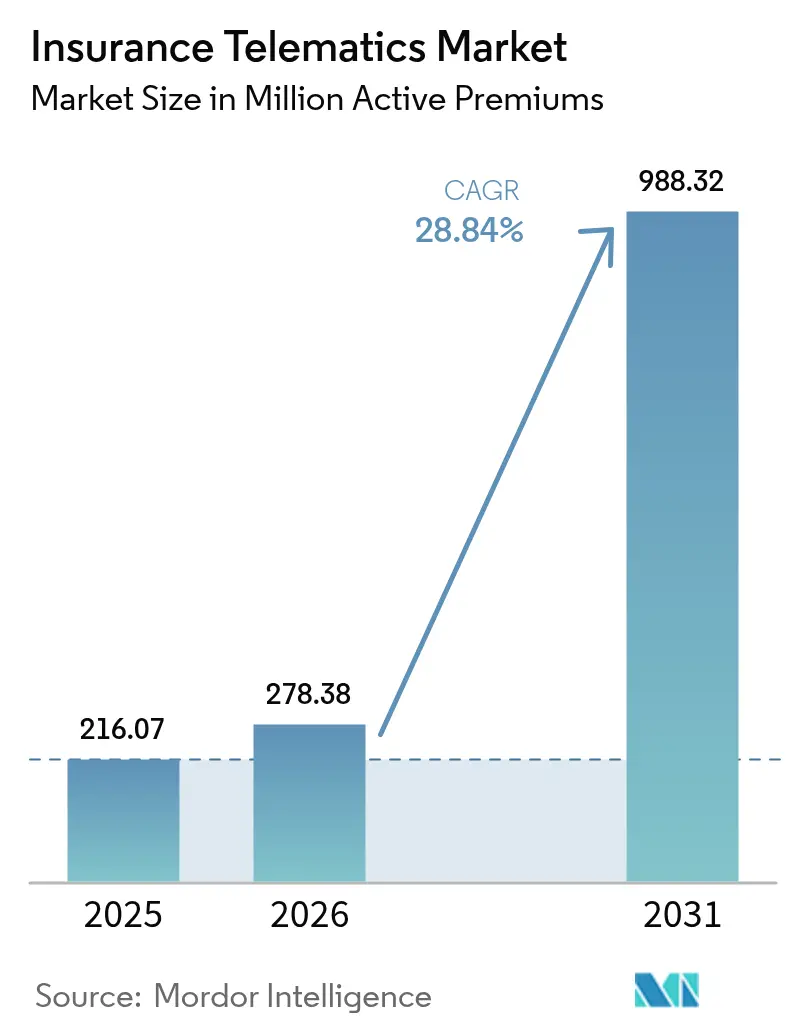
| Market Volume (2026) | 278.38 Million active premiums |
| Market Volume (2031) | 988.32 Million active premiums |
| Growth Rate (2026 - 2031) | 28.84% CAGR |
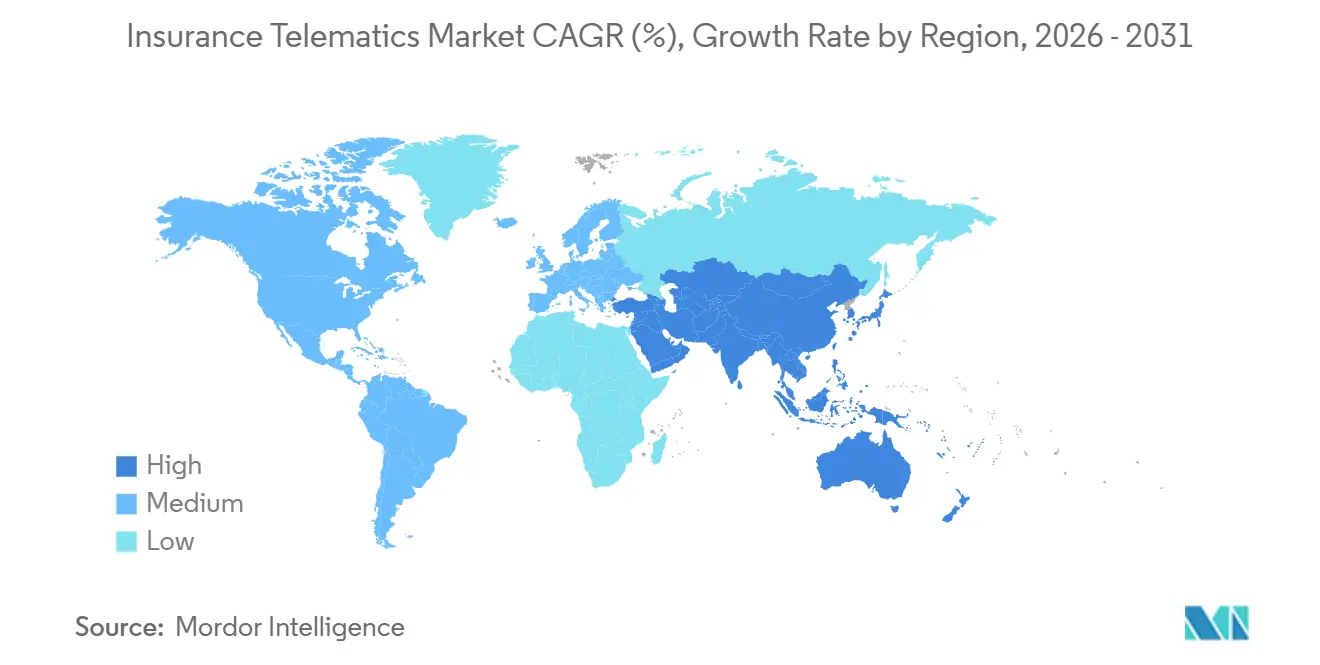
| Fastest Growing Market | Asia Pacific |
| Largest Market | Europe |
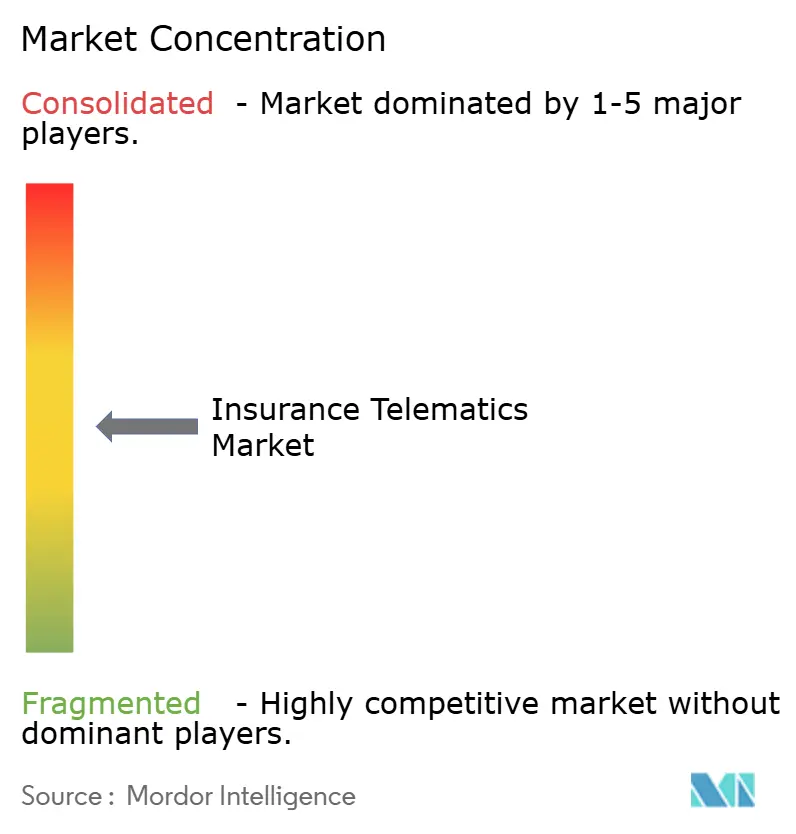
| Market Concentration | Medium |
Major Players *Disclaimer: Major Players sorted in no particular order Image © Mordor Intelligence. Reuse requires attribution under CC BY 4.0. | |
Insurance Telematics Market Analysis by Mordor Intelligence
The insurance telematics market size is projected to be 216.07 Million active premiums in 2025, 278.38 Million active premiums in 2026, and reach 988.32 Million active premiums by 2031, growing at a CAGR of 28.84% from 2026 to 2031. Rapid adoption of behavioral pricing, real-time fraud analytics, and embedded vehicle connectivity is accelerating policyholder enrollment, improving loss ratios, and shifting bargaining power from aftermarket hardware vendors to data-rich insurers. European carriers remain revenue leaders, yet Asia-Pacific insurers are scaling faster as regulatory mandates widen the addressable base and 5G penetration lowers data-transfer costs. Meanwhile, smartphone-centric platforms are reshaping consumer expectations by eliminating installation friction, and OEMs are bundling coverage into vehicle subscriptions to capture underwriting margin. Competitive intensity is rising as insurers race to secure proprietary data pipelines, prompting a wave of platform acquisitions and strategic alliances.
Key Report Takeaways
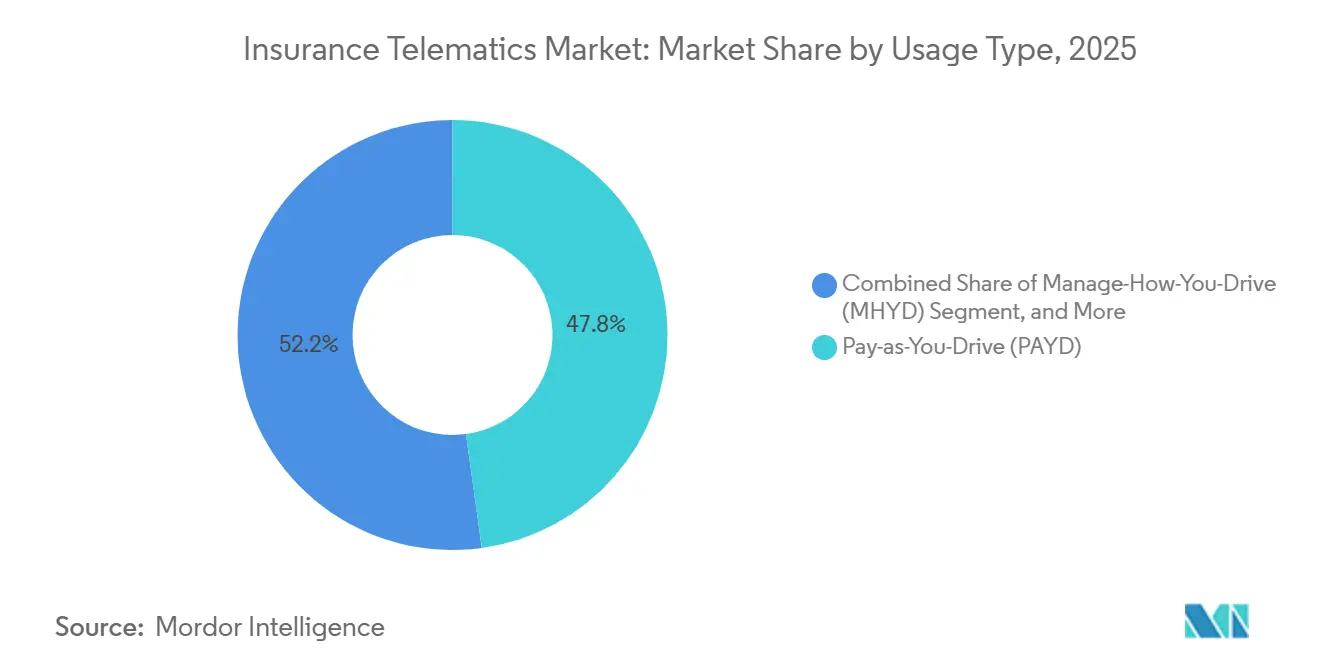
- By usage type, pay-as-you-drive products commanded 47.83% of the insurance telematics market share in 2025, while manage-how-you-drive programs are projected to expand at a 29.49% CAGR through 2031.
- By technology platform, OBD-II dongles captured 36.74% of 2025 deployments, whereas smartphone-centric solutions are forecast to grow at a 29.68% CAGR to 2031.
- By vehicle type, passenger cars accounted for 63.71% of the insurance telematics market share in 2025, while light commercial vehicles are advancing at a 29.44% CAGR through 2031.
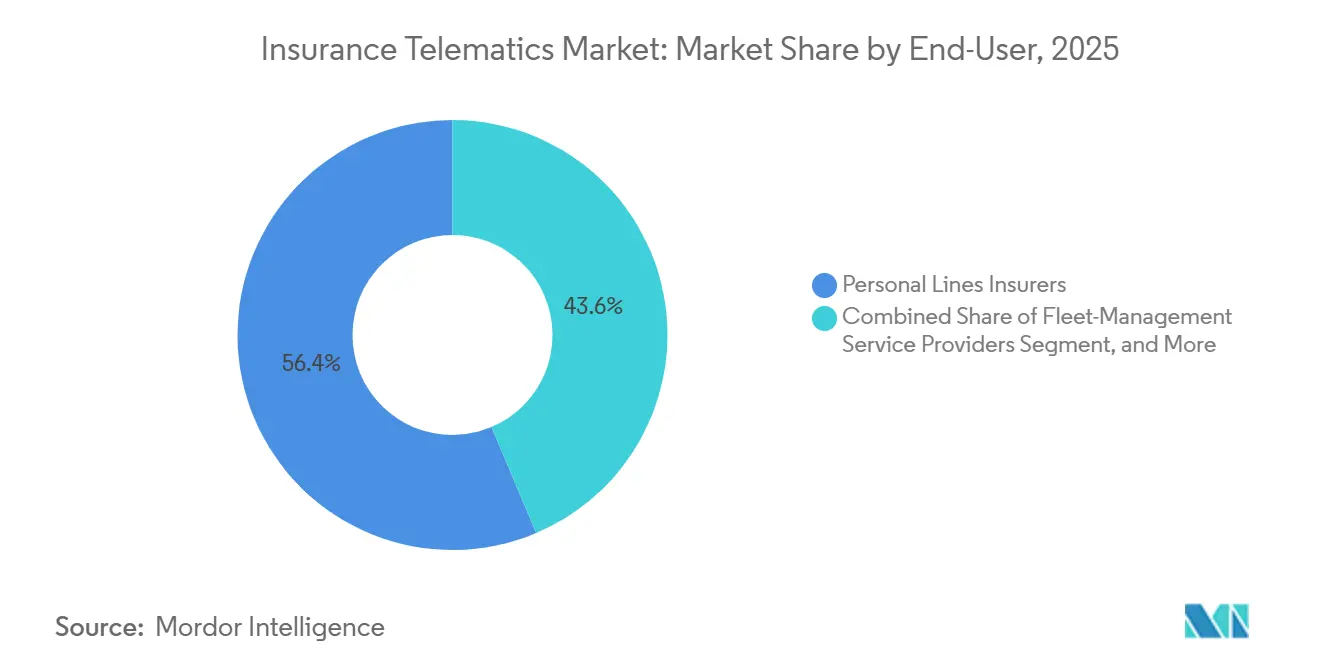
- By end-user, personal-lines insurers accounted for 56.37% of 2025 revenue; fleet-management service providers are expected to post the fastest 29.63% CAGR through 2031.
- By distribution channel, direct-to-consumer sales accounted for 48.19% of the insurance telematics market share in 2025, yet OEM and dealer bundles are set to grow at a 29.41% CAGR through 2031.
- By geography, Europe led with 32.77% of 2025 revenue, while Asia-Pacific is poised for the highest CAGR of 29.86% through 2031.
Note: Market size and forecast figures in this report are generated using Mordor Intelligence’s proprietary estimation framework, updated with the latest available data and insights as of 2026.
Global Insurance Telematics Market Trends and Insights
Drivers Impact Analysis*
| Driver | (~) % Impact on CAGR Forecast | Geographic Relevance | Impact Timeline |
|---|---|---|---|
| Rapid Insurer Shift to Usage-Based Insurance (UBI) | +6.5% | Global, with early concentration in North America and Europe | Medium term (2-4 years) |
| Automotive Connectivity Innovations (5G, eSIM) | +5.8% | Asia-Pacific core, spill-over to North America and Europe | Long term (≥ 4 years) |
| Stricter Road-Safety and CO2 Regulations | +4.2% | Europe and North America, expanding to Asia-Pacific | Long term (≥ 4 years) |
| Increasing Adoption of Smartphone-Based Telematics Apps | +5.5% | Global, with fastest uptake in North America and Asia-Pacific | Short term (≤ 2 years) |
| OEM API Monetisation Mandates | +3.9% | North America and Europe, selective Asia-Pacific markets | Medium term (2-4 years) |
| AI-Driven Fraud Scoring Lowering Loss Ratios | +4.1% | Global, with advanced deployment in North America and Europe | Medium term (2-4 years) |
| Source: Mordor Intelligence | |||
Rapid Insurer Shift to Usage-Based Insurance
North American and European carriers expanded mileage- and behavior-based pricing after claims severity spiked during 2024-2025. California cleared mileage factors in rating plans, opening the largest U.S. auto market to full UBI discounts of up to 30%. The European supervisor encouraged member states to allow automated behavioral scoring under GDPR exemptions, giving insurers legal certainty to scale programs.[1]European Commission, “Road Safety Framework,” ec.europa.eu Early adopters reported 8-12 percentage-point improvements in combined ratios within 18 months. Rising actuarial confidence is prompting carriers to market UBI to younger drivers who reject demographic pricing.
Automotive Connectivity Innovations
Standalone 5G networks and eSIM modules now deliver sub-10-millisecond latency, enabling instant crash alerts and parametric payouts.[2]THALES Group, “eSIM for Connected Vehicles,” thalesgroup.com The SGP.32 eSIM standard lets insurers provision connectivity over the air, cutting cross-border roaming costs for fleets by up to 60%. New automotive modems scheduled for late 2025 sampling enable real-time video uploads, strengthening fraud analytics. These advances reduce hardware swaps, lower data bills, and improve user experience. Asia-Pacific fleets are first movers, but similar upgrades are rolling into North America and Europe.
Stricter Road Safety and CO₂ Regulations
Since July 2024, the European Union has required intelligent speed assistance and event data recorders in all new vehicles, creating a built-in sensor base for insurers. The United Kingdom’s road safety plan links premium discounts to sustained ISA use, driving policy uptake among young drivers. Heavy-duty CO₂ rules now force fleet operators to document fuel savings, making eco-driving telematics a compliance tool. Japan expanded its green fleet program in 2025, tying insurance eligibility to telematics reporting. Together, these mandates push insurers and fleets toward data-rich coaching platforms.
Increasing Adoption of Smartphone-Based Telematics Apps
Zero hardware cost and instant onboarding make smartphone apps the fastest-growing delivery model. Cambridge Mobile Telematics processed 12 billion trips in 2025, with distraction-detection accuracy above 95%.[3]Cambridge Mobile Telematics, “Global Trip Data 2025,” cmtelematics.com TrueMotion showed a 22% drop in hard-braking events within 90 days of in-app coaching, driving 18% lower claims frequency for partner insurers. French regulators now permit the use of app data for rating, provided insurers disclose retention limits and opt-out options. Broader smartphone penetration in Asia-Pacific and Latin America is further widening the addressable pool.
Restraints Impact Analysis*
| Restraint | (~) % Impact on CAGR Forecast | Geographic Relevance | Impact Timeline |
|---|---|---|---|
| Data-Privacy and Consent Hurdles (GDPR, CPRA) | -2.8% | Europe and California, expanding to other US states | Short term (≤ 2 years) |
| Device and Data-Quality Interoperability Gaps | -2.3% | Global, acute in multi-OEM fleet environments | Medium term (2-4 years) |
| High Upfront Device Costs in Emerging Markets | -1.9% | South America, Middle East, and Africa | Medium term (2-4 years) |
| Rising CAN-Bus Cyber-Attacks on Aftermarket Dongles | -1.7% | Global, concentrated in North America and Europe | Short term (≤ 2 years) |
| Source: Mordor Intelligence | |||
Data-Privacy and Consent Hurdles
GDPR requires explicit, granular opt-ins for location and behavior tracking, and a 2025 survey found that 34% of European consumers abandoned sign-ups after reading consent forms. California’s CPRA gives drivers the right to delete telematics data and bars fully automated adverse actions, forcing parallel manual reviews that lift operating costs by up to 20%. Regulators also prohibit insurers from conditioning coverage on data sharing and limit enrollment to voluntary programs that attract lower-risk drivers. These requirements lengthen onboarding flows and dilute actuarial lift.
Device and Data-Quality Interoperability Gaps
OBD-II dongles, embedded OEM APIs, and smartphone SDKs generate inconsistent metrics, with harsh-braking thresholds differing by 40% across major platforms. Uneven OEM data access leaves independent carriers blind to ADAS activity, forcing them to rely on less granular aftermarket hardware. Logistics firms operating in multiple countries must reconcile divergent data schemas, raising integration costs by up to 30%. Industry alliances are drafting common dictionaries, yet adoption remains voluntary, prolonging fragmentation.
*Our forecasts treat driver/restraint impacts as directional, not additive. The impact forecasts reflect baseline growth, mix effects, and variable interactions.
Segment Analysis
By Usage Type: Coaching Programs Accelerate MHYD Uptake
Manage-how-you-drive programs are gaining momentum as insurers monetize in-app coaching that cuts accident frequency by 20-30% within a single policy year. PAYD products still commanded 47.83% of the 2025 insurance telematics market share, yet MHYD offerings are projected to expand at a 29.49% CAGR through 2031 as policyholders respond to real-time feedback loops. The insurance telematics market size tied to MHYD grows each time drivers earn premium discounts for sustained safe-driving streaks, reinforcing behavioral change and boosting retention. Regulatory acceptance in Germany, France, and several U.S. states now links actuarial credibility to statistically proven loss-ratio gains, giving carriers confidence to scale beyond pilot cohorts.
PAYD remains popular among low-mileage urban drivers who value transparent per-mile pricing, while MHYD appeals to suburban and rural motorists whose higher annual mileage dilutes per-mile savings. Hybrid PAYD-plus-behavior models are emerging as bridges between the two paradigms, letting insurers graduate users to deeper engagement levels without disrupting policy tenure. As actuarial datasets thicken, underwriters refine rating variables to capture cornering, speed consistency, and distraction events, moving beyond mileage as a blunt exposure proxy. This transition reshapes risk pools by encouraging self-selection: high-risk drivers often opt out, leaving safer cohorts that further improve combined ratios and free capital for product innovation.


By Technology Platform: Smartphone Apps Outpace Hardware-Based Models
OBD-II dongles retained 36.74% of 2025 deployments, yet smartphone-centric platforms are scaling at a 29.68% CAGR because they eliminate hardware costs and enable instant onboarding. For personal-lines insurers, app downloads complete in minutes, compressing acquisition funnels and widening addressable reach across older vehicle vintages. Embedded OEM modules, roughly 28% of shipments, deliver richer CAN-bus data and tamper resistance but face data-access negotiations that slow rollout beyond captive insurers. The insurance telematics market share held by smartphone apps rises as carriers integrate distraction detection, a feature not possible with legacy dongles.
Regional drivers vary. European carriers often prefer embedded modules that anonymize data at the edge to meet GDPR requirements, while North American insurers lean on app-based solutions to serve a fragmented fleet of vehicle ages and trim levels, and to reduce acquisition costs. In emerging economies, low-cost dongles fill the gap where smartphone penetration or data plans remain uneven, though falling silicon prices are squeezing vendor margins and accelerating platform consolidation. Over time, insurers and regulators alike are converging on API-based data exchange standards that favor software-defined models, tilting the insurance telematics market size decisively toward connectivity-agnostic architectures.
By Vehicle Type: LCV Deployments Lead Growth Curve
Passenger cars supplied 63.71% of 2025 volume, reflecting their global fleet dominance, yet light commercial vehicles are forecast to climb at a 29.44% CAGR through 2031 as e-commerce accelerates last-mile delivery demand. Logistics operators use telematics to plan dynamic routes that trim fuel use by up to 15% and shrink delivery windows, directly boosting razor-thin operating margins. The insurance telematics market for LCVs continues to grow as insurers mandate data sharing for theft-prone vans in Europe and for tax-incentivized electric delivery fleets in the Asia-Pacific. Heavy commercial vehicles advance with the overall market as electronic logging devices form a mandated data backbone ripe for predictive maintenance overlays.
Passenger-car penetration is plateauing in mature markets but remains low in South America and parts of Asia, where privacy concerns and limited carrier investment impede adoption. Conversely, regulatory tailwinds for LCVs multiply: ELD compliance in North America and tachograph rules in Europe make telematics a prerequisite for permits, while insurance premiums fall for operators who can document eco-driving. Heavy-duty fleets tap sensor data to cut downtime, thereby indirectly reducing collision risk through better-maintained braking systems. As regional mandates converge, insurers refine algorithms that weight duty cycle, load factor, and urban stop density, making vehicle-specific insights the next frontier for underwriting precision.
By End-User: Fleet-Management Providers Gain Speed
Personal-lines carriers delivered 56.37% of 2025 revenue, yet fleet-management service providers are advancing at a 29.63% CAGR as they bundle insurance with maintenance, fuel cards, and route optimization. The commercial opportunity grows each time logistics operators integrate risk scores into dispatch algorithms that shave minutes off delivery windows and reduce idle fuel burn. Independent commercial insurers are segmenting portfolios by vertical long-haul trucking, construction, or public transit so they can calibrate premiums to highly specific duty cycles. OEM-captive insurers, meanwhile, embed policies into vehicle subscription plans, diverting underwriting margins from traditional carriers and deepening customer lifetime value.
As fleets scale, underwriters shift from annual fixed premiums to dynamic monthly billing tied to aggregated telematics scores, stabilizing cash flow for operators and lowering claim ratios for carriers. Integrated dashboards feed utilization, maintenance, and risk metrics into a single pane, simplifying compliance with hours-of-service and sustainability mandates. For insurers, in-house actuarial teams exploit the insurance telematics market share data to design niche coverages, such as parametric cargo-delay endorsements that trigger automated payouts. Competitive advantage now rests on analytic accuracy and the breadth of value-added services rather than on price alone.
By Distribution Channel: OEM and Dealer Bundles Disrupt Direct Sales
Direct-to-consumer policies represented 48.19% of 2025 revenue, but OEM and dealer bundles are on track to grow at a 29.41% CAGR as connected-vehicle platforms enable instant quoting at the point of sale. The insurance telematics market size captured by automakers rises each time a factory-installed module feeds real-time data into underwriting engines that refresh premiums monthly. Broker-mediated channels, roughly 30% of the total, expand more slowly as self-service digital flows siphon volume, yet agents who reposition telematics as a reward rather than surveillance maintain niche loyalty.
OEM bundles benefit from lower customer acquisition costs and higher data fidelity, though regulators probe for anti-competitive tying when financing terms favor captive insurers. Independent carriers respond by partnering with API aggregators that unlock standardized OEM data streams, closing the information gap without ceding brand control. Direct-sale specialists such as digital-native insurers exploit telematics to prefill applications, cutting quote times to under a minute and dropping acquisition costs by up to 40%. Over time, multichannel ecosystems will likely coexist, but embedded policies are expected to keep outpacing standalone offerings as vehicle connectivity becomes ubiquitous.
Geography Analysis
Europe generated 32.77% of 2025 revenue, the largest insurance telematics market share among all regions. Penetration topped 20% in the United Kingdom, Italy, and France as black-box mandates and premium discounts of up to GBP 1,200 (USD 1,500) encouraged adoption. Carriers rely on factory-installed modules that anonymize data at the edge, a design that satisfies stringent GDPR rules and stabilizes loss ratios. Growth is tempered by privacy sensitivities, with continuous-tracking opt-in rates ranging from 62% in the United Kingdom to 48% in Germany. Even so, carbon-footprint dashboards and young-driver subsidies keep demand resilient.
Asia-Pacific is forecast to expand at a 29.86% CAGR through 2031, the fastest regional pace in the insurance telematics market size outlook. China requires pre-installed connectivity in commercial vehicles, while India enforces AIS-140 tracking for public transport, together unlocking millions of devices. Japan’s OEM-insurer alliances already deliver 15-30% premium reductions for safe drivers and have recorded 800,000 enrollments in 9 months. South Korea offers tax credits of KRW 500,000 (USD 375) for senior motorists who install telematics. Such policy levers shorten payback periods and fuel rapid carrier rollouts across both personal and fleet lines.
California's adoption of mileage-based ratings, alongside a concerted effort by top insurers across the U.S., is driving momentum in North America. In 2025, Canada saw a surge in adoption after insurers provided discounts ranging from 20% to 30% to drivers with lower mileage. While Mexico, much of South America, and regions in the Middle East and Africa generated revenue, high hardware costs and sparse data networks hindered broader scalability. Nevertheless, Brazil's theft-centric fleet programs and pilot "Pay As You Drive" (PAYD) initiatives in the Gulf states hint at untapped potential, especially if connectivity costs continue their downward trend.

Competitive Landscape
The top ten vendors controlled roughly 45% of 2025 revenue, indicating a moderately concentrated field with room for both scale players and specialists. Large insurers accelerate vertical integration by buying telematics platforms to secure proprietary data flows and cut third-party fees. Mid-tier carriers favor white-label solutions from Cambridge Mobile Telematics, Octo Telematics, and TrueMotion to reduce time-to-market. Platform ownership is now viewed as strategic, prompting active deal pipelines and higher valuations for analytics providers. Capital commitments signal that data fidelity and analytic depth are the next battlegrounds.
Strategic moves illustrate diverging playbooks. Progressive extended its Snapshot program to 7 million drivers and announced dash-cam AI integration for 2026, locking in renewal lifts of 12 percentage points. Allstate embedded Drivewise in Apple CarPlay and Android Auto, surpassing 4.2 million enrollments and trimming its personal-auto loss ratio by 6%. AXA took a minority stake in DriveQuant to accelerate smartphone rollouts across Europe, while Generali launched carbon-tracking MHYD policies aligned with EU sustainability rules. General Motors pushed OnStar Insurance into 12 states, exploiting factory connectivity to cut acquisition costs by 35%. Each initiative underscores the race to couple data ownership with differentiated customer value.
Emerging disruptors attack from the data layer rather than hardware manufacturing. Nexar crowdsources dash-cam video to build real-time risk maps that insurers can license. Otonomo aggregates OEM telemetry into standardized APIs, giving independent carriers parity with captive rivals. Patent filings surge in sensor fusion and fraud detection, favoring firms that can validate distraction events without false positives. ISO and SAE cybersecurity standards become de facto contract requirements, advantaging vendors with mature compliance frameworks. Competitive intensity remains highest in North America, where digital-native insurers routinely offer 30-40% discounts, forcing incumbents to match prices while maintaining profitability.
Insurance Telematics Industry Leaders
Unipol Gruppo SpA
Octo Telematics SpA
DriveQuant SAS
The Floow Ltd.
Viasat Group SpA
- *Disclaimer: Major Players sorted in no particular order

Recent Industry Developments
- January 2026: Cambridge Mobile Telematics partnered with eight European insurers to deploy distraction detection across 12 countries, targeting 5 million drivers by year-end 2026.
- December 2025: Vodafone Business added embedded eSIM connectivity to its V-Auto platform, enabling over-the-air carrier switching in 28 European countries.
- November 2025: Generali introduced a manage-how-you-drive product in Italy and Spain that offers up to 25% premium discounts for drivers cutting CO₂ emissions by 15% or more.
- October 2025: Toyota and Tokio Marine expanded their telematics program to Thailand and Indonesia after enrolling 800,000 Japanese drivers.


Global Insurance Telematics Market Report Scope
The Insurance Telematics Market Report is Segmented by Usage Type (Pay-as-You-Drive (PAYD), Pay-How-You-Drive (PHYD), Manage-How-You-Drive (MHYD)), Technology Platform (OBD-II Dongle, Embedded OEM Module, Smartphone-Centric, Black-Box/Hardwired), Vehicle Type (Passenger Cars, Light Commercial Vehicles, Heavy Commercial Vehicles), End-User (Personal Lines Insurers, Commercial Lines Insurers, Automotive OEM Captives, Fleet-Management Service Providers), Distribution Channel (Direct-to-Consumer, Broker/Agent-Mediated, OEM/Dealer Bundle), and Geography (North America, South America, Europe, Asia-Pacific, Middle East and Africa). The Market Forecasts are Provided in Terms of Value (USD).
By Usage Type
| Pay-as-You-Drive (PAYD) |
| Pay-How-You-Drive (PHYD) |
| Manage-How-You-Drive (MHYD) |
By Technology Platform
| OBD-II Dongle |
| Embedded OEM Module |
| Smartphone-Centric |
| Black-Box / Hardwired |
By Vehicle Type
| Passenger Cars |
| Light Commercial Vehicles |
| Heavy Commercial Vehicles |
By End-User
| Personal Lines Insurers |
| Commercial Lines Insurers |
| Automotive OEM Captives |
| Fleet-Management Service Providers |
By Distribution Channel
| Direct-to-Consumer |
| Broker / Agent-Mediated |
| OEM / Dealer Bundle |
By Geography
| North America | United States | |
| Canada | ||
| Mexico | ||
| South America | Brazil | |
| Argentina | ||
| Rest of South America | ||
| Europe | United Kingdom | |
| Germany | ||
| France | ||
| Italy | ||
| Rest of Europe | ||
| Asia-Pacific | China | |
| Japan | ||
| India | ||
| South Korea | ||
| Rest of Asia-Pacific | ||
| Middle East and Africa | Middle East | United Arab Emirates |
| Saudi Arabia | ||
| Rest of Middle East | ||
| Africa | South Africa | |
| Egypt | ||
| Rest of Africa | ||
| By Usage Type | Pay-as-You-Drive (PAYD) | ||
| Pay-How-You-Drive (PHYD) | |||
| Manage-How-You-Drive (MHYD) | |||
| By Technology Platform | OBD-II Dongle | ||
| Embedded OEM Module | |||
| Smartphone-Centric | |||
| Black-Box / Hardwired | |||
| By Vehicle Type | Passenger Cars | ||
| Light Commercial Vehicles | |||
| Heavy Commercial Vehicles | |||
| By End-User | Personal Lines Insurers | ||
| Commercial Lines Insurers | |||
| Automotive OEM Captives | |||
| Fleet-Management Service Providers | |||
| By Distribution Channel | Direct-to-Consumer | ||
| Broker / Agent-Mediated | |||
| OEM / Dealer Bundle | |||
| By Geography | North America | United States | |
| Canada | |||
| Mexico | |||
| South America | Brazil | ||
| Argentina | |||
| Rest of South America | |||
| Europe | United Kingdom | ||
| Germany | |||
| France | |||
| Italy | |||
| Rest of Europe | |||
| Asia-Pacific | China | ||
| Japan | |||
| India | |||
| South Korea | |||
| Rest of Asia-Pacific | |||
| Middle East and Africa | Middle East | United Arab Emirates | |
| Saudi Arabia | |||
| Rest of Middle East | |||
| Africa | South Africa | ||
| Egypt | |||
| Rest of Africa | |||


Key Questions Answered in the Report
How large will insurance telematics premiums be by 2031?
The insurance telematics market is forecast to reach USD 988.32 million by 2031, expanding at a 28.84% CAGR from 2026.
Which platform is gaining fastest traction among personal-lines carriers?
Smartphone-centric apps lead growth, scaling at a 29.68% CAGR thanks to zero hardware cost and distraction monitoring.
Why are manage-how-you-drive programs attracting insurers?
Real-time coaching lowers accident frequency by up to 30%, improving combined ratios and boosting customer retention.
What is prompting Asia-Pacific’s rapid adoption?
Regulatory mandates for factory-installed telematics in China and incentives in Japan, India, and South Korea are driving 29.86% regional CAGR.
How do privacy regulations affect telematics rollouts?
GDPR and CPRA demand explicit consent and data-deletion rights, increasing program complexity and raising compliance costs by up to 20%.
Page last updated on:


