
Insect Repellent Market Size and Share
Market Overview
| Study Period | 2022 - 2032 |
|---|---|
| Market Size (2027) | USD 11.42 Billion |
| Market Size (2032) | USD 15.38 Billion |
| Growth Rate (2027 - 2032) | 6.12 % |
| Fastest Growing Market | Middle East and Africa |
| Largest Market | Asia Pacific |
| Market Concentration | Medium |
Major Players *Disclaimer: Major Players sorted in no particular order Image © Mordor Intelligence. Reuse requires attribution under CC BY 4.0. | |
Insect Repellent Market Analysis by Mordor Intelligence
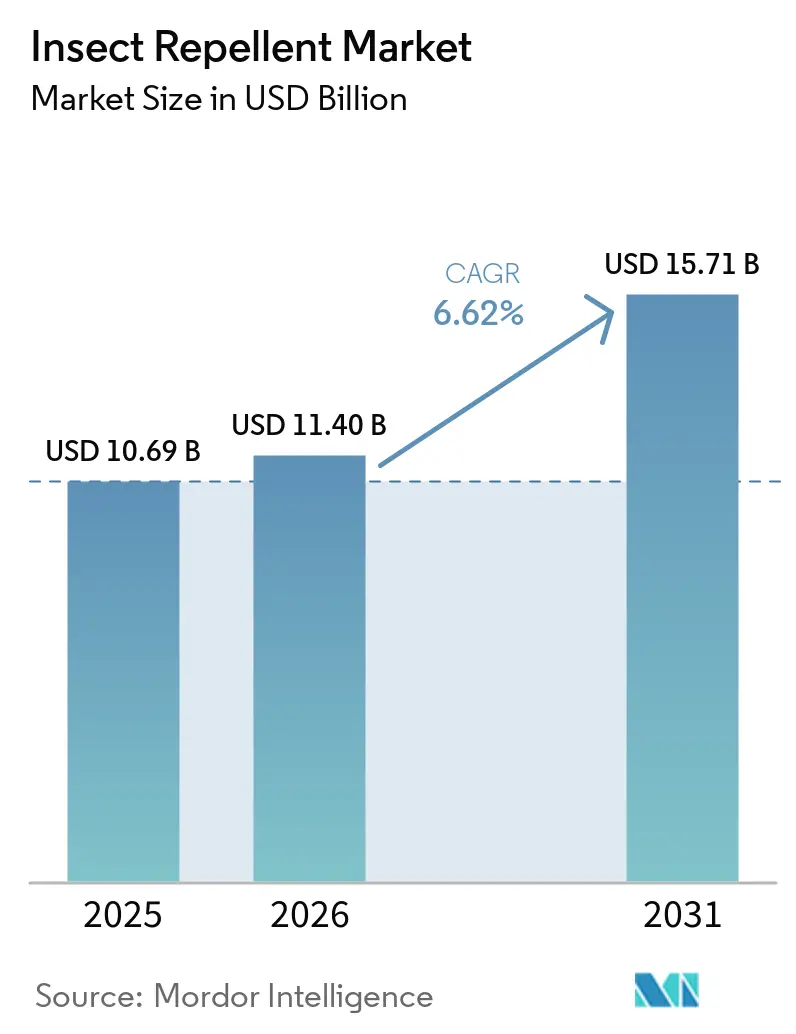
The Insect Repellent Market was valued at USD 10.82 billion in 2026 and is estimated to grow from USD 11.42 billion in 2027 to reach USD 15.38 billion by 2032, at a CAGR of 6.12% during the forecast period (2027–2032). Market growth is driven by increasing awareness of insect-borne diseases, rising health and hygiene consciousness, and growing demand for preventive protection. Concerns about mosquito bites and exposure to disease-carrying insects are encouraging consumers to incorporate insect repellent products into their personal and household care routines. Changing climatic conditions, expanding urban environments, and greater exposure to insect populations are further reinforcing the need for preventive insect control, supporting consistent market demand.
Key Report Takeaways
-
By product type, sprays/aerosols held the largest market share of 50.93% in 2026, while liquid vaporizers are projected to expand at a 7.51% CAGR through 2032.
-
By ingredient type, conventional insect repellents accounted for 90.54% of the market share in 2026, while natural insect repellents are projected to grow at an 8.44% CAGR through 2032.
-
By end user, adults commanded a 93.09% market share in 2026, while kids/children products are projected to record the fastest growth at an 8.50% CAGR through 2032.
-
By distribution channel, supermarkets/hypermarkets led with a 42.50% market share in 2026, while online retail stores are projected to expand at a 7.47% CAGR through 2032.
-
By geography, Asia-Pacific accounted for a 48.10% revenue share in 2026, while the Middle East and Africa is projected to register the fastest growth at a 7.47% CAGR through 2032.
Note: Market numbers in this report are based on Mordor Intelligence's proprietary estimation framework, which combines nine months of actuals with Q4 projections for base year 2026.
Market Trends and Insights
Drivers Impact Analysis of Insect Repellent Market*
| Driver | (~) % Impact on CAGR Forecast | Geographic Relevance | Impact Timeline |
|---|---|---|---|
| Rise in Vector-borne Diseases | +1.8% | Global, with the highest impact in Asia-Pacific and Sub-Saharan Africa | Long term (≥ 4 years) |
| Increasing Outdoor Recreational Activities | +1.2% | North America and Europe core, expanding to Asia-Pacific urban centers | Medium term (2-4 years) |
| Growing Pet Ownership | +0.9% | North America, Europe, and urban Asia-Pacific markets | Medium term (2-4 years) |
| Shifting Consumer Preferences Towards Natural Products | +1.4% | Global, led by North America and Europe | Long term (≥ 4 years) |
| Rapid Technological Advancements Driving Innovation | +1.1% | Global, with research and development centers in North America, Europe, and Japan | Medium term (2-4 years) |
| Government and Public Health Campaigns | +0.8% | Global, with concentrated efforts in malaria-endemic regions | Short term (≤ 2 years) |
| Source: Mordor Intelligence | |||
Rise in Vector-borne Diseases
The rising prevalence of vector-borne diseases, particularly dengue and malaria, is driving demand for insect repellents as consumers increasingly prioritize protection against mosquito and other insect bites. Recurring disease outbreaks and growing awareness of mosquito-borne transmission are encouraging households to adopt preventive measures, including sprays, aerosols, coils, liquid vaporizers, and personal insect repellent products. According to the Pan American Health Organization (PAHO), approximately 4.46 million suspected dengue cases and 2,207 deaths were reported across the Americas in 2025[1]. This continued disease burden is strengthening public awareness of mosquito-bite prevention and encouraging consumers to incorporate insect repellents into their regular household and personal protection routines. Consequently, the demand for accessible and effective insect protection solutions is supporting market growth.
Increasing Outdoor Recreational Activities
Growing participation in outdoor recreational activities, including hiking, camping, trekking, fishing, cycling, and wildlife exploration, is driving demand for insect repellents, as individuals spend more time in environments exposed to mosquitoes, ticks, and other biting insects. This trend is encouraging consumers to carry portable and easy-to-apply protection products, such as sprays, aerosols, and wearable insect protection solutions. According to the Outdoor Industry Association (OIA), 183.2 million Americans, representing 59% of the United States population aged six and older, participated in outdoor recreation in 2025[2]. This expanding participation base is creating greater opportunities for insect repellent manufacturers, as outdoor enthusiasts increasingly seek convenient protection against insect bites during recreational trips and outdoor activities.
Growing Pet Ownership
The increasing ownership of companion animals is supporting demand for insect repellents, as pet owners become more conscious of maintaining hygienic and insect-controlled household environments. Pets, particularly dogs and cats, can be exposed to mosquitoes, fleas, ticks, and other insects during outdoor activities and within residential surroundings, encouraging households to adopt preventive insect protection measures. This is creating opportunities for manufacturers offering household insect repellents, including sprays, aerosols, coils, and liquid vaporizers suitable for use in pet-owning households. According to the European Pet Food Industry Federation (FEDIAF), approximately 140 million European households owned at least one pet in 2024. The expanding pet-owning population is increasing consumer attention toward household hygiene and insect control, thereby supporting demand for insect repellent products.
Shifting Consumer Preferences Towards Natural Products
Growing consumer preference for natural, plant-based, and environmentally conscious products is driving the demand for natural insect repellents, as consumers increasingly seek alternatives to conventional formulations containing synthetic chemical ingredients. Awareness of ingredient safety, skin sensitivity, environmental considerations, and prolonged exposure to chemical-based products is encouraging consumers to explore formulations derived from botanical ingredients such as citronella, eucalyptus, neem, lemongrass, and peppermint oils. This shift is prompting manufacturers to expand their natural product portfolios, improve formulation effectiveness, and introduce alternatives across sprays, aerosols, coils, and other repellent formats. The growing emphasis on ingredient transparency, plant-derived formulations, and perceived safety is strengthening the position of natural insect repellents and expanding their appeal among health-conscious and environmentally aware consumers.
Restraints Impact Analysis of Insect Repellent Market*
| Restraint | (~) % Impact on CAGR Forecast | Geographic Relevance | Impact Timeline |
|---|---|---|---|
| Competition from Alternative Protection Methods | -0.8% | Global, with a higher impact in developed markets | Medium term (2-4 years) |
| Consumer Health Concerns Over Chemicals | -1.2% | North America and Europe primarily | Long term (≥ 4 years) |
| Insecticide Resistance | -0.6% | Global, concentrated in tropical regions | Long term (≥ 4 years) |
| Availability of Counterfeit Products | -0.4% | Asia-Pacific and emerging markets | Short term (≤ 2 years) |
| Source: Mordor Intelligence | |||
Competition from Alternative Protection Methods
The availability of alternative insect protection methods is restraining the growth of the insect repellent market. Products such as mosquito nets, window screens, protective clothing, electric insect traps, and insecticide-treated bed nets provide consumers with options beyond topical and household insect repellents. These alternatives offer physical barriers or localized insect control, reducing the need for frequent repellent application in certain environments. Reusable options, such as mosquito nets and window screens, are particularly appealing to consumers due to their lower replacement frequency and long-term protection. The growing adoption of these alternatives, especially in residential settings and regions with recurring mosquito exposure, creates competitive pressure on conventional insect repellent products and may limit their usage frequency and overall market demand.
Consumer Health Concerns Over Chemicals
Growing consumer concerns about the potential health effects of synthetic chemicals in insect repellent formulations are restraining market growth by influencing purchasing decisions and product usage patterns. Some consumers are cautious about prolonged exposure to chemical-based active ingredients, particularly when products are applied directly to the skin or used frequently in enclosed residential spaces. Concerns about skin irritation, allergic reactions, respiratory sensitivity, and accidental exposure among children are prompting some households to limit the frequency of repellent application or seek alternative protection methods. These perceptions create hesitation toward conventional insect repellent products, particularly those containing synthetic active ingredients.
*Our forecasts treat driver/restraint impacts as directional, not additive. The impact forecasts reflect baseline growth, mix effects, and variable interactions.
Insect Repellent Market Segment Analysis
By Product Type:
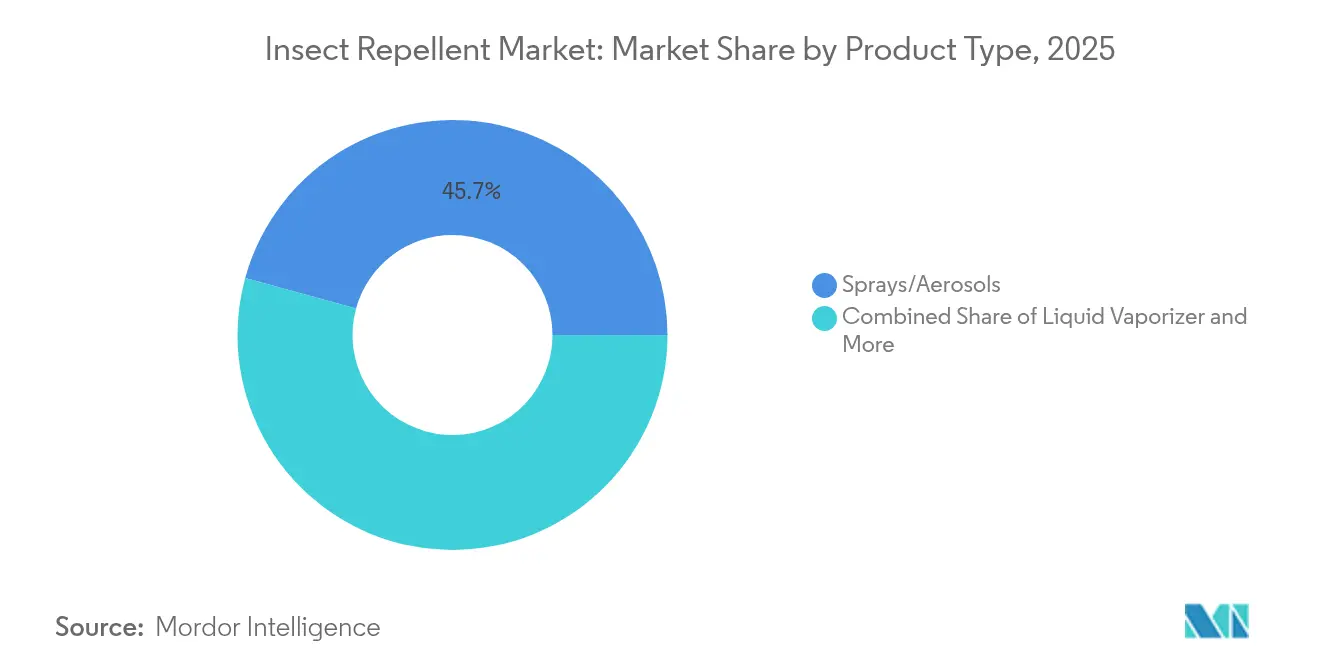
Liquid Vaporizers Drive InnovationIn 2026, sprays and aerosols held the largest share of the insect repellent market at 50.93%, driven by their convenience, portability, and ease of application. These products allow consumers to obtain immediate protection without additional equipment or installation. Their ready-to-use format and suitability for different environments contribute to their broad consumer appeal. Product improvements, including longer-lasting protection, improved spray mechanisms, and skin-friendly formulations, have further supported their adoption. The availability of different packaging sizes, including compact and travel-friendly options, enhances accessibility and encourages repeat purchases, reinforcing the dominant position of sprays and aerosols in the market.
Liquid vaporizers are the fastest-growing product type, projected to register a CAGR of 7.51% through 2032. Growth is driven by increasing consumer preference for automated and continuous insect protection solutions that require minimal manual intervention. Their ability to release repellent formulations gradually over extended periods, combined with simple operation and convenient refill systems, supports their growing adoption. Advancements in vaporization technology, adjustable intensity settings, energy-efficient heating systems, and longer-lasting refill formulations are further improving product functionality and user convenience.



By Ingredient Type:
Natural Alternatives Gain MomentumIn 2026, conventional insect repellents dominated the market with a 90.54% share, supported by their established effectiveness, widespread consumer familiarity, and extensive availability of formulations containing active ingredients such as DEET, picaridin, and other synthetic compounds. Their proven performance, standardized formulations, established manufacturing infrastructure, and broad commercial availability strengthen consumer confidence and support consistent demand. Continued product development aimed at improving protection duration, formulation stability, and application convenience further reinforces the position of conventional repellents in the market.
Natural insect repellents are projected to register the fastest growth, with an 8.44% CAGR through 2032, driven by shifting consumer preferences toward plant-derived ingredients and alternatives to conventional chemical formulations. Increasing attention to ingredient transparency, environmental considerations, and perceived skin compatibility is encouraging interest in botanical ingredients such as citronella, eucalyptus, neem, lemongrass, and peppermint oils. Manufacturers are increasingly focusing on improving the effectiveness, fragrance profiles, and formulation stability of natural repellents to address consumer expectations and expand their appeal. These developments are strengthening the growth prospects of natural insect repellents.
By End User:
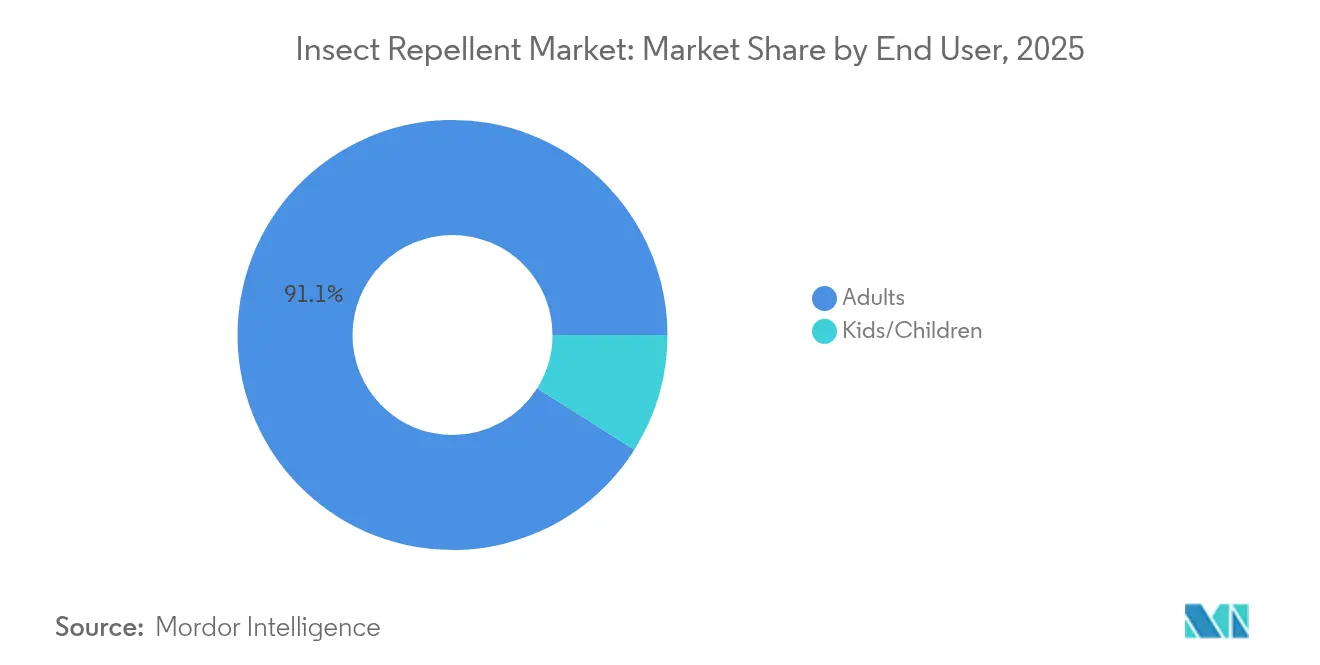
Children's Segment Drives Safety InnovationAdults dominated the insect repellent market with a 93.09% share in 2026, reflecting their significant role in purchasing and using insect protection products for personal, household, and outdoor needs. Growing awareness of insect-borne diseases, concerns about insect bites, and the need for routine protection are supporting consistent demand among adult consumers. Their purchasing decisions are also influenced by product effectiveness, protection duration, ease of application, and suitability for regular use. Additionally, adults frequently purchase insect repellents for family members, further strengthening their contribution to overall market demand.
Meanwhile, the kids/children segment is projected to register the fastest growth, with an 8.50% CAGR through 2032, driven by increasing parental awareness of children's exposure to mosquito bites and insect-borne diseases. Parents are becoming more attentive to preventive protection, encouraging demand for age-appropriate formulations with suitable active ingredient concentrations and convenient application formats. Manufacturers are also focusing on developing products with skin-friendly formulations, clear usage instructions, and packaging designed for convenient application. These factors are supporting the growing adoption of insect repellents intended for children.

By Distribution Channel:
E-commerce Transforms AccessIn 2026, supermarkets and hypermarkets accounted for the largest share of the insect repellent market's distribution channel at 42.50%. This is supported by their extensive retail networks, established consumer shopping habits, and ability to offer a wide selection of insect protection products in one place. Strong shelf visibility, competitive pricing, promotional discounts, and seasonal merchandising encourage consumers to purchase insect repellents alongside regular household and personal care products. The availability of multiple brands and product formulations allows shoppers to compare prices, ingredients, packaging, and product features before making purchasing decisions.
Online retail stores are projected to register the fastest growth, with a CAGR of 7.47% through 2032, driven by the increasing adoption of e-commerce platforms, convenience-oriented shopping behavior, and expanding digital product availability. Online channels provide consumers with access to a broader range of insect repellents, including specialized formulations, natural alternatives, premium products, and different pack sizes that may have limited availability in physical stores. Detailed product descriptions, ingredient disclosures, customer reviews, and price comparisons help consumers evaluate product suitability and make informed purchasing decisions.
Geography Analysis
APAC Insect Repellent Market
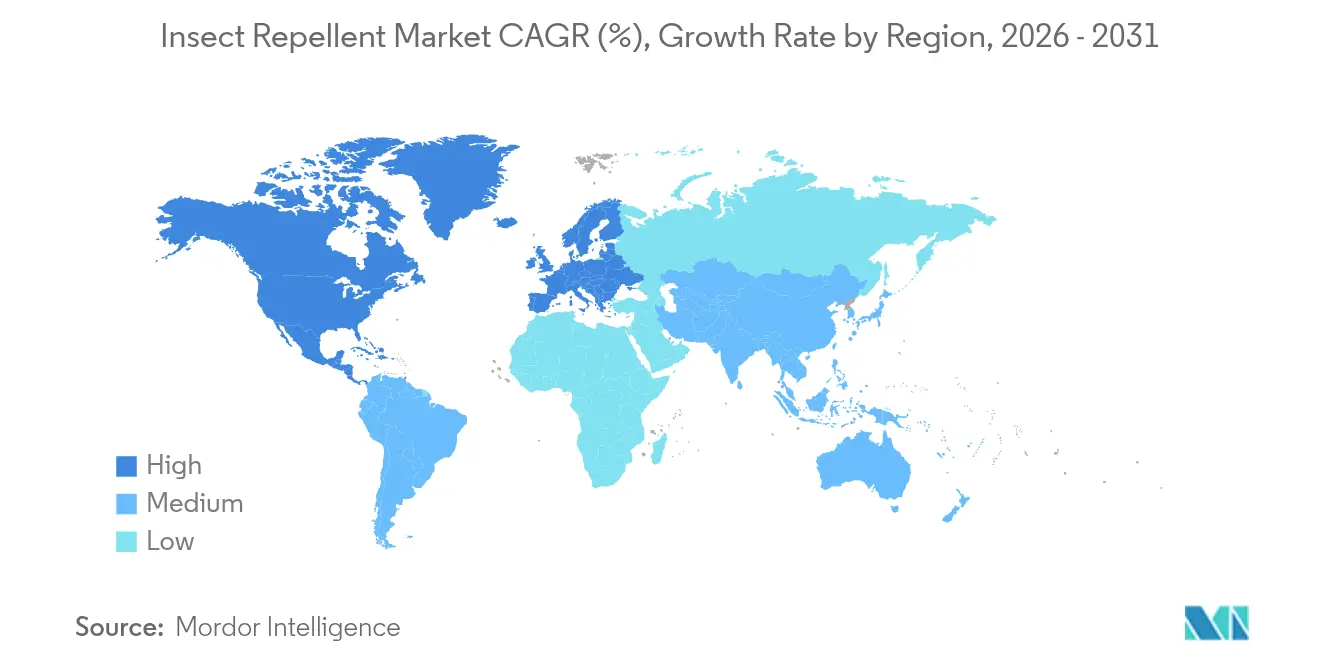
In 2026, Asia-Pacific dominated the insect repellent market, accounting for 48.10% of total revenue. This was supported by widespread mosquito exposure, recurring vector-borne diseases, and the established use of household insect protection products across tropical and subtropical countries. Countries such as India, China, Indonesia, Thailand, and Vietnam face recurring mosquito-related health risks, encouraging the regular use of coils, liquid vaporizers, sprays, and other household repellents. The region also benefits from the availability of affordable products through traditional retail outlets, supermarkets, and convenience stores. Increasing awareness of preventive protection and the gradual adoption of electric vaporizer systems and advanced repellent formulations further support regional demand.
Middle East and Africa Insect Repellent Market
The Middle East and Africa region is projected to register the fastest growth, with a CAGR of 7.47% through 2032. This growth is driven by the persistent prevalence of mosquito-borne diseases, favorable climatic conditions for mosquito breeding, and increasing emphasis on household protection. Warm temperatures, seasonal rainfall, and humid environments across several regional markets create conditions favorable to mosquito proliferation, sustaining the need for preventive insect protection. Growing public health awareness and government-led vector-control initiatives are encouraging households to adopt insect repellent products as part of routine protection practices. Increasing access to affordable coils, sprays, and liquid vaporizers through expanding retail distribution networks is also supporting market penetration.
North America, Europe, and South America Witness Steady Growth
North America, Europe, and South America contribute to market growth through seasonal mosquito activity, disease-prevention awareness, and demand for personal and household protection solutions. In North America, demand is supported by seasonal mosquito exposure, outdoor recreational activities, and increasing consumer awareness of vector-borne diseases. According to the United States Centers for Disease Control and Prevention (CDC), at least 48 West Nile virus cases were reported as of June 30, 2026[3]. This reinforces the importance of preventive mosquito protection and supports demand for personal repellents, sprays, and household insect-control products. In Europe, seasonal mosquito activity and increasing awareness of mosquito-borne infections support the adoption of personal repellents and household protection products. In South America, recurring dengue outbreaks, particularly in Brazil and other tropical markets, sustain demand for sprays, coils, and liquid vaporizers to reduce mosquito exposure.
Competitive Landscape
Market Concentration
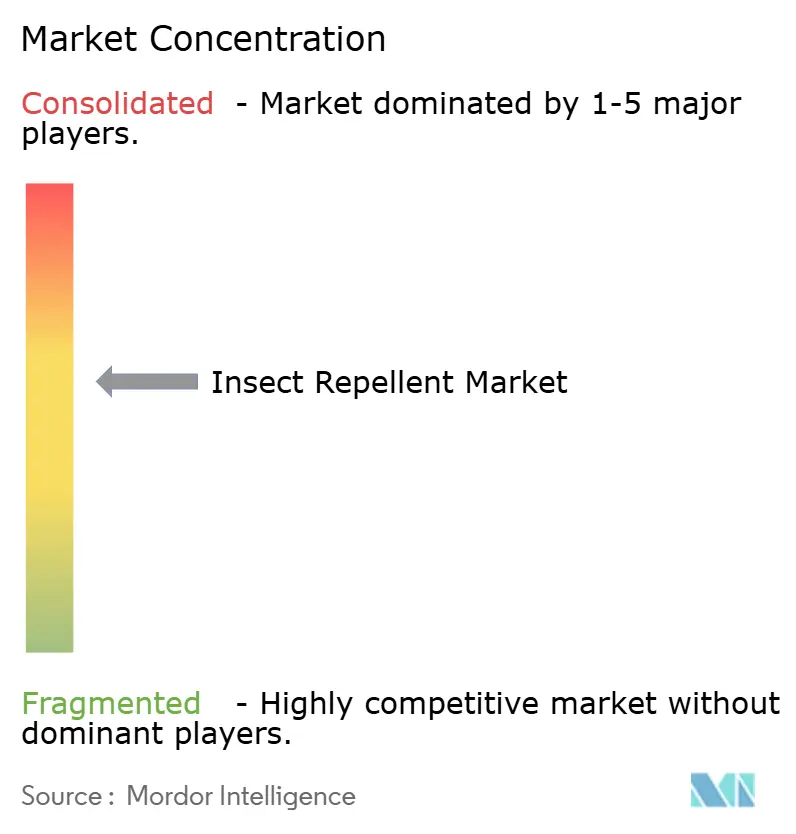
The insect repellent market is moderately fragmented, with established multinational corporations and regional manufacturers competing to strengthen their market positions. Major players include S.C. Johnson & Son, Inc., Reckitt Benckiser Group plc, Spectrum Brands Holdings, Inc., Godrej Industries Group, and Earth Corporation. These companies maintain their competitive positions through strong brand recognition, extensive geographical reach, continuous product innovation, and established customer relationships. The presence of numerous domestic and regional manufacturers further intensifies competition, encouraging companies to focus on differentiation, operational efficiency, and long-term growth strategies.
Major market participants are increasingly focusing on research and development, technological advancements, and strategic investments to strengthen their competitive advantages. Companies are working to improve product effectiveness, enhance safety profiles, and introduce solutions that address evolving consumer expectations. Strategic collaborations, partnerships, and acquisitions enable manufacturers to expand their technological capabilities, strengthen their geographical presence, and improve operational efficiency. Investments in sustainable manufacturing practices and environmentally responsible formulations are also gaining importance as companies respond to changing regulatory requirements and consumer preferences.
Competition is further shaped by geographical expansion, manufacturing optimization, and brand positioning. Established players are strengthening their presence in high-growth markets through localized business strategies, capacity enhancements, and investments in research infrastructure. Regional manufacturers are leveraging cost advantages, local market knowledge, and flexible production capabilities to compete with multinational companies. Increasing regulatory scrutiny regarding chemical safety, environmental impact, and product efficacy is encouraging manufacturers to strengthen compliance capabilities and quality standards. These developments are expected to sustain competitive intensity and drive innovation across the global insect repellent market.
Insect Repellent Industry Leaders
-
S.C. Johnson & Son Inc.
-
Reckitt Benckiser Group PLC
-
Godrej Industries Group
-
Spectrum Brands Holdings Inc.
-
Earth Corporation
- *Disclaimer: Major Players sorted in no particular order
Insect Repellent Market Companies Covered in this Report
- S.C. Johnson & Son Inc.
- Reckitt Benckiser Group PLC
- Spectrum Brands Holdings Inc.
- Godrej Industries Group
- Earth Corporation
- Henkel AG & Co. KGaA
- Tiger Brands Ltd
- ST Corp (Considered Enesis Group)
- Cheerwin Group Co Ltd
- Jyothy Labs Limited
- Sawyer Products Inc.
- Dainihon Jochugiku Co Ltd
- Adventure Ready Brands
- The Scotts Miracle-Gro Company
- Procter & Gamble Co
- Fumakilla Ltd
- Southernlabs Private Limited
- Zhongshan Lanju Daily Chemical Industry Co., Ltd.
- Wondercide LLC.
- Murphy's Naturals, Inc.
Recent Industry Developments in Insect Repellent Market
- October 2026: veready Industries India Ltd. entered the mosquito protection category with the launch of the Eveready ULTIMA Liquid Vaporiser, marketed as India's first portable liquid vaporiser. This launch represents a further step in Eveready's strategy of diversifying into relevant consumer categories.
- February 2026: Major League Fishing has partnered with the OFF! brand, making OFF! the official mosquito and tick repellent of Major League Fishing. This partnership aims to protect anglers and attendees from mosquitoes and ticks during extended periods outdoors.
- June 2025: Mimikai launched its first line of DEET-free insect and tick repellents that utilize natural ingredients for effective bite protection. The product was developed based on an innovation licensed from North Carolina State University.
Insect Repellent Market Report Scope and Research Methodology
Market Definition and Coverage
This market covers consumer and household insect repellent products that are bought to reduce insect bites and nuisance insects, and the market value is measured by sales of finished repellent products across channels and regions.
Scope exclusions: Professional pest control services and crop protection insecticides are excluded, even if they help manage insects.
Segments Covered in This Report
- By Product Type
- Bait
- Coils
- Sprays/Aerosols
- Mats
- Liquid Vaporizer
- Other Product Types
- By Ingredient Type
- Natural Insect Repellent
- Conventional Insect Repellent
- By End User
- Adults
- Kids/Children
- By Distribution Channel
- Supermarkets/Hypermarkets
- Convenience Stores
- Online Retail Stores
- Other Distribution Channels
- By Geography
- North America
- United States
- Canada
- Mexico
- Rest of North America
- Europe
- United Kingdom
- Germany
- France
- Italy
- Spain
- Russia
- Sweden
- Belgium
- Poland
- Netherlands
- Rest of Europe
- Asia-Pacific
- China
- Japan
- India
- Thailand
- Singapore
- Indonesia
- South Korea
- Australia
- New Zealand
- Rest of Asia-Pacific
- South America
- Brazil
- Argentina
- Colombia
- Chile
- Rest of South America
- Middle East and Africa
- United Arab Emirates
- South Africa
- Saudi Arabia
- Nigeria
- Egypt
- Morocco
- Turkey
- Rest of Middle East and Africa
- North America
Data Sources, Market Sizing, and Validation
Desk Research
Desk work starts with building the demand context, so we can see where repellent usage is structurally higher and where it is seasonal. We used public health and population indicators from sources such as the World Health Organization, the US CDC, and national health ministries to map disease risk signals and prevention guidance that influence purchase behavior.
We also reviewed regulatory and ingredient context and tracked it through sources such as the US EPA, the European Chemicals Agency, and peer reviewed toxicology and entomology journals, because ingredient approvals and label claims affect what can be sold and at what price. Trade and distribution direction was checked using sources such as UN Comtrade, national statistics agencies, retailer and marketplace category pages, and company filings and investor presentations for broad channel mix clues. For hard to find company revenue splits and product mix hints, we selectively used paid subscriptions focused on company financials and company intelligence, plus a patent database to understand innovation activity. This list is illustrative only, and many other public sources and documents were also referred to for data collection, validation, and research clarification.
Primary Interviews and Surveys
Primary work was used to pressure test assumptions that desk sources do not fully answer, especially around typical price ladders, how shoppers switch between natural and conventional options, and how indoor electric formats behave versus topical formats. We spoke with a mix of brand and category leaders, distributors, and channel facing experts across APAC, EMEA, and the Americas, then used their feedback to triangulate adoption patterns, seasonality, and promotion intensity before finalizing the model.
Distribution of primary research fieldwork respondents
| Company type | Respondent position | Region |
|---|---|---|
| Top tier: 36% | CXOs: 14% | APAC: 44% |
| Mid tier: 46% | Functional/Unit leaders: 34% | EMEA: 29% |
| Smaller Players: 18% | Managers: 52% | Americas: 27% |
Market-Sizing & Forecasting
The core sizing is built using a top-down approach where population, household formation, and repellent usage rates are translated into a demand pool by region, and then value is formed by applying realistic average selling prices by major format groups. To keep the math grounded, we cross checked totals using selective bottom-up approximations such as sampled channel price checks, a few supplier revenue directional splits gathered in interviews, and volume to value sanity checks during peak season months.
Inputs that typically matter in this market include the length and intensity of the mosquito season by geography, reported incidence and outbreak news cycles for vector borne diseases, the mix shift between topical and indoor electric formats, the share of natural versus conventional ingredient products, and the offline to online channel split. Price paths were not assumed to rise in a straight line, and instead they were adjusted for promo depth, pack size mix, and inflation pass through expectations that we heard consistently from respondents.
For forecasting, scenario analysis was used because demand can change sharply in some years due to weather events, outbreaks, and policy campaigns, and those shifts are not always captured well by a single smooth trend line. Where a small country had limited public indicators, we filled gaps with proxy signals from similar climate and income peers, then rechecked those proxies with interview feedback before locking the forecast.
Data Validation & Update Cycle
We validate outputs by triangulating the model against independent signals, such as regional disease prevention pushes, import trends for key finished formats where relevant, and major channel pricing bands seen in the market. If a country result looks out of pattern, we reopen the assumptions and check again, and we trigger follow up calls when the variance cannot be explained by seasonality or channel mix.
Before sign off, the work is reviewed in steps so the calculation logic, currency conversions, and year to year growth rates stay consistent across regions and formats. The report is refreshed annually, and interim updates are made when a material event occurs, such as a regulatory change on a major active ingredient or a large demand swing tied to an outbreak. Right before delivery, a final pass is done so clients receive the latest updated view.
Mordor Intelligence's Insect Repellent Market Estimate Compared With Other Published Estimates
Published market values for insect repellents can differ a lot, even when the titles look similar, because each publisher groups products differently and does not always treat channel pricing and currency timing the same way. Differences in the base year, how seasonality is handled, and whether the estimate is built from demand signals or from supply proxies can also move the number.
Pet insect repellent products sit outside Mordor Intelligence's scope, which is one reason some published totals look lower or higher when they mix human use products with adjacent categories. The other common gap drivers are how electric indoor formats and refills are counted, whether online pricing is treated as transaction price or list price, and whether optimistic or conservative outbreak scenarios are embedded into the current year rather than into the forecast window.
Benchmark comparison
| Source | Market Size | Gaps in Research Methodology |
|---|---|---|
| Mordor Intelligence | USD 11.40 B (2026) | |
| Global Consultancy A | USD 12.63 B (2025) | Uses a different base year and may treat end uses more broadly, which can pull in additional institutional consumption and shift value through channel pricing assumptions. |
| Industry Research Publisher B | USD 6.00 B (2025) | Appears to include pet repellents as a named segment and can also differ on which electric indoor formats and refill revenues are counted, which compresses the value if scope is narrower in other parts of the basket. |
Taken together, the spread is mainly explained by what gets counted as a finished repellent product, the year used for the snapshot, and how prices are normalized across channels and regions. By tying the estimate back to clear demand indicators, practical format level pricing, and repeatable checks, we keep the final market value traceable and easier to reconcile.
Key Questions Answered in the Report
What is the forecast value of the insect repellent market in 2032?
The global insect repellent market is projected to reach USD 15.38 billion by 2032, growing at a CAGR of 6.12% between 2027 and 2032.
Which product category is expanding the fastest?
Liquid vaporizers are the fastest-growing product category, with a projected CAGR of 7.51% through 2032, driven by demand for continuous indoor insect protection.
How large is Asia-Pacific’s contribution?
Asia-Pacific accounted for 48.10% of the global insect repellent market share in 2026, making it the largest regional market.
Why are natural insect repellents gaining popularity?
Growing consumer preference for botanical ingredients and plant-based formulations is supporting demand for natural insect repellents. This segment is projected to grow at a CAGR of 8.44% between 2027 and 2032.
Which distribution channel is growing most quickly?
Online retail is advancing at an 8.55% CAGR as direct-to-consumer models and subscription services gain traction.
What factors are restraining growth?
Competition from treated clothing and public concern over chemical ingredients are the principal market headwinds.