Innovation Management Market Size and Share
Market Overview
| Study Period | 2020 - 2031 |
|---|---|
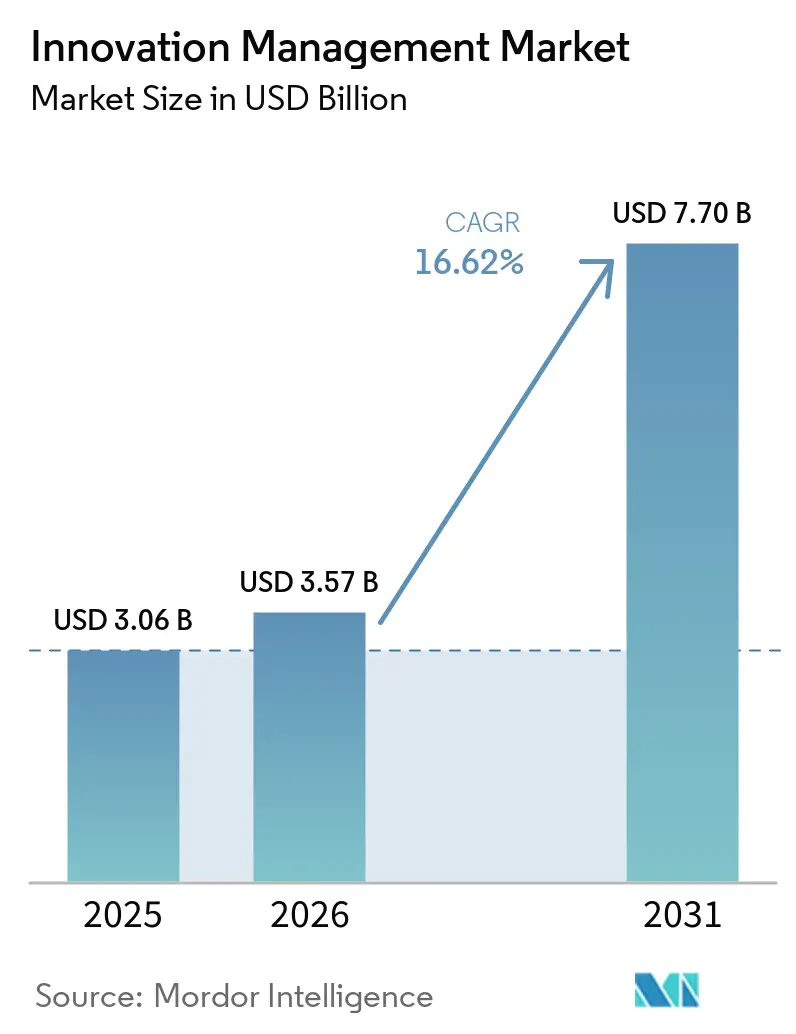
| Market Size (2026) | USD 3.57 Billion |
| Market Size (2031) | USD 7.70 Billion |
| Growth Rate (2026 - 2031) | 16.62% CAGR |
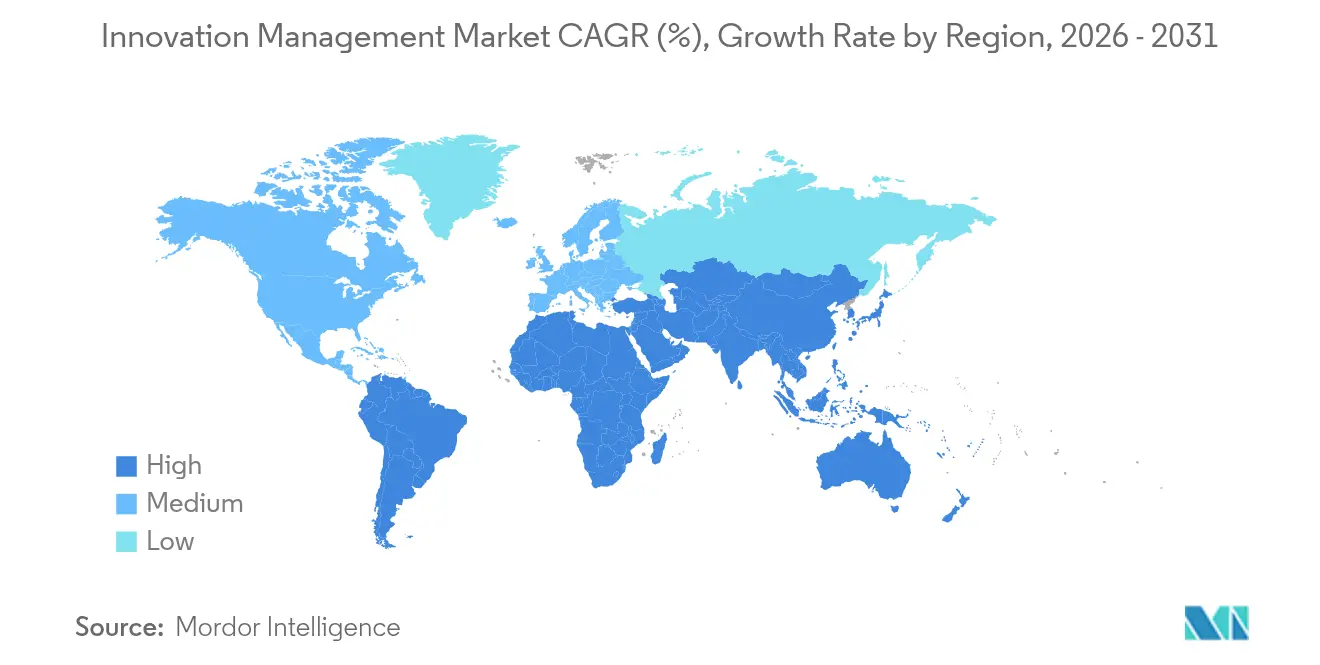
| Fastest Growing Market | Asia Pacific |
| Largest Market | North America |
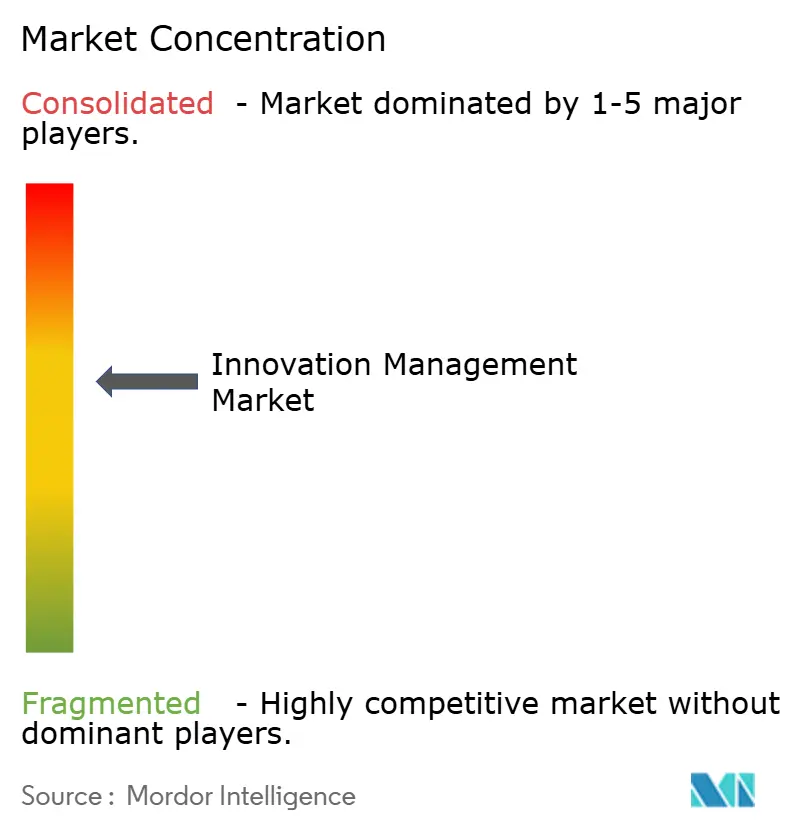
| Market Concentration | Medium |
Major Players *Disclaimer: Major Players sorted in no particular order Image © Mordor Intelligence. Reuse requires attribution under CC BY 4.0. | |
Innovation Management Market Analysis by Mordor Intelligence
Innovation management market size in 2026 is estimated at USD 3.57 billion, growing from 2025 value of USD 3.06 billion with 2031 projections showing USD 7.7 billion, growing at 16.62% CAGR over 2026-2031. The up-swing is fueled by cloud-first procurement mandates, the rapid infusion of artificial intelligence into ideation workflows, and mounting competitive pressure for continuous differentiation. North America currently anchors demand, yet Asia-Pacific records the steepest climb as regional enterprises channel growing RandD and generative-AI budgets into systematic innovation programs. Healthcare, telecommunications, and financial services deploy platforms at scale, while small and medium enterprises (SMEs) accelerate adoption thanks to subscription-based, cloud-native offerings that avoid heavy infrastructure outlays. Convergence between innovation management suites and project-execution, HR, and design tooling is steadily redefining buyer expectations for unified governance, analytics, and commercialization support.
Key Report Takeaways
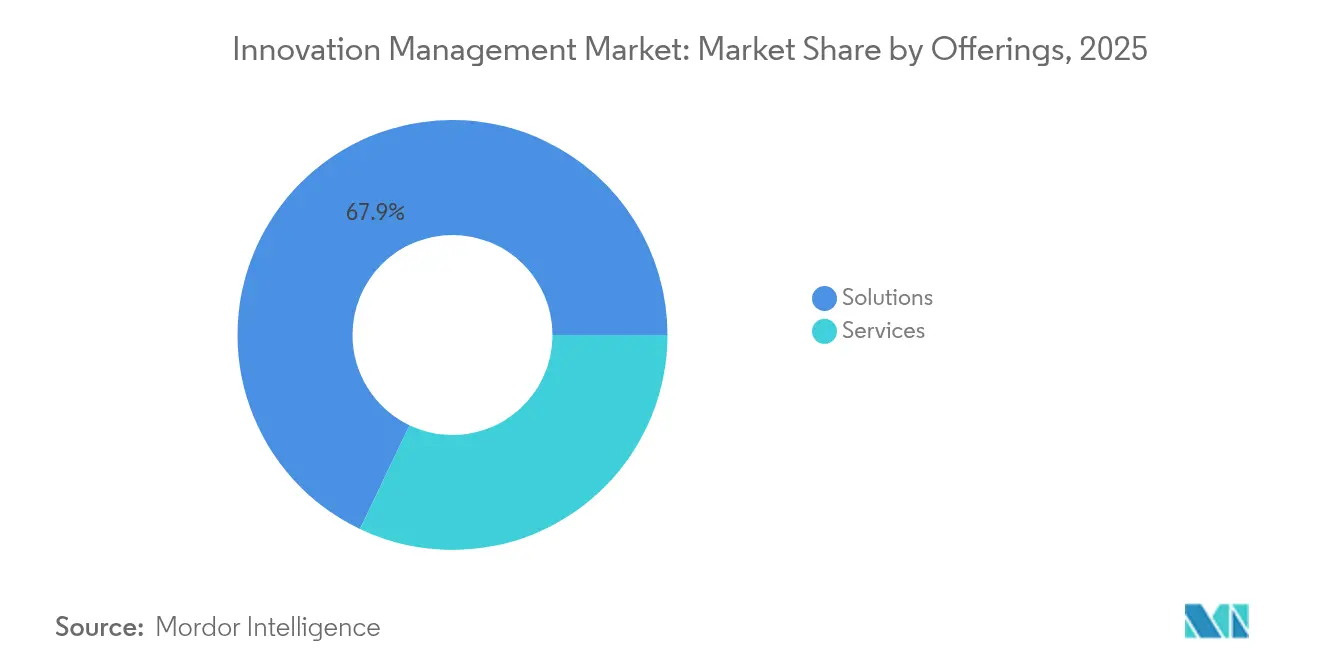
- By offering, solutions captured 67.92% of innovation management market share in 2025; services are set to grow at a 19.12% CAGR through 2031.
- By end-user enterprise size, large organizations held 58.05% of the innovation management market size in 2025, while SMEs expand at a 21.05% CAGR.
- By deployment, cloud models accounted for 76.35% of the innovation management market size in 2025 and are projected to post a 22.85% CAGR.
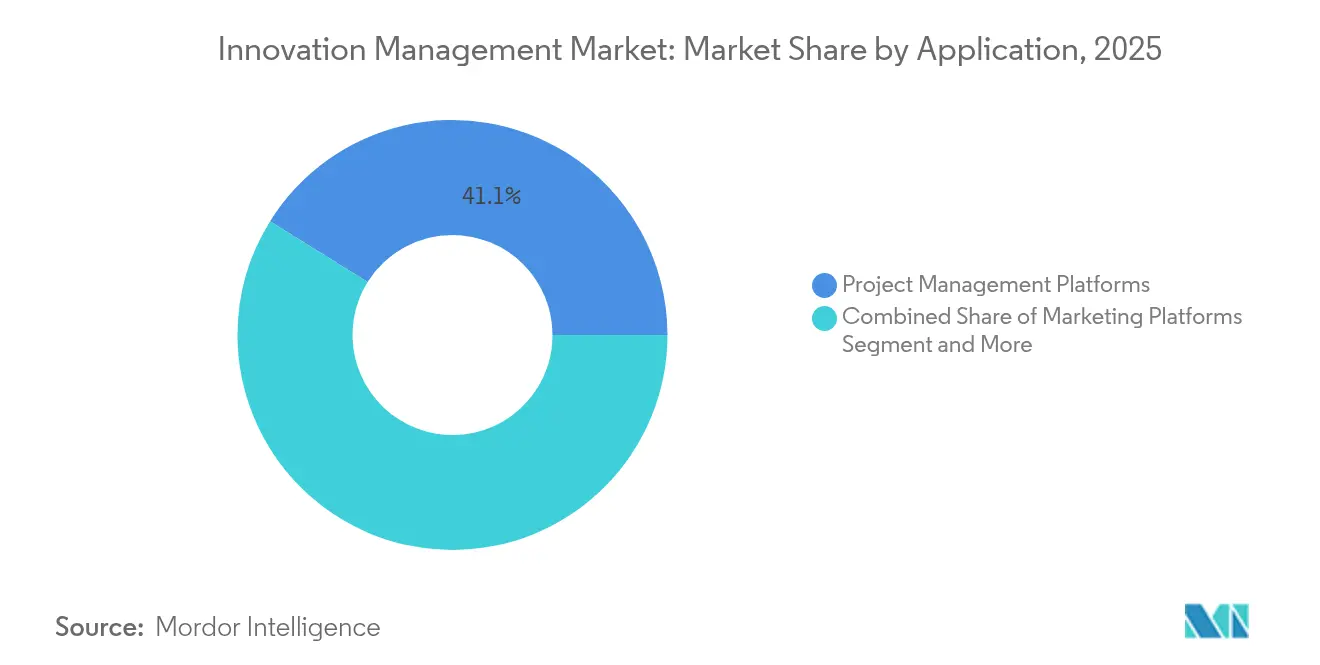
- By application, project-management platforms led with 41.12% of innovation management market share in 2025; HR platforms represent the fastest-rising application at a 19.75% CAGR.
- By end-user vertical, healthcare innovations advance at a 21.3% CAGR, overtaking IT and telecom for fastest growth momentum.
Note: Market size and forecast figures in this report are generated using Mordor Intelligence’s proprietary estimation framework, updated with the latest available data and insights as of 2026.
Global Innovation Management Market Trends and Insights
Drivers Impact Analysis*
| Driver | (~) % Impact on CAGR Forecast | Geographic Relevance | Impact Timeline |
|---|---|---|---|
| Ongoing digital transformation across industries | +3.2% | Global, with North America and Europe leading adoption | Medium term (2-4 years) |
| Rising enterprise RandD budgets | +2.8% | Global, concentrated in developed markets | Long term (≥ 4 years) |
| Cloud-first procurement policies | +2.5% | Global, with Asia-Pacific showing highest growth rates | Short term (≤ 2 years) |
| Expanding open-innovation ecosystems | +2.1% | North America and Europe core, spillover to Asia-Pacific | Medium term (2-4 years) |
| AI-enabled ideation quality scoring | +1.9% | Global, with early adoption in tech-forward regions | Short term (≤ 2 years) |
| Mandatory sustainability-linked innovation targets | +1.7% | Europe and North America leading, expanding globally | Long term (≥ 4 years) |
| Ongoing digital transformation across industries | +3.2% | Global, with North America and Europe leading adoption | Medium term (2-4 years) |
| Source: Mordor Intelligence | |||
Ongoing Digital Transformation Across Industries
Digital transformation initiatives in the innovation management market compel organizations to replace isolated suggestion boxes with integrated ideation, evaluation, and commercialization frameworks that embed analytics and workflow orchestration. Executives increasingly regard trustworthy AI as a prerequisite for scalable transformation, with 77% of leaders emphasizing the need for transparent systems.[1]Paul Daugherty, “Technology Vision 2025,” Accenture, accenture.com Manufacturing firms integrate Industry 4.0 sensors and analytics into innovation suites, cutting safety incidents by up to 50% while elevating employee participation. Employee-centric design approaches address persistent cultural barriers, opening room for platforms that democratize ideation across hierarchies.
Rising Enterprise RandD Budgets
Escalating RandD outlays in the innovation management market intensify demand for governance tools that trace investment to commercial output. Oracle invested USD 8.6 billion in fiscal 2023 to refine existing products and pioneer new technologies, underscoring the link between large-scale RandD and the need for structured innovation pipelines.[2]“2024 Annual Report,” Oracle Corporation, oracle.com Consulting leader Accenture allocates USD 1.2 billion each year to exploration labs and USD 1.1 billion to workforce upskilling, aligning human-capital programs with platform-driven innovation tracking. Financial-services players follow suit, expanding AI and cloud budgets to protect revenue streams in a tightening margin environment.
Cloud-First Procurement Policies
Public-sector buying rules and corporate board mandates increasingly stipulate cloud-native solutions, propelling the innovation management market toward multi-tenant architectures that lower costs and accelerate feature releases. NetSuite’s deployment model illustrates how unified instances stream security updates across tenants with minimal downtime.[3]“Why NetSuite Uses True Multi-Tenancy,” Oracle NetSuite, netsuite.com Sovereign-cloud options satisfy European data-residency requirements, balancing compliance with elasticity. Yet migration complexity persists, driving demand for professional services and managed-integration specialists.
AI-Enabled Ideation Quality Scoring
Artificial intelligence shifts idea evaluation from intuition to evidence-backed scoring. ITONICS and other providers pair large language models with trend databases to surface high-value concepts faster, reducing the “idea overload” bottleneck. Predictive engines profile financial feasibility and market readiness, enabling product teams to compress decision cycles. Algorithmic bias remains a watchpoint, prompting vendors to introduce auditable models and explainable-AI dashboards to reassure compliance officers.
Restraints Impact Analysis*
| Restraint | (~) % Impact on CAGR Forecast | Geographic Relevance | Impact Timeline |
|---|---|---|---|
| Complexity of multi-tenant integrations | -2.3% | Global, particularly affecting cloud-first organizations | Short term (≤ 2 years) |
| Data-sovereignty and IP leakage concerns | -1.8% | Europe and Asia-Pacific leading, expanding globally | Medium term (2-4 years) |
| Organizational culture inertia | -1.5% | Global, with traditional industries most affected | Long term (≥ 4 years) |
| Algorithmic bias in idea-ranking engines | -0.9% | Developed markets with advanced AI adoption | Short term (≤ 2 years) |
| Source: Mordor Intelligence | |||
Complexity of Multi-Tenant Integrations
Enterprises balancing cost efficiency with customization often discover that connecting cloud innovation suites to dozens of legacy systems strains internal IT bandwidth. ServiceNow’s multi-instance architecture demonstrates the trade-off: higher isolation but heavier upgrade coordination. Insurance carriers and manufacturers grapple with identity-management, data-mapping, and compliance testing across each tenant, amplifying demand for specialized integration partners.
Data-Sovereignty and IP Leakage Concerns
As innovation records house patent sketches, formulations, and strategic roadmaps, organizations intensify safeguards against cross-border data flows. U.S. economic estimates peg national IP theft losses as high as USD 600 billion annually, elevating the priority of encryption, digital-signature chains, and immutable audit trails. Europe enforces strict personal-data and trade-secret regimes, while South Korea’s courts have handed down prison sentences for unauthorized technology transfers, reinforcing the legal stakes. Vendors respond with region-specific hosting zones, key-management services, and zero-knowledge architectures.
*Our forecasts treat driver/restraint impacts as directional, not additive. The impact forecasts reflect baseline growth, mix effects, and variable interactions.
Segment Analysis
By Offerings: Solutions Dominate Platform Integration
Solutions accounted for 67.92% of innovation management market share in 2025, demonstrating that buyers favor unified platforms spanning ideation capture, stage-gate governance, and portfolio analytics within a single user experience. Bundled AI models, low-code workflow builders, and pre-built API connectors continue to raise the bar for all-in-one suites. Professional services, although smaller, grow briskly at 19.12% CAGR as enterprises seek advisory support for change management, algorithm calibration, and integration workstreams. Accenture’s consulting arm reported USD 5.068 billion in quarterly revenue, signaling healthy demand for specialized deployment services that keep transformation programs on schedule.
Demand for post-implementation optimization also propels the services category. Continuous-improvement retainers address new feature rollouts, employee-training refreshers, and performance benchmarking. As multi-tenant feature releases accelerate, organizations contract platform partners to recalibrate innovation KPIs, ensuring that fresh analytics models align with shifting strategic objectives. This dynamic positions managed-service providers as pivotal allies for sustaining innovation velocity over the platform life cycle.


By End-user Enterprise Size: SMEs Drive Adoption Acceleration
Large enterprises commanded 58.05% of innovation management market size in 2025, leveraging dedicated RandD budgets and in-house architecture teams to integrate suites across product-lifecycle, HR, and customer-experience systems. Nonetheless, SMEs represent the most dynamic cohort, expanding at a 21.05% CAGR as subscription pricing, turnkey cloud deployments, and guided-onboarding programs shrink historic entry barriers. The innovation management market caters to SME pain points—budget ceilings and talent shortages—via template libraries, no-code integrations, and AI-assisted road-mapping tools.
Regional policy incentives further buoy SME adoption. European Union funds channel grants toward digitalization projects, while North American development banks underwrite cloud migrations. To counter capability gaps, vendors bundle virtual coaching and community forums that share best practices for engaging cross-functional teams, nurturing a culture of distributed ideation. Such wraparound support compresses ramp-up timelines and heightens platform stickiness among resource-constrained businesses.
By Deployment: Cloud Architecture Transforms Innovation
Cloud deployments held 76.35% of the innovation management market size in 2025 and are set to grow 22.85% annually as multitenancy unlocks faster upgrades and lower total cost of ownership. Unified code branches allow vendors to roll out AI engines, connectors, and security patches simultaneously for all clients, accelerating time-to-value. On-premises installations persist in defense, life-sciences, and energy firms that must store data within controlled facilities; however, maintenance overhead and scalability limits temper that model’s future share.
Hybrid blueprints are gaining traction, letting sensitive datasets reside in private zones while less regulated workloads execute in the public cloud. Infosys expects AI agents, sovereign-cloud frameworks, and cyber-resilience toolkits to dominate cloud roadmaps through 2025. For innovation management vendors, native support for multiple cloud hyperscalers and edge-processing nodes becomes a selling point, especially in manufacturing sites generating high-volume sensor data that feed real-time ideation dashboards.
By Application: Project Management Platforms Lead Integration
Project-management platforms contributed 41.12% of innovation management market share in 2025, cementing their role as the backbone for bridging conceptual design with execution milestones. Embedded predictive analytics flag resource constraints, while portfolio simulators re-prioritize projects as market signals shift. HR-focused innovation modules record the quickest rise, powered by talent-analytics engines that match employee skills to emerging RandD needs, thereby optimizing engagement and retention.
Design-thinking and marketing toolsets integrate customer-journey feedback loops directly into idea screens, assuring that concepts align with unmet user needs. Sopheon reports that organizations using its cross-functional suite shorten commercial launch cycles 15-30% and lift product success rates by up to 50%. Open APIs remain pivotal, letting enterprises embed IP-management, compliance, and external-partner portals to craft domain-specific innovation ecosystems without platform lock-in.
By End-user: Healthcare Accelerates Evidence-Based Innovation
IT and telecom retained 24.63% share in 2025 in the innovation management market, but healthcare now posts the swiftest climb at 21.3% CAGR. Hospitals and life-science firms incorporate AI-driven literature reviews, clinical-trial matching, and post-market surveillance into their innovation pipelines to demonstrate measurable patient-outcome gains. Large language models summarize research findings and flag regulatory-compliance gaps, reducing manual workload for overstretched innovation committees. Payer organizations experiment with hyperautomation to streamline coverage-decision protocols, improving member experience and cost-containment simultaneously.
Elsewhere, financial services capitalize on blockchain and cloud APIs to innovate faster in payments, wealth management, and fraud detection. Government entities implement innovation frameworks to achieve “10x” service improvements, adopting cloud and AI accelerators to redesign citizen-facing processes. Manufacturing, retail, and energy firms integrate Internet-of-Things telemetry to spin real-time insight into iterative product upgrades, reinforcing continuous-improvement mindsets across frontline teams.
Geography Analysis
North America captured 38.22% of innovation management market share in 2025, supported by mature enterprise software ecosystems, abundant venture funding, and broad C-suite acceptance of structured ideation protocols. Microsoft disclosed USD 245 billion in 2024 revenue—a 16% uplift—validating sustained investment cycles that favor innovation suites for orchestrating product and service pipelines. U.S. federal cloud outlays quintupled over eight years, further normalizing cloud-hosted innovation platforms within government and regulated industries. Canada and Mexico augment regional momentum with manufacturing, natural-resources, and fintech deployments, albeit at lower absolute spend.
Asia-Pacific stands as the fastest-growing region, expanding at a 22.1% CAGR through 2031. Enterprises in China, Australia, and Southeast Asia leapfrog legacy IT layers, adopting mobile-first, cloud-native innovation stacks that align with super-app cultures and cashless economies. Domestic AI-model initiatives and data-localization rules stimulate demand for region-tuned innovation suites. Japan and South Korea emphasize sovereign-cloud and IP-protection controls, harmonizing advanced digital infrastructure with rigorous compliance expectations. Local integrators and hyperscalers partner with platform vendors to deliver vertical solution bundles that suit manufacturing, electronics, and public-sector use cases.
Europe records measured yet resilient expansion, propelled by stricter environmental-disclosure regulations and privacy mandates such as GDPR. The EU Corporate Sustainability Reporting Directive motivates firms to embed ESG checkpoints inside innovation workflows, strengthening the business case for auditable platforms. National cloud-sovereignty policies foster a preference for regional data centers and encryption procedures. United Kingdom, Germany, and France spearhead adoption, while southern and eastern nations progress in line with broader digital-economy upgrades. South America, Middle East, and Africa remain nascent frontiers where infrastructure gaps and investment priorities can slow platform uptake, but localized SaaS pricing and government digitalization drives are gradually improving market accessibility.

Competitive Landscape
Competition features a blend of broad enterprise-software powerhouses and focused pure-plays. IBM, SAP, Oracle, and Salesforce cross-sell innovation modules alongside ERP, CRM, and analytics suites, leveraging embedded integrations and established customer success teams. IBM’s software division generated USD 6.336 billion in Q1 2025 with a 29.1% margin, evidencing the profitability of platform-bundling strategies. Accenture, Wipro, and other service majors extend reach through implementation, managed-service, and innovation-outsourcing engagements.
Specialist vendors such as HYPE Innovation, Brightidea, Qmarkets, and Wazoku differentiate through domain-specific features—open-innovation partner scouting, startup-database plug-ins, and AI-driven ideation coaching. Market consolidation gathered pace when Wellspring acquired Sopheon, creating an InnovationOps provider with end-to-end capability coverage. White-space competition centers on SME-friendly pricing, sovereign-cloud support, and bias-mitigation algorithms. Partnerships with hyperscalers and cybersecurity firms grow in importance as clients expect seamless identity-management, encryption, and compliance tooling within the innovation stack. Edge-computing modules, blockchain-based IP ledgers, and sector-specific ontologies now represent emerging product-roadmap differentiators.
Innovation Management Industry Leaders
SAP SE
Oracle Corporation
IBM Corporation
Planview, Inc.
Brightidea, Inc.
- *Disclaimer: Major Players sorted in no particular order

Recent Industry Developments
- March 2024: Wellspring acquired Sopheon, merging technology-transfer, IP-management, and innovation-governance assets into a single InnovationOps suite.
- July 2024: HYPE Innovation purchased Planbox, broadening its North American footprint and integrating agile project-planning features into HYPE Innovate.
- December 2024: HYPE Innovation launched HYPE 11, embedding machine-learning visualizations, AI coaching, and web-clipping summarization into the core platform.
- December 2024: IdeaScale released AI-powered analytics that apply predictive scoring and portfolio optimization to corporate ideation data.


Research Methodology Framework and Report Scope
Market Definitions and Key Coverage
Our study defines the global innovation management market as the full stack of software platforms and associated professional or managed services that help organizations capture ideas, crowdsource feedback, evaluate concepts, allocate budgets, and monitor value realization across the innovation life cycle. These tools sit on cloud or on-premise infrastructure and are licensed on subscription or perpetual models.
Scope exclusion: Offerings limited to generic project-portfolio or product lifecycle management that lack ideation or open-innovation features are left outside our numbers.
Segmentation Overview
- By Offerings
- Solutions
- Services
- By End-user Enterprise Size
- Large Enterprises
- Small and Medium-sized Enterprises (SMEs)
- By Deployment
- Cloud
- On-premises
- By Application
- Project Management Platforms
- Marketing Platforms
- Design Platforms
- HR Platforms
- Other Platforms
- By End-user
- BFSI
- Healthcare
- IT and Telecom
- Media and Entertainment
- Government
- Other End-users
- By Region
- North America
- United States
- Canada
- Mexico
- South America
- Brazil
- Argentina
- Rest of South America
- Europe
- United Kingdom
- Germany
- France
- Italy
- Spain
- Russia
- Rest of Europe
- Asia-Pacific
- China
- India
- Japan
- South Korea
- Australia and New Zealand
- Southeast Asia
- Rest of Asia-Pacific
- Middle East and Africa
- Middle East
- Saudi Arabia
- United Arab Emirates
- Turkey
- Rest of Middle East
- Africa
- South Africa
- Nigeria
- Kenya
- Rest of Africa
- Middle East
- North America
Detailed Research Methodology and Data Validation
Primary Research
Interviews and surveys were completed with software vendors, CIOs, digital-transformation leads, and innovation-program managers across North America, Europe, and Asia Pacific. These discussions clarified license price corridors, average seat counts per deployment, cloud migration pace, and regional demand triggers, letting us close data gaps and validate modeling assumptions.
Desk Research
Mordor analysts started with respected open data pools such as OECD Main Science and Technology Indicators, Eurostat Community Innovation Survey, U.S. National Science Foundation R&D tables, and patent families mined through Questel. We then layered in sector outlooks from bodies like the World Bank, International Data Corporation, and regional ICT trade groups to benchmark digital-transformation spending. Company 10-Ks, S-1s, and investor decks provided pricing, renewal, and client-count clues. Subscription feeds from Dow Jones Factiva and D&B Hoovers helped verify revenue splits across software and services. This menu is illustrative; several other public and paid sources informed additional fact checks.
Market-Sizing & Forecasting
A top-down build that links enterprise R&D outlays, innovation-program prevalence, and average annual platform spend generates the base year value. Supplier roll-ups, channel checks, and sampled price times user calculations provide a selective bottom-up mirror that guides calibration. Key variables tracked include global corporate R&D growth, cloud adoption rate among large enterprises, median software subscription price, and share of firms running formal idea challenges. Forecasts rely on multivariate regression blended with scenario analysis around IT-budget sentiment, with expert panels confirming variable trajectories. When bottom-up inputs are thin, midpoint estimates are anchored to audited financial disclosures before being adjusted for currency effects.
Data Validation & Update Cycle
Outputs pass a three-layer review covering variance scans, anomaly flags, and peer sign-off. We refresh every twelve months and trigger rapid updates after material events such as landmark acquisitions or regulation shifts. A final analyst sweep is performed immediately before report delivery to ensure clients receive the freshest view.
Why Mordor's Innovation Management Baseline Deserves Trust
Estimates across publishers differ because each firm selects unique market boundaries, exchange-rate dates, and refresh cadences, while a few rely on unvetted vendor claims that inflate totals.
Benchmark comparison
| Market Size | Anonymized source | Primary gap driver |
|---|---|---|
| USD 3.06 B (2025) | Mordor Intelligence | - |
| USD 2.64 B (2024) | Global Consultancy A | Excludes managed-service revenue and applies fixed 8 percent ASP erosion |
| USD 1.68 B (2024) | Industry Association B | Counts software only, omits cloud enablement fees and mid-year currency rebasings |
| USD 1.69 B (2024) | Trade Journal C | Uses vendor press releases without triangulation or patent-database cross-checks |
Taken together, the comparison shows how Mordor's disciplined scope, dual-sided modeling, and annual refresh give decision-makers a balanced, transparent baseline they can retrace and confidently defend.


Key Questions Answered in the Report
What is the current size of the innovation management market?
The innovation management market stands at USD 3.57 billion in 2026 and is projected to reach USD 7.7 billion by 2031.
Which region is growing fastest for innovation management platforms?
Asia-Pacific registers the highest growth, advancing at a 22.1% CAGR through 2031 as enterprises increase generative-AI and cloud investments.
Why are SMEs adopting innovation management software more rapidly?
Subscription cloud models, template libraries, and AI-guided onboarding reduce upfront costs and skill-requirements, propelling SME uptake at a 21.05% CAGR.
How does cloud deployment influence the market?
Cloud models deliver 76.35% of current revenue and grow 22.85% annually thanks to multi-tenant cost efficiency, rapid feature release cycles, and easier integrations.
Which end-user segment shows the fastest CAGR?
Healthcare leads with a 21.3% CAGR as hospitals and life-science firms embed evidence-based decision tools into clinical and RandD workflows.
Page last updated on:


