
Market Overview
| Study Period | 2020 - 2031 |
|---|---|
| Forecast Data Period | 2026 - 2031 |
| Base Year Market Size (2025) | USD 33.40 Billion |
| Market Size (2026) | USD 34.82 Billion |
| Market Size (2031) | USD 42.9 Billion |
| Growth Rate (2026 - 2031) | 4.26 % |
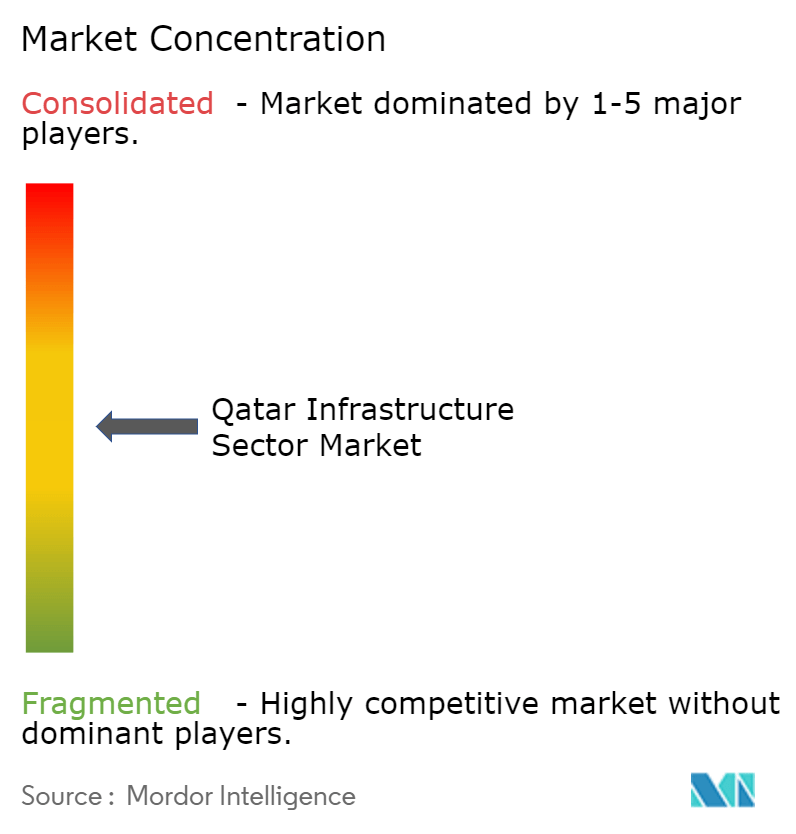
| Market Concentration | Medium |
Major Players *Disclaimer: Major Players sorted in no particular order Image © Mordor Intelligence. Reuse requires attribution under CC BY 4.0. | |
Qatar Infrastructure Market Analysis by Mordor Intelligence
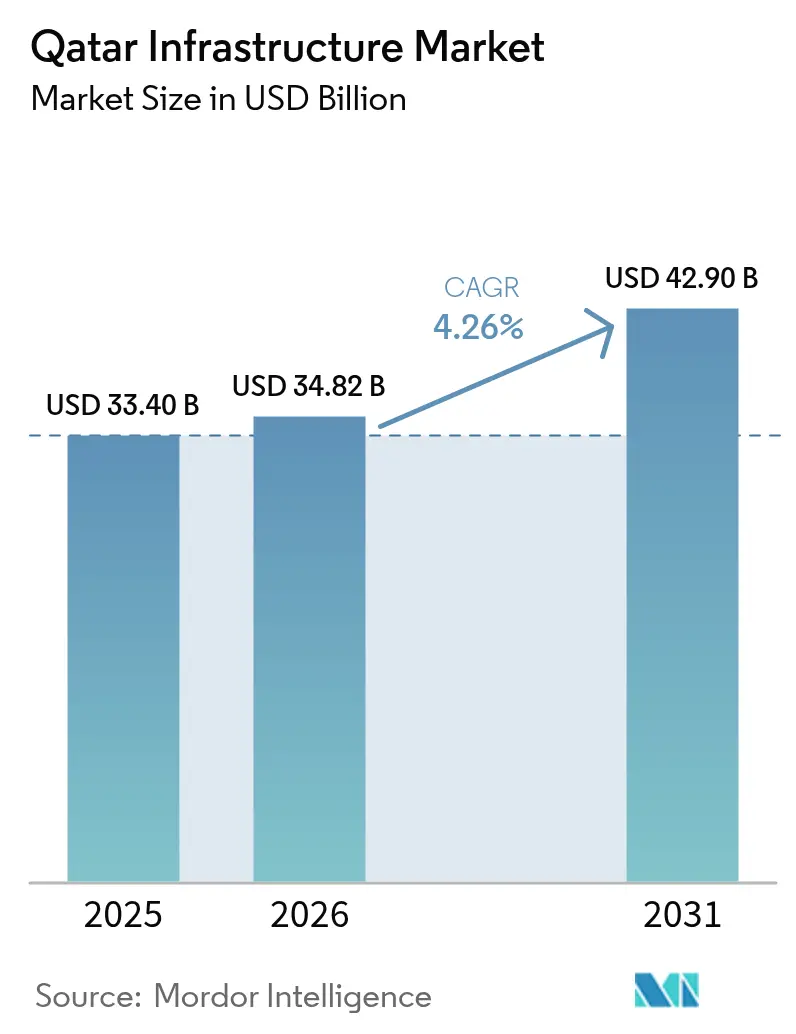
The Qatar Infrastructure Sector Market size is expected to grow from USD 33.40 billion in 2025 to USD 34.82 billion in 2026 and is forecast to reach USD 42.9 billion by 2031 at 4.26% CAGR over 2026-2031. The sustained expansion rests on the Third National Development Strategy’s mandate to diversify the economy, the USD 22.2 billion five-year capital plan from the Public Works Authority, and the country’s rapid digital-infrastructure rollout that has already delivered median 5G download speeds above 520 Mbps.[1]Public Works Authority, “Five-Year Plan 2025-2029” The transportation build-out dominates spending as seven new expressways, metro extensions, and Hamad Port upgrades seek to convert Qatar into a pivotal Gulf logistics node. LNG capacity expansion from 77 MTPA to 142 MTPA under the North Field project funnels multibillion-dollar EPC contracts into marine works, processing complexes, and export terminals. Growing private participation—enabled by 100% foreign-ownership rules—signals deeper public-private collaboration, while tightening green-building codes create an emerging renovation niche that rewards contractors offering low-carbon methods.
Key Report Takeaways
- By infrastructure segment, Transportation captured 36.95% of the Qatar infrastructure construction market share in 2025. Qatar infrastructure construction market size for transportation is projected to grow at a 5.05% CAGR between 2026-2031.
- By construction type, New-build projects captured 74.40% of the Qatar infrastructure construction market share in 2025. Qatar's infrastructure construction market size for new-build projects is projected to grow at a 4.64% CAGR between 2026-2031.
- By investment source, Public funding captured 69.55% of the Qatar infrastructure construction market share in 2025. Qatar infrastructure construction market size for public funding is projected to grow at a 4.78% CAGR between 2026-2031.
- By city, Doha captured 54.20% of the Qatar infrastructure construction market share in 2025. Qatar infrastructure construction market size for Doha is projected to grow at a 4.62% CAGR between 2026-2031.
- Gulf Housing & Construction Co., Al Jaber Engineering, Consolidated Contractors Company, and Vinci SA together controlled 27.65% of the Qatar infrastructure construction market share in 2025.
Note: Market size and forecast figures in this report are generated using Mordor Intelligence’s proprietary estimation framework, updated with the latest available data and insights as of 2026.
Qatar Infrastructure Market Trends and Insights
Drivers Impact Analysis*
| Driver | (~) % Impact on CAGR Forecast | Geographic Relevance | Impact Timeline |
|---|---|---|---|
| Qatar National Vision 2030 investment push | +1.8% | Doha, Al Rayyan, secondary cities | Long term (≥ 4 years) |
| North Field LNG expansion | +1.2% | Offshore blocks, port districts | Medium term (2-4 years) |
| 5G and fiber rollout | +0.8% | Urban cores first | Medium term (2-4 years) |
| Renewable-grid upgrades | +0.6% | Industrial corridors, metros | Long term (≥ 4 years) |
| Source: Mordor Intelligence | |||
Qatar National Vision 2030 Investment Push
Qatar National Vision 2030 frames an economic diversification roadmap that places infrastructure at its core. The January 2024 development strategy seeks 4% annual non-hydrocarbon GDP growth and 2% productivity gains by 2030. The government targets USD 100 billion in foreign direct investment, channeling capital into logistics corridors, manufacturing parks, and tourism precincts. Early results show rising PPP deal flow and smoother approval processes, reinforcing a self-sustaining cycle of state priming followed by private follow-on investment.
North Field LNG Expansion
The North Field expansion lifts LNG capacity from 77 MTPA to 142 MTPA by 2030. Four mega trains, carbon-capture modules, and 250 km of pipelines underpin the energy segment of the Qatar infrastructure construction market. This multibillion-dollar program secures long-dated EPC orders, spurs port and storage upgrades, and pushes contractors toward higher technical capabilities, thus reshaping competition.
5G and Fiber Rollout
Nationwide 5G coverage and median mobile download speeds above 520 Mbps place Qatar at the top of global rankings. Telecom operators and equipment suppliers are modernising core and radio layers, prompting data-center builds and edge-computing sites that broaden the Qatar infrastructure construction market. The ICT sector is projected to grow 8.5% annually, supporting smart-city platforms and AI adoption.
Renewable-Grid Upgrades
Solar capacity targets of 4 GW by 2030 and fresh grid interconnections demand new substations, 212 km of high-voltage cabling, and hybrid storage systems. KAHRAMAA’s USD 851 million contract awards in 2025 mark the first wave of execution. Renewable integration reduces gas peaking needs yet raises engineering complexity, encouraging specialist contractors to enter the Qatar infrastructure construction market.
Restraints Impact Analysis*
| Restraint | (~) % Impact on CAGR Forecast | Geographic Relevance | Impact Timeline |
|---|---|---|---|
| Material-price volatility | -0.7% | Nationwide, mega-projects | Short term (≤ 2 years) |
| Skilled-labor constraints | -0.5% | Complex engineering sites | Medium term (2-4 years) |
| Source: Mordor Intelligence | |||
Surging Material and Equipment Costs Due to Persistent Global and Regional Supply-Chain Disruptions
Economic and regulatory factors account for 41% of construction-material price variation, as steel, cement, and specialist components fluctuate with freight bottlenecks. Tender prices face downward pressure, yet volatile inputs threaten contractor margins. Policy proposals include a domestic price index, risk-sharing contracts, and stable import duties to protect project bankability.
Labour Market Constraints from Expatriate Visa Policies Limiting Availability of Skilled Construction Workforce
Expatriates outnumber nationals seven to one, but post-event demobilisation, wage disputes, and visa hurdles strain workforce supply. A Labor Market Information System and a Workforce Planning Committee aim to align demand and skills. Reforms that allow smoother job changes and promote vocational training are critical for timely project delivery.
*Our forecasts treat driver/restraint impacts as directional, not additive. The impact forecasts reflect baseline growth, mix effects, and variable interactions.
Segment Analysis
By Infrastructure Segment: Transport Networks Anchor Logistics Ambitions
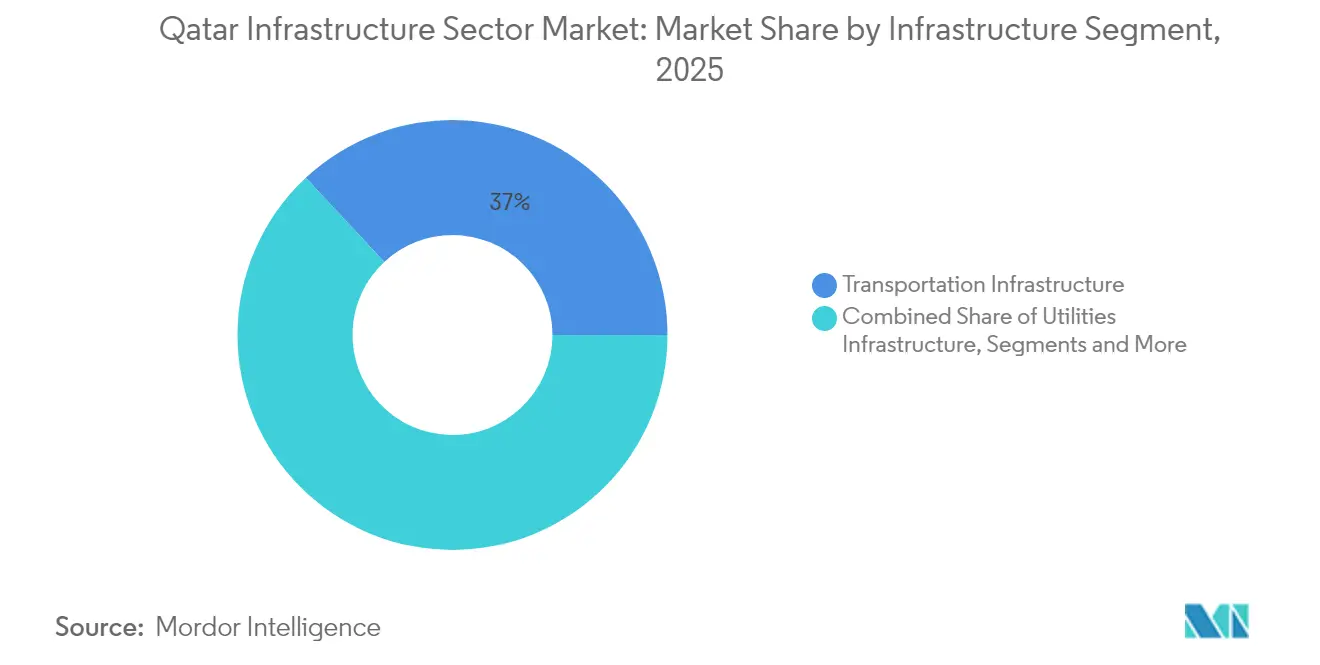
Transport works generated 36.95% of the Qatar infrastructure construction market size in 2025. Seven expressways spanning 900 km, 200 bridges, and 30 tunnels are planned to elevate highway capacity by 2030, while the Doha Metro’s phase-two extension adds 72 km of track to link new residential clusters. Port reform sees automated cranes and deeper berths at Hamad Port, advancing the country’s re-export potential. Utilities ranked second, buoyed by USD 851 million substation orders and the USD 3.7 billion Ras Abu Fontas water-and-power complex that will supply 2,400 MW and 110 million IGD. Social infrastructure benefits from USD 6.04 billion health and USD 5.33 billion education allocations, upgrading hospitals and adding 11 schools. Extraction infrastructure remains vital as LNG race speeds offshore EPC packages.
A forward pipeline of drone-monitored roadworks and AI-assisted traffic planning underscores a technology shift within the Qatar infrastructure construction market. Utilities spend on smart meters and micro-grid pilots ensures reliable supply for EV charging corridors. Hospital builds now integrate telemedicine suites, and new schools adopt modular classrooms to shorten construction phases.



By Construction Type: New Build Dominates, Renovation Climbs the Agenda
New-build contracts absorbed 74.40% of the Qatar infrastructure construction market share in 2025 and will expand 4.64% yearly to 2031. The USD 22.2 billion capital plan schedules community parks, storm-water outfalls, and municipal service centers alongside landmark expressways. High-rise commercial towers in Lusail and downtown Doha employ off-site prefabrication to curb emissions. In parallel, renovation captures 25.60% share as green-retrofit mandates tighten; energy-audited government offices and HVAC upgrades in legacy malls show early adoption. Academic research finds recycling incentives, vendor education, and green finance as pivotal to mainstreaming sustainable refurbishment.
By Investment Source: State Capital Anchors, Private Flows Accelerate
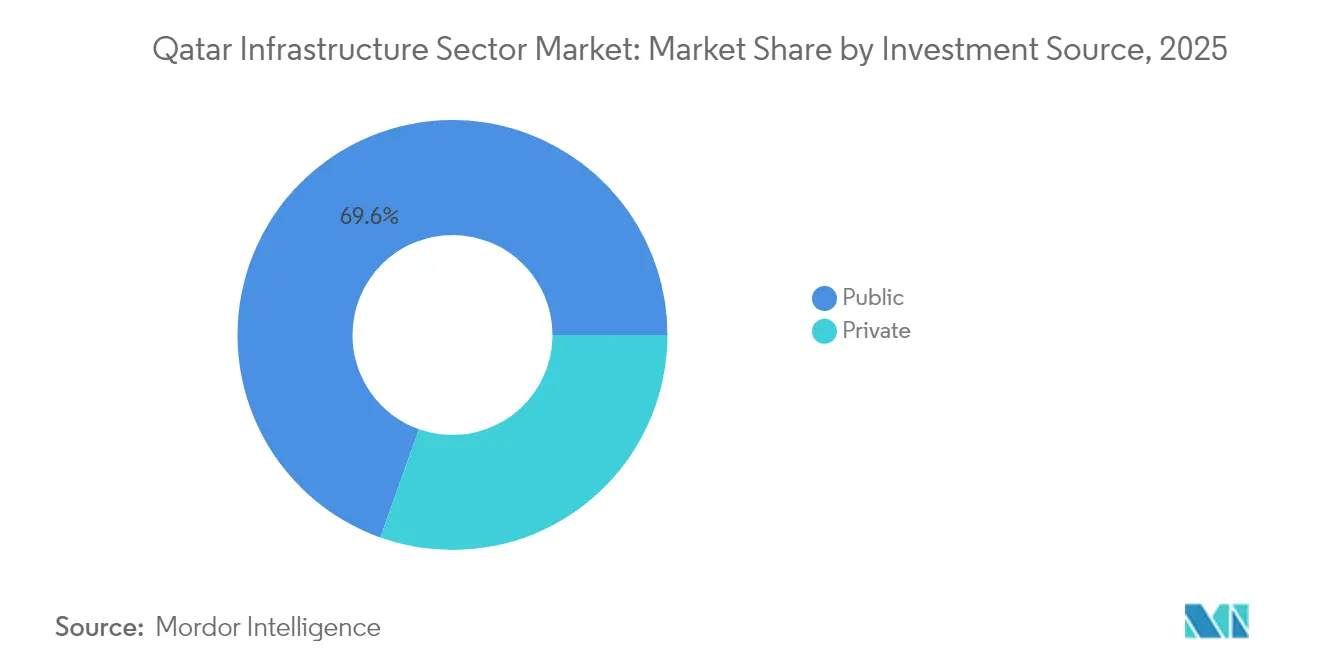
Public outlays commanded 69.55% of the Qatar infrastructure construction market size in 2025. The USD 5.33 billion education and USD 6.04 billion health envelopes in the 2025 budget reflect welfare priorities. The Public Works Authority alone aims to release USD 15.44 billion in tenders during 2025, ensuring visibility for contractors.
Private capital, forecast to rise 4.92% annually, leverages a maturing PPP law; the USD 1.48 billion Al Wakrah & Al Wukair sewage scheme was financed 50% by private lenders. Healthcare PPPs list 45 new schools worth USD 1 billion and hospitality ventures target 7 million tourists by 2030.
Geography Analysis
Doha continues to receive the lion’s share of project awards, combining transport nodes, mixed-use districts, and utility corridors that consolidate its role as financial and diplomatic centre. Smart-city pilots improve traffic flow and resource management, while metro ridership fosters modal shift. Despite moderating growth as major assets complete, reinvestment cycles in maintenance and technology upgrades keep demand steady.
Al Wakrah’s coastal expansion captures residential spill-over and logistics activity, catalysing marina upgrades, road widening, and community facilities. Developers target mid-income housing aligned with demographic trends, enhancing urban diversity in the Qatar infrastructure construction market.
Secondary cities such as Al Rayyan and Lusail attract infrastructure for universities, sports venues, and tech parks. These nodes strengthen regional corridors, spreading economic benefits and reducing over-reliance on the capital. Rural areas see incremental upgrades in roads and utilities to support agritech pilots and desert tourism, illustrating the widening geographic scope of the Qatar infrastructure construction market.
Regulatory Landscape
Qatar’s infrastructure delivery is shaped by a government-led approvals and standards framework anchored by the Ministry of Municipality for planning, zoning, and building permits, and the Public Works Authority (Ashghal) for public infrastructure procurement and technical requirements. Sector execution is closely tied to the Qatar Construction Specifications (QCS), with QCS 2024 operating as the current reference specification for in-scope heavy civil and utilities works, supporting tighter consistency across roadworks, drainage, and municipal assets.
In 2026, several rule updates reinforced transparency and investor access around the built environment. Ministerial Decision No. 4 of 2026 established a Preliminary Real Estate Register for off-plan units, creating a formal mechanism for preliminary title deeds and clearer processes around off-plan transactions. Cabinet Resolution No. 21 of 2026 updated the list of 10 designated areas where non-Qataris may own and usufruct real estate, including major zones such as West Bay, The Pearl Island, and Lusail, while the Ministry of Municipality also issued updated villa and mansion design standards through Ministerial Decision No. 108 of 2026, supporting permitting alignment and more standardized technical review.
Value Chain Analysis
Qatar’s infrastructure value chain is dominated by public-sector planning, funding, and tendering, then cascades through master planners and engineering consultants into tiered contractors and specialist subcontractors delivering transport, utilities, social, and extraction-linked civil works. On the demand side, state entities (notably Ashghal for roads, drainage, public spaces, and municipal assets) structure project packaging, prequalification, and procurement, while large strategic programs such as the North Field LNG expansion create high-value EPC demand for marine works, pipelines, and export-terminal-enabling infrastructure.
On the supply side, imported construction inputs and logistics remain key dependencies, making supply-chain controls and visibility central to delivery performance. Ashghal uses prequalification and approved lists to control contractor participation and compliance, and it also applies framework-style procurement to stabilize the availability of bulk inputs used in road and utility works. This structure highlights the importance of vendor qualification, subcontractor management, and reliable logistics performance to reduce schedule and cost risks during peak tender cycles.
Competitive Landscape
The Qatar infrastructure construction market is moderately concentrated, with key players such as Gulf Housing & Construction Co., Al Jaber Engineering Co., Arabian Construction Engineering Company, and Qatari Diar Vinci Construction (QDVC) QSC driving public-sector project execution. Long-standing government ties, integrated supply chains, and cost efficiency give local champions an edge. Meanwhile, international EPC specialists, including Vinci SA, Hochtief AG, and Consolidated Contractors Company (CCC), are taking on intricate projects, from marine works to metro tunneling and LNG infrastructure.
Giga-projects often see joint ventures, blending global expertise with local execution. Mid-sized contractors carve out success by honing in on tiered civil works, utility enhancements, and regional development. The adoption of digital tools, like BIM and drone tracking, is on the rise, bolstering cost management and project oversight. Today's competitive edge hinges on ESG alignment, digital prowess, and adaptable partnerships. Contractors who prioritize local workforce training and eco-conscious delivery are positioning themselves advantageously for future infrastructure bids. As contract structures shift to embrace risk-sharing and dispute resolution boards, it's clear that adaptability and innovation are as vital as scale for capturing market share.
Qatar Infrastructure Industry Leaders
Gulf Housing & Construction Co.
Arabian Construction Engineering Company
Al Jaber Engineering Co.
Qatari Diar Vinci Construction (QDVC) QSC
Lusail Development Company
- *Disclaimer: Major Players sorted in no particular order

Market Opportunities and Future Outlook
Near-term opportunity in Qatar’s infrastructure construction market is anchored by visible government procurement flow and multi-year execution programs rather than one-off event-led builds. Ashghal’s five-year infrastructure plan (2025-2029), positioned at over QR81 billion, supports continued tendering for transport networks, drainage and storm-water assets, public spaces, and municipal service infrastructure, and it also connects to the Third National Development Strategy (2024-2030) focus on asset management and quality-of-life upgrades. Procurement activity in 2026 provides evidence of an active pipeline, including Q1 2026 awards by Ashghal covering public-service projects such as the Hamad General Hospital redevelopment, alongside Ministry of Finance reporting of higher government tender and auction values in Q1 2026 versus the prior-year period.
Opportunity is also building around long-duration programs that pull through engineering services, program management, and brownfield integration capabilities, particularly in planned cities and utility corridors. In July 2026, Lusail Real Estate Development Company selected Parsons for program and construction management for the Lusail City Infrastructure Program, indicating sustained spend on master-planned infrastructure delivery and supervision scopes beyond pure EPC. In parallel, the combination of QCS 2024-driven specification discipline and the 2026 regulatory updates, including the off-plan registry and revised design standards, raises the bar for compliance-ready contractors, digital project controls (BIM, QA/QC traceability), and supply-chain assurance, creating room for firms that can document standards adherence, manage subcontractors, and deliver under tighter technical review.
Recent Industry Developments
- July 2026: Parsons announced a three-year contract award from Lusail Real Estate Development Company to provide program management, construction management, and construction supervision for the Lusail City Infrastructure Program. The award reinforces the shift toward long-duration delivery oversight and lifecycle execution for large master-planned developments, supporting demand for advanced controls, scheduling, and multi-package coordination.
- May 2026: Qatar reported an increase in government tenders and auctions value in Q1 2026 versus Q1 2025, alongside ongoing public-sector project awards. The procurement pickup supports contractor backlog visibility across transport, utilities, and public-service infrastructure packages that are tendered and delivered through state entities.
- May 2025: KAHRAMAA awarded USD 851 million for seven high-voltage substations and 212 km of transmission lines. The awards underpin utility network reinforcement needed for urban expansion and grid reliability, and they increase addressable scope for EPC contractors and specialist electrical and commissioning subcontractors.


Research Methodology Framework and Report Scope
Market Definition and Coverage
For this study, the Qatar infrastructure sector market is defined as the value of construction activity delivered for transportation, utilities, social, and extraction infrastructure within Qatar, measured in current USD for each year.
Scope exclusions: We exclude above ground residential, commercial, and industrial buildings when they do not involve sizable civil infrastructure works.
Segmentation Overview
- By Infrastructure Segment
- Transportation Infrastructure
- Utilities Infrastructure
- Social Infrastructure
- Extraction Infrastructure
- By Construction Type
- New Construction
- Renovation
- By Investment Source
- Public
- Private
- By Key Cities
- Doha
- Al Rayyan
- Al Wakrah
- Lusail
- Rest of Qatar
Data Sources, Market Sizing, and Validation
Desk Research
Desk work starts with building the project and policy context, and then translating it into measurable demand indicators for Qatar. Public sources are used to anchor assumptions on spending cycles, trade exposure, and delivery capacity, which later helps us avoid over-counting the same work across categories.
Common inputs include official statistics and releases such as planning and development indicators from Qatar Planning and Statistics Authority, budget and finance statements from the Ministry of Finance, project and procurement updates from Ashghal, and energy and industrial capacity disclosures from QatarEnergy. We also refer to sources such as customs and trade series, standards and regulatory updates, and peer reviewed engineering and construction journals for unit cost and execution benchmarks. Company annual reports, investor presentations, and reputable press coverage help validate timelines and identify material project changes. Where needed, a paid subscription database is used for company financials and intelligence, contract and tender tracking, and shipment-level import export checks for key construction inputs. This list is not exhaustive, and many other public references were also used for cross-checks and clarification.
Primary Interviews and Surveys
Primary work is used to pressure-test what desk research cannot fully show, mainly the on-ground pace of awards, realistic completion schedules, and how renovation activity is being counted versus new build. We speak with a mix of stakeholders such as project owners, EPC and civil contractors, specialist subcontractors, consultants, and materials and equipment participants, and then align their inputs to Qatar-wide realities.
Because this is a Qatar-only market, we also ensure coverage reflects the main delivery hubs and adjacent municipalities, so our assumptions are not overly centered on one city.
Distribution of primary research fieldwork respondents
| Company type | Respondent position |
|---|---|
| Top tier: 26% | CXOs: 16% |
| Mid tier: 57% | Functional/Unit leaders: 31% |
| Smaller Players: 17% | Managers: 53% |
Market-Sizing & Forecasting
Sizing is built using a top-down approach where national infrastructure demand is reconstructed from public capex signals, project pipelines, and sector investment priorities, and then split into infrastructure types and construction modes that match how work is executed in Qatar. Results are corroborated with selective bottom-up approximations, including sampled project value checks, channel conversations on typical cost ranges, and volume times price sanity checks for high-value inputs, and then totals are adjusted where gaps show up.
Key inputs used in the model include the active and planned project pipeline by transportation, utilities, social, and extraction infrastructure, the share of new construction versus renovation, and the public versus private investment mix. We also use indicators such as government capital plans, major tender activity, execution capacity, and typical cost inflation in labor and materials, since they directly influence annual value of work put in place. When partial information exists for a project year or sub-sector, we fill the gap using conservative completion curves and validated unit-cost ranges, and then we re-check the output against known delivery constraints.
For forecasting, scenario analysis is applied around award timing, execution speed, and input cost trends, and the chosen path is aligned to what local experts view as realistic for the next planning cycle.
Data Validation & Update Cycle
Validation is handled through multiple checks so the final numbers remain traceable to real demand signals. Model outputs are compared against independent metrics such as tender flow, budget direction, and observed activity levels, and any unusual jumps are investigated before they are accepted.
A second analyst review is performed to confirm definitions, remove overlaps across infrastructure types, and verify year-to-year movements against known project milestones. If new awards, postponements, or policy shifts create a material variance, follow-up calls are triggered to confirm the change. Reports are refreshed annually, with interim updates for major events, and a final pre-delivery review is completed so clients receive the most current view.
Mordor Intelligence's Qatar Infrastructure Sector Market Size Compared With Other Published Estimates
Published market sizes for Qatar infrastructure can look far apart, even when the titles appear similar, because the scope and counting rules are not always the same. The biggest differences usually come from what is treated as infrastructure versus general construction, which year is used as the base, and whether values reflect awarded pipeline or work actually delivered.
The main gap comes from mixing broad construction categories into the infrastructure total, where Mordor Intelligence counts transportation, utilities, social, and extraction infrastructure value and excludes stand-alone building construction unless it is tied to sizable civil works, which changes the 2025 starting point versus broader construction style totals.
Benchmark comparison
| Source | Market Size | Gaps in Research Methodology |
|---|---|---|
| Mordor Intelligence | USD 33.40 B (2025) | |
| Global Consultancy A | USD 63.32 B (2024) | Uses a wider definition that brings residential and commercial built environment elements into the infrastructure bucket, which inflates the total compared with a heavy civil infrastructure-only view, and it also anchors the series on a different base year. |
| Regional Consultancy B | USD 65.70 B (2024) | Reported as infrastructure construction alongside other project types, so civil infrastructure spending is blended with non-infrastructure construction activity, and the faster growth assumption can reflect an aggressive award-to-execution conversion. |
The spread across sources is mainly explained by whether the number is limited to infrastructure civil works or expanded to include broader construction categories, plus the year and conversion assumptions used. By keeping the scope tied to infrastructure work put in place and by cross-checking annual movement with project and tender signals, our estimate stays easier to replicate and audit year by year.


Key Questions Answered in the Report
What is the current value of the Qatar infrastructure construction market?
The market stands at USD 34.82 billion in 2026.
How fast is the market expected to grow?
It is projected to rise at a 4.26% CAGR, reaching USD 42.9 billion by 2031.
Which segment holds the largest share?
Transportation infrastructure leads with 36.95% of total spending in 2025.
Why is private investment gaining momentum?
Regulatory reforms allowing full foreign ownership and a maturing PPP law are spurring private capital, which is forecast to grow 4.92% annually.
Which city is growing the fastest?
Al Wakrah shows the highest growth rate with a 4.78% CAGR through 2031, driven by housing and logistics projects.
How will the North Field expansion affect construction demand?
The LNG capacity boost to 142 MTPA requires substantial offshore platforms, pipelines, and terminals, generating multi-billion-dollar EPC opportunities across the construction value chain.
Page last updated on:





