Market Overview
| Study Period | 2020 - 2031 |
|---|---|
| Forecast Data Period | 2026 - 2031 |
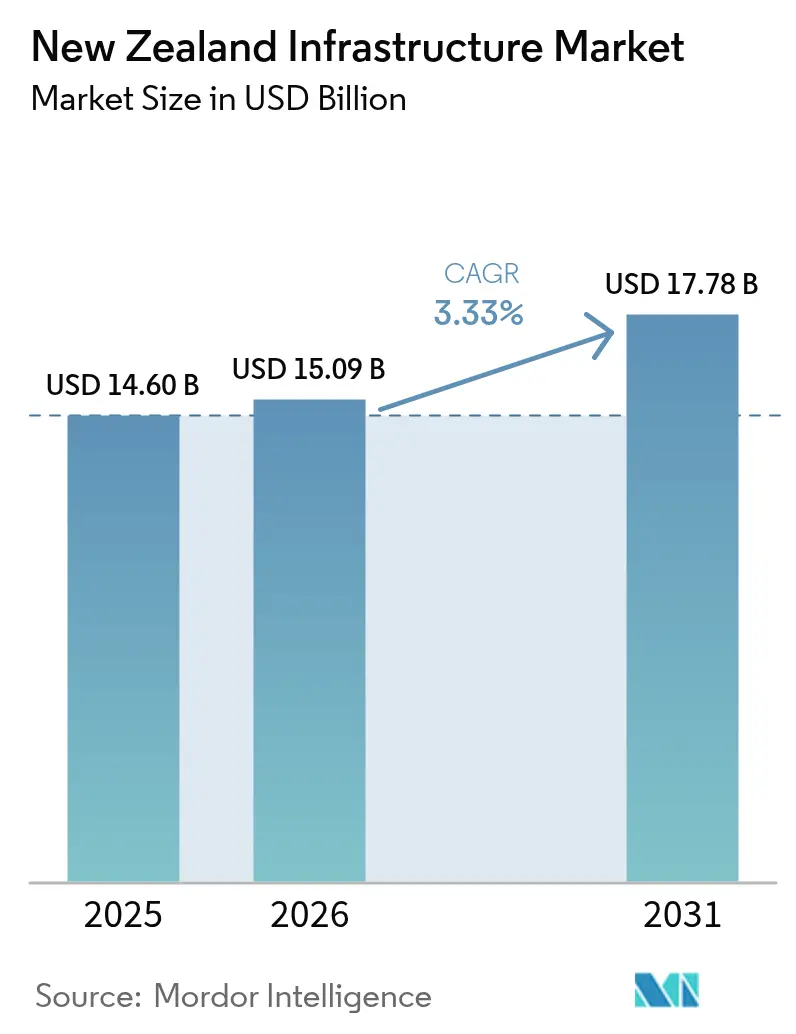
| Base Year Market Size (2025) | USD 14.6 Billion |
| Market Size (2026) | USD 15.09 Billion |
| Market Size (2031) | USD 17.78 Billion |
| Growth Rate (2026 - 2031) | 3.33% CAGR |
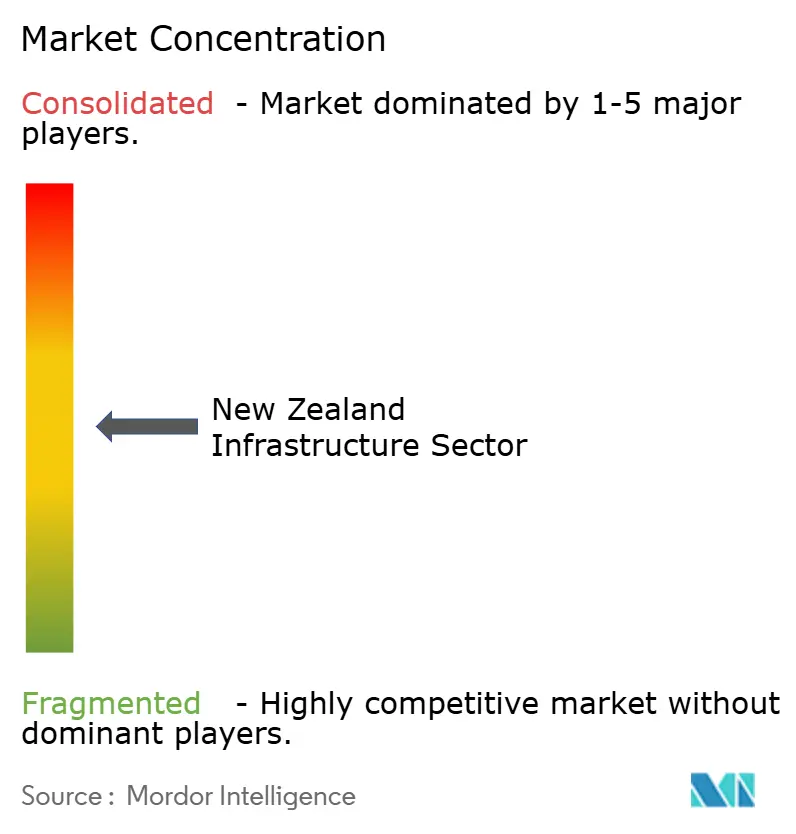
| Market Concentration | Medium |
Major Players *Disclaimer: Major Players sorted in no particular order Image © Mordor Intelligence. Reuse requires attribution under CC BY 4.0. | |
New Zealand Infrastructure Market Analysis by Mordor Intelligence
The New Zealand Infrastructure Market size was valued at USD 14.6 billion in 2025 and estimated to grow from USD 15.09 billion in 2026 to reach USD 17.78 billion by 2031, at a CAGR of 3.33% during the forecast period (2026-2031). Moderate growth reflects a deliberate pivot toward resilience and sustainability, even as fiscal headwinds and material-supply volatility persist. Government commitment to close an estimated USD 210 billion infrastructure gap, a USD 120 billion National Infrastructure Pipeline, and a sharpened focus on digital asset management are prime growth catalysts. Transport remains the largest opportunity set, yet utilities—buoyed by 100%-renewable targets—are accelerating fastest. An uptick in renovation spending over greenfield builds signals a new lifecycle strategy, while refreshed PPP rules and foreign-capital outreach are widening funding channels. Intensifying labour shortages and lingering input-cost volatility place a ceiling on delivery capacity, but strategic digitalisation and stronger private-sector participation are raising productivity potential.
Key Report Takeaways
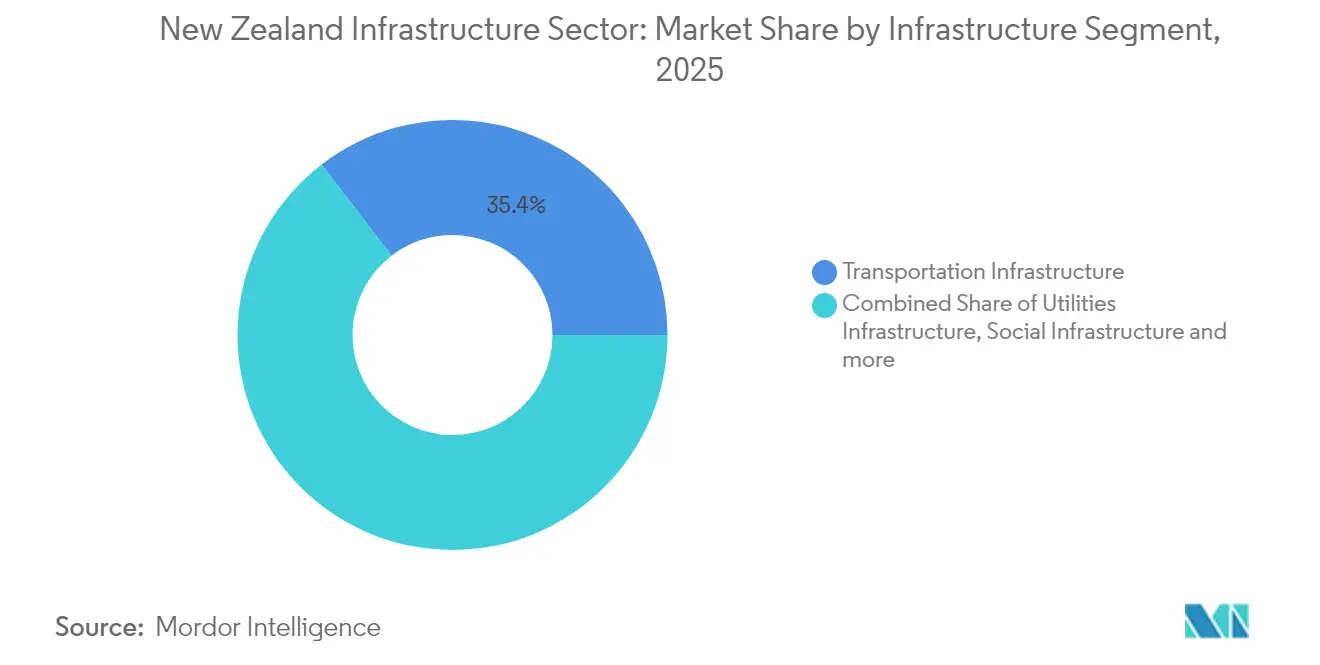
- By infrastructure segment, transportation led with 35.42% of the New Zealand infrastructure sector market share in 2025; utilities infrastructure is projected to expand at a 3.88% CAGR to 2031.
- By construction type, new construction accounted for 64.12% of the New Zealand infrastructure sector market size in 2025, while renovation projects are growing at a 4.05% CAGR through 2031.
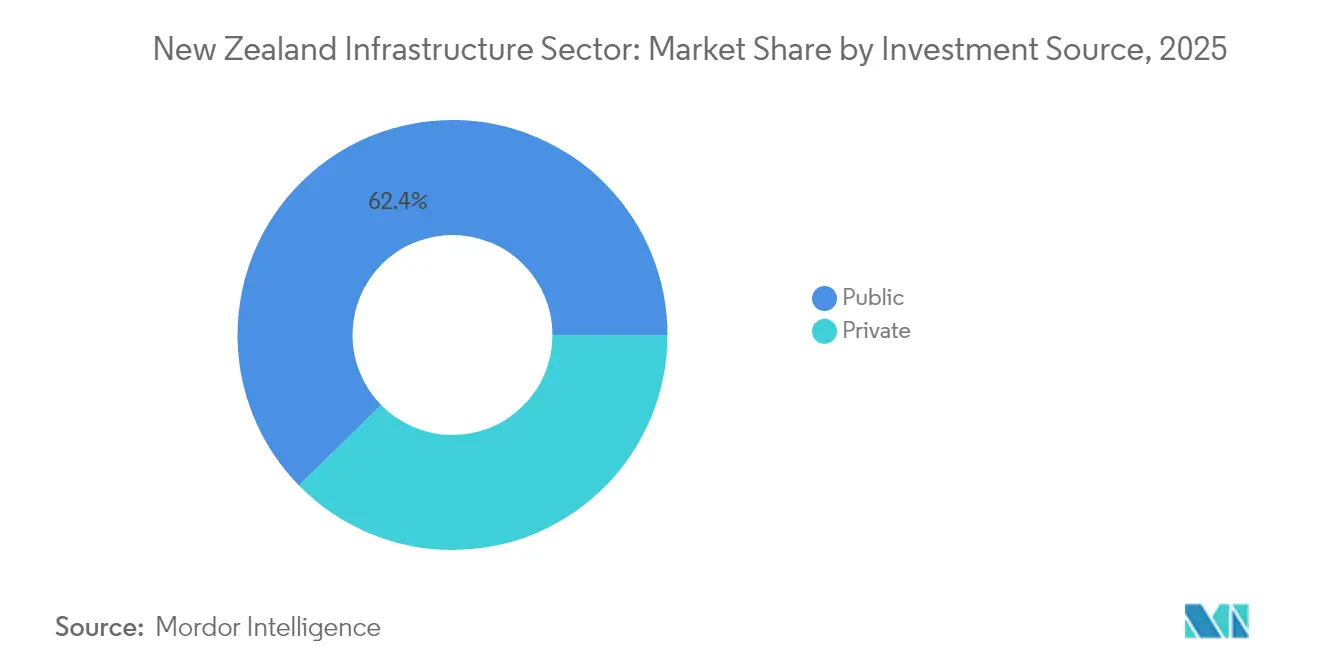
- By investment source, public funding held 62.35% of the New Zealand infrastructure sector market share in 2025, whereas private investment records the strongest CAGR at 4.31% for 2026-2031.
- By geography, Auckland captured 38.62% revenue share of the New Zealand infrastructure sector market in 2025; Hamilton posts the highest forecast CAGR at 3.73% to 2031.
Note: Market size and forecast figures in this report are generated using Mordor Intelligence’s proprietary estimation framework, updated with the latest available data and insights as of 2026.
New Zealand Infrastructure Market Trends and Insights
Drivers Impact Analysis*
| Driver | (~) % Impact on CAGR Forecast | Geographic Relevance | Impact Timeline |
|---|---|---|---|
| Nationwide infrastructure surge backed by NZ Upgrade Programme | +1.2% | National, concentrated in Auckland, Wellington, Christchurch | Medium term (2-4 years) |
| National renewable-energy commitments | +0.9% | National; South Island and geothermal regions | Long term (≥ 4 years) |
| Rising demand for urban transit in Auckland | +0.8% | Auckland with spillover to other metros | Medium term (2-4 years) |
| Digital asset management and predictive maintenance | +0.5% | National, early adoption in Auckland and Wellington | Short term (≤ 2 years) |
| Source: Mordor Intelligence | |||
Nationwide infrastructure surge backed by NZ Upgrade Programme
The National Infrastructure Pipeline has surpassed USD 120 billion, with USD 44 billion under construction and USD 11.6 billion earmarked for 2025 expenditure.[1]Beehive (Chris Bishop) – “National Infrastructure Pipeline worth over USD 120 billion” Seventy percent of listed projects already hold secure funding, underscoring sustained political backing despite budget pressures. More than 1,300 projects valued above USD 10 million illustrate broad agency participation, while the emerging 30-year National Infrastructure Plan is embedding climate resilience and digital integration at the core of future prioritisation.
National renewable-energy commitments driving investment
A 100% renewable-electricity goal is catalysing grid upgrades such as the USD 144 million STATCOM facility at Ōtāhuhu, deployed by Transpower and Hitachi Energy. Forecast electricity demand is set to rise 70% by 2050, prompting over 150 generation, storage, and transmission projects announced in 2024 alone.[2]Hitachi Energy – “Hitachi Energy and Transpower strengthen grid for New Zealand” Consolidation is accelerating; Contact Energy’s planned USD 1.86 billion purchase of Manawa Energy exemplifies scale-building across the value chain.
Rising demand for urban transit solutions in Auckland
The USD 5.493 billion City Rail Link—a 3.45 km twin-tunnel project due November 2025—anchors Auckland’s multimodal expansion. Auckland Transport’s USD 1.352 billion 2024-2025 capital programme layers busway, ferry, and rolling-stock investments to ease congestion and cut emissions. Designs incorporate higher climate-resilience standards and real-time monitoring systems that extend asset life and reduce operating costs.
Adoption of digital asset management and predictive maintenance
Digital twins and BIM-enabled asset models are shifting maintenance from reactive to predictive. WSP’s nationwide condition-data capture for the state-highway network shows how automated sensing improves lifecycle decisions. Research underlines that 99% of required infrastructure in 30 years is already in place, so extending life by 15-20% through digital optimisation is pivotal.
Restraints Impact Analysis*
| Restraint | (~) % Impact on CAGR Forecast | Geographic Relevance | Impact Timeline |
|---|---|---|---|
| Severe skilled-labour shortages | -0.7% | National; acute in Auckland and Canterbury | Medium term (2-4 years) |
| Construction-material cost volatility | -0.6% | National | Short term (≤ 2 years) |
| Public opposition to greenfield projects | -0.5% | Urban and peri-urban Wellington and Auckland | Long term (≥ 4 years) |
| Source: Mordor Intelligence | |||
Severe skilled-labour shortages limiting project execution
31.9% of construction firms list labour scarcity as their main constraint, even though 25,000 workers seek additional hours, pointing to allocation inefficiencies. Migration curbs worsen gaps in specialist trades, especially across simultaneous megaprojects in Auckland and Canterbury. Industry training initiatives are ramping up, but the skill-pipeline lag is expected to cap execution capacity through 2028.
Persistent material-cost volatility disrupting budgets
Construction-cost inflation cooled to 1.1% in 2024 after peaking at 14% in 2022, yet Macromonitor still forecasts a 2.8% rise for 2025. Long-cycle transport and utilities works remain exposed to delayed procurement and contract repricing, pushing stakeholders toward more flexible risk-sharing structures.
*Our forecasts treat driver/restraint impacts as directional, not additive. The impact forecasts reflect baseline growth, mix effects, and variable interactions.
Segment Analysis
By Infrastructure Segment: Utilities Outpacing Traditional Transport Dominance
Transportation infrastructure generated 35.42% of the New Zealand infrastructure sector market in 2025, led by the City Rail Link and a USD 20.16 billion National Land Transport Programme. Nonetheless, utilities infrastructure is forecast to grow 3.88% annually thanks to grid upgrades, hydro refurbishment, and water-services reform linked to Local Water Done Well.
Renovation dominates utilities spending. The Local Water Done Well initiative channels capital to leak reduction, storm-resilience retrofits, and nutrient-runoff controls. Mandatory carbon-counting from 2025 is nudging utility owners toward low-embodied-carbon materials and circular-procurement models. Transport still claims the lion’s share of new construction, but lifecycle digitalisation enables mergers of renewal and expansion workstreams, compressing maintenance backlogs and freeing CapEx for capacity projects.


By Construction Type: Renovation Gains Momentum Amid Asset Aging
Renovation projects, rising at a 4.05% CAGR, according to Te Waihanga’s (New Zealand Infrastructure Commission) finding that 99% of required assets already exist, sharpening focus on upkeep. Local authorities such as Waitomo District Council are executing three-year renewal programmes for water, wastewater, and stormwater systems.
New construction still supplies 64.12% of the New Zealand infrastructure sector market size in 2025, primarily through highway corridors and hospital upgrades. Even here, brownfield intensification outpaces greenfield sprawl, aligning with planning rules and community sentiment. BIM is improving renovation accuracy, while Green Star certification widens across both construction types, embedding energy-efficiency and social-impact metrics in tender scoring.
By Investment Source: Private Capital Acceleration Reshapes Funding Landscape
Public outlays delivered 62.35% of the New Zealand infrastructure sector market share in 2025, underpinned by a USD 6.8 billion Budget 2025 infrastructure envelope. Yet private-capital growth at 4.31% CAGR is accelerating, spurred by November 2024 PPP reforms that streamline risk transfer, bid-cost recognition, and dispute resolution.
The New Zealand infrastructure sector market welcomes global investors following the March 2025 Infrastructure Investment Summit. Complementary mechanisms include National Infrastructure Funding and Financing Limited’s levy-backed structures for regional broadband and rural roads. Bond issuance is rising too, illustrated by Infratil’s May 2025 offer to fund energy and data-centre assets.
Geography Analysis
Capital allocations remain heavily skewed to North Island, reflecting population clusters and freight corridors. Auckland’s share of the New Zealand infrastructure sector market size stays anchored by transport and water megaprojects, yet wider Waikato and Bay of Plenty corridors attract spill-over manufacturing and logistics facilities, diversifying future workstreams.
South Island investments pivot toward hydro-asset renewal and grid resilience, giving Canterbury a larger utilities profile. Electric-freight trials between Dunedin and Invercargill port nodes highlight cross-sector convergence between energy and transport.
Smaller regions such as Taranaki leverage minerals-strategy grants to reboot extraction infrastructure, while the USD 1.2 billion Regional Infrastructure Fund directs blended loan-equity packages to digital backhaul, flood protection, and tourism amenities. Spatially balanced spending eases political tension and broadens contractor opportunity sets.
Competitive Landscape
The New Zealand infrastructure sector market shows moderate concentration. Fletcher Construction, Fulton Hogan, and Downer Group account for the bulk of tier-one wins through vertically-integrated design-build-maintain contracts. International entrants are mobilising project-specific joint ventures, lifting bidding intensity and technology standards.
Downer’s dedicated Asset Management Services unit exploits predictive analytics to win long-term maintenance concessions. Fletcher’s investment in modular prefabrication accelerates social-infrastructure delivery, while Fulton Hogan’s asphalt-recycling initiatives align with carbon-reduction procurement criteria.
White space emerges in renewable-energy balance-of-plant, smart-water platforms, and resilience retrofits. Niche firms with specialised BIM or geospatial skills are capturing high-margin subcontracts, and PPP consortia increasingly pair construction majors with pension-fund equity and facility-management specialists.
New Zealand Infrastructure Industry Leaders
Fletcher Construction
Fulton Hogan Ltd
Downer Group
CPB Contractors Pty Ltd
Hawkins Limited
- *Disclaimer: Major Players sorted in no particular order

Recent Industry Developments
- May 2025: Hitachi Energy partnered with Transpower on a ±150 MVAr STATCOM at Ōtāhuhu, part of a USD 144 million programme to bolster grid stability.
- May 2025: Infratil Limited opened an infrastructure-bond offer to finance energy and digital assets.
- April 2025: The Government released New Zealand’s first Health Infrastructure Plan outlining USD 20 billion in hospital renewals.
- March 2025: The Infrastructure Investment Summit convened global investors worth USD 6 trillion, showcasing renewable-energy and transport opportunities.


Research Methodology Framework and Report Scope
Market Definitions and Key Coverage
According to Mordor Intelligence, our study counts the New Zealand infrastructure sector as all capital works that create, expand, or refurbish transportation corridors, utility networks, social assets, and extraction facilities that serve public or industrial users. The valuation records each project at contract award, converts it to current-year USD, and spreads spend across the scheduled build years to avoid double counting.
Scope Exclusions: Stand-alone residential buildings, temporary site works, and offshore assets are excluded.
Segmentation Overview
- By Infrastructure Segment
- Transportation Infrastructure
- Utilities Infrastructure
- Social Infrastructure
- Extraction Infrastructure
- By Construction Type
- New Construction
- Renovation
- By Investment Source
- Public
- Private
- By Key City
- Auckland
- Wellington
- Christchurch
- Hamilton
- Rest of New Zealand
Detailed Research Methodology and Data Validation
Primary Research
Mordor analysts interviewed project owners, EPC contractors, and municipal finance officers across Auckland, Wellington, Christchurch, and key provincial councils. These dialogues verified pipeline timing, inflation pass-through, and private funding appetite, allowing us to fine-tune cost curves and risk weightings.
Desk Research
We began with the National Infrastructure Pipeline, Treasury Budget papers, Statistics New Zealand construction-spend tables, and Te Waihanga reports, which reveal funded project lists and historic work put in place values. Additional insight comes from sector agencies such as Waka Kotahi (transport), Water New Zealand, and the Electricity Authority, while World Bank and IMF datasets provide macro ratios that keep totals in line with GDP reality. Our paid files in D&B Hoovers and Dow Jones Factiva supply contract awards and cost trends that close information gaps. The sources named illustrate, not exhaust, the wider desk review.
Market-Sizing & Forecasting
We construct a top-down model that rolls five-year central budgets, local long-term plans, and announced private concessions into an annual spend pool, then tests it against historical infrastructure outlay as a share of GDP. Select bottom-up checks, such as supplier revenue roll-ups and sampled contract value per kilometer in roads or per megawatt in energy, calibrate totals. Core drivers include project award volumes, tender price indices, imported steel prices, labor productivity, and NZD USD exchange movement. A multivariate regression, supplemented by ARIMA smoothing for cyclical effects, generates the 2019-2030 forecast and flags sensitivity ranges.
Data Validation & Update Cycle
Outputs undergo automated variance scans, peer review, and senior sign-off. Models refresh every twelve months, with mid-cycle updates when budgets, mega-projects, or cost shocks change the baseline. A short reconfirmation call with key respondents precedes each client delivery.
Why Our New Zealand Infrastructure Sector Size & Share Analysis Baseline Earns Confidence
Published estimates often differ because providers mix asset classes, freeze currency at varying dates, or carry forward outdated budgets. Our disciplined scope, live cost indices, and yearly refresh reduce those distortions.
Key Gap Drivers include some studies folding residential construction into totals, others using face-value pipeline numbers without annualization, and several applying uniform cost escalation despite the tender price plateau since 2024.
Benchmark comparison
| Market Size | Anonymized source | Primary gap driver |
|---|---|---|
| USD 14.6 B (2025) | Mordor Intelligence | - |
| USD 55 B (2024) | Regional Consultancy A | Includes residential builds and uses contract face value without annual spread |
| USD 54.22 B (2025) | Trade Journal B | Relies on headline pipeline and infrequent cost deflator updates |
The comparison shows that Mordor's transparent scoping, current data feeds, and multi-step reviews give decision-makers a balanced, repeatable baseline they can trust.


Key Questions Answered in the Report
What is the current value of the New Zealand infrastructure sector market?
The market stands at USD 15.09 billion in 2026 and is projected to grow to USD 17.78 billion by 2031 at a 3.33% CAGR.
Which segment is growing fastest within the New Zealand infrastructure sector market?
Utilities infrastructure leads growth with a 3.88% CAGR for 2026-2031, driven by renewable-energy and water-services projects.
How significant is private investment in New Zealand’s infrastructure pipeline?
Private funding holds 37.65% of current value but is expanding at 4.31% CAGR, supported by refreshed PPP rules and investor outreach.
What are the main challenges facing project delivery?
Skilled-labour shortages, residual construction-material volatility, and complex consenting processes are the top three execution constraints.
Why is renovation spending rising faster than new construction?
With 99% of needed assets already built, owners are prioritising renewal cycles to extend lifespan, reduce carbon intensity, and control whole-of-life costs.
Which city dominates infrastructure spending in New Zealand?
Auckland commands 38.62% of national infrastructure outlays thanks to large rail, busway, and water-upgrade programmes, although Hamilton shows the fastest growth trajectory.
Page last updated on:


