Infrared Detector Market Size and Share
Market Overview
| Study Period | 2020 - 2031 |
|---|---|
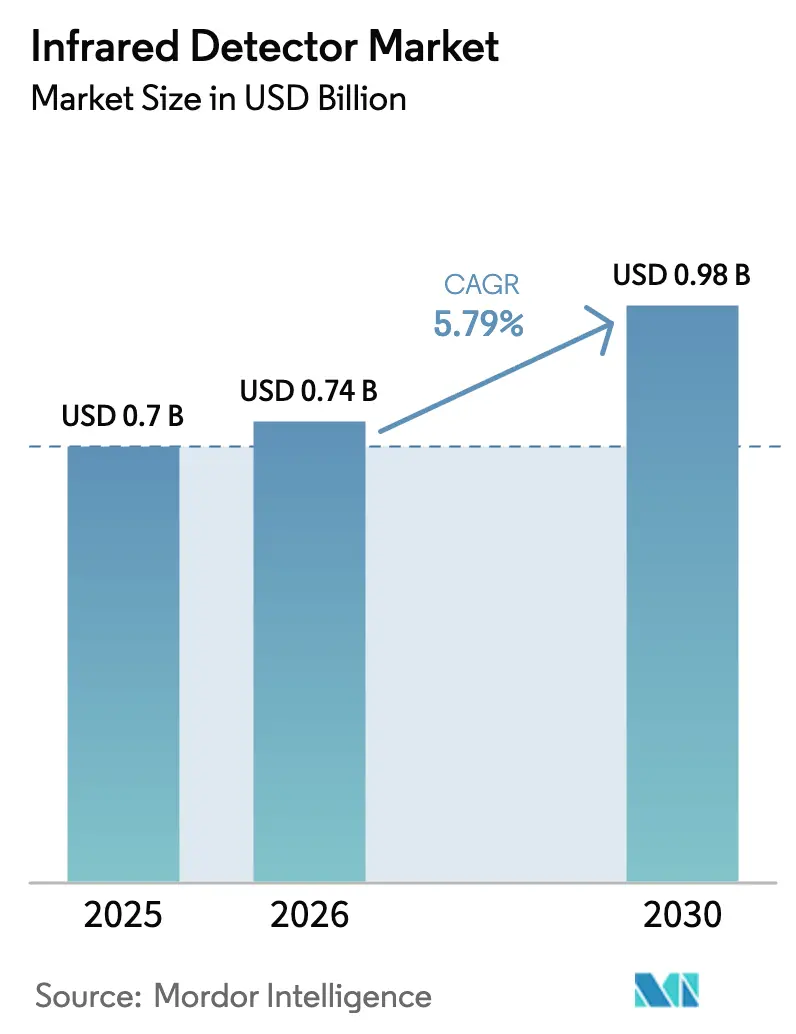
| Market Size (2026) | USD 0.74 Billion |
| Market Size (2030) | USD 0.98 Billion |
| Growth Rate (2026 - 2031) | 5.79% CAGR |
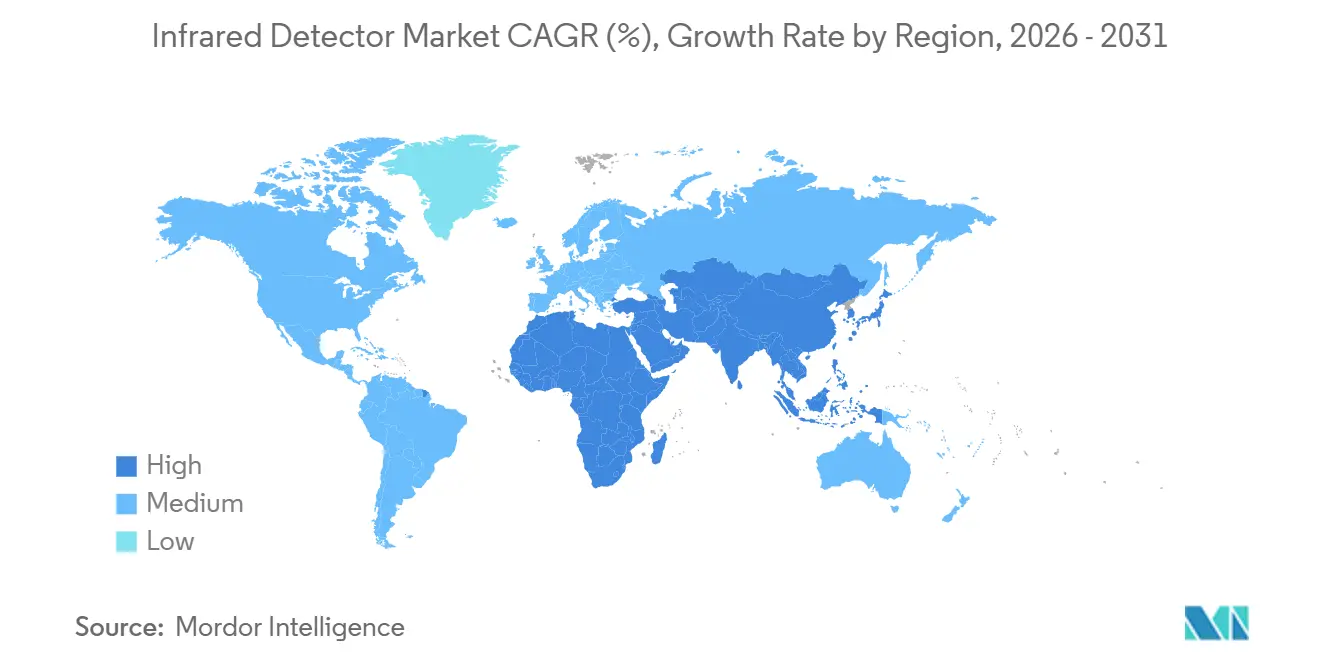
| Fastest Growing Market | Middle East |
| Largest Market | Asia Pacific |
| Market Concentration | Medium |
Major Players *Disclaimer: Major Players sorted in no particular order Image © Mordor Intelligence. Reuse requires attribution under CC BY 4.0. | |
Infrared Detector Market Analysis by Mordor Intelligence
The infrared detector market size is expected to increase from USD 0.70 billion in 2025 to USD 0.74 billion in 2026 and reach USD 0.98 billion by 2031, growing at a CAGR of 5.79% over 2026-2031. Heightened demand for solid-state LiDAR in electric vehicles, quarterly thermography audits mandated by the European Union, and hydrogen-leak monitoring rules across the Middle East are shifting revenue toward short-wave and mid-wave infrared focal-plane arrays. Uncooled microbolometers remain the workhorse of building automation and industrial maintenance, yet photo quantum designs based on indium-gallium-arsenide and mercury-cadmium-telluride are expanding in automotive and defense because they deliver faster frame rates and lower noise figures. Asia-Pacific retains volume leadership on the back of China’s LiDAR supply chain, while the Middle East presents the fastest regional upside as green-hydrogen complexes move from pilot to megawatt scale. Price pressure in passive pyroelectric sensors is accelerating migration to wafer-level-packaged microbolometers that integrate vacuum encapsulation, anti-reflection coatings, and readout circuitry in modules measuring under 10 millimeters on a side.
Key Report Takeaways
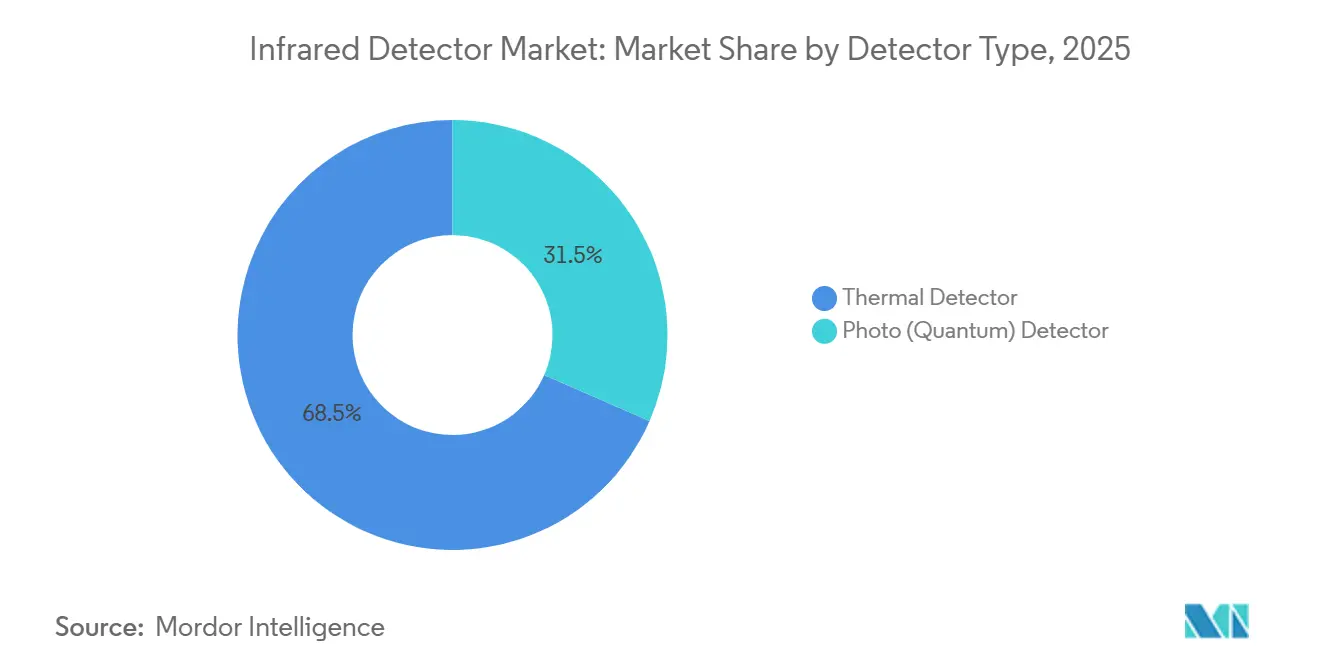
- By detector type, thermal detectors led with 68.46% of infrared detector market share in 2025, while photo quantum detectors are projected to expand at an 11.80% CAGR through 2031.
- By cooling technology, uncooled detectors accounted for 83.71% of the infrared detector market size in 2025; cooled detectors are advancing at a 10.90% CAGR over 2026-2031.
- By material, microbolometer films captured 64.27% share in 2025, whereas indium-gallium-arsenide arrays are forecast to rise at a 13.21% CAGR.
- By spectral range, long-wave infrared commanded 45.83% revenue share in 2025; short-wave infrared is on track for a 14.58% CAGR between 2026 and 2031.
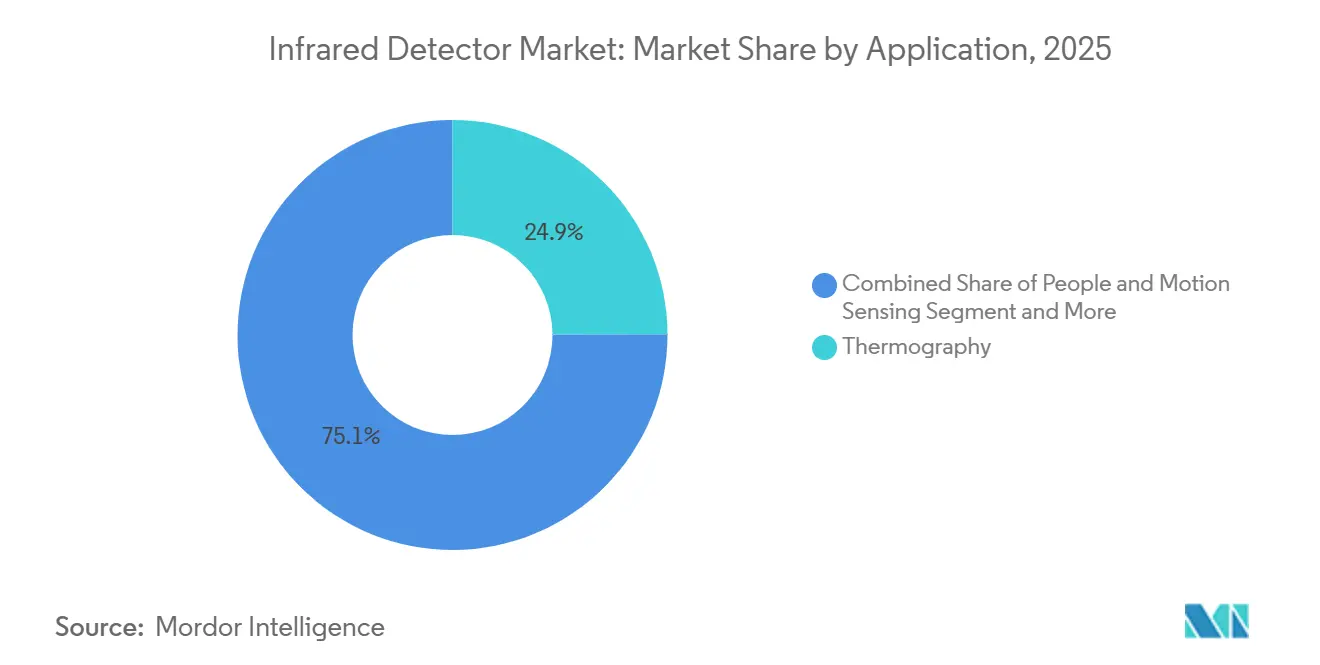
- By application, temperature measurement and thermography held 24.94% of 2025 demand, but automotive ADAS and LiDAR are set to post an 18.43% CAGR through 2031.
- By end-use industry, industrial manufacturing represented 31.03% of 2025 revenue, yet automotive is poised to grow at a 12.64% CAGR to 2031.
- By geography, Asia-Pacific held 40.15% of 2025 revenue; the Middle East is projected to record a 10.30% CAGR through 2031.
Note: Market size and forecast figures in this report are generated using Mordor Intelligence’s proprietary estimation framework, updated with the latest available data and insights as of January 2026.
Global Infrared Detector Market Trends and Insights
Drivers Impact Analysis*
| Driver | (~) % Impact on CAGR Forecast | Geographic Relevance | Impact Timeline |
|---|---|---|---|
| Miniaturization of Uncooled Micro-bolometer Arrays Empowering IoT Motion Sensors in Asia | +1.2% | Asia-Pacific core, spill-over to North America | Medium term (2-4 years) |
| Mandatory Predictive-Maintenance Thermography in EU Process Industries | +0.9% | Europe, secondary adoption in North America | Short term (≤ 2 years) |
| Surge in LiDAR-grade Near-IR Detectors for Autonomous and EV Platforms in China | +1.5% | China, expanding to Asia-Pacific and North America | Long term (≥ 4 years) |
| IR Gas-Leak Detection Mandates for Green-Hydrogen Plants across Middle East | +0.7% | Middle East, early pilots in Australia | Medium term (2-4 years) |
| Semiconductor Fab Inspection Demand for SWIR Cameras in Taiwan and South Korea | +0.6% | Taiwan and South Korea, secondary in Japan | Short term (≤ 2 years) |
| Border-Surveillance Modernization Programs in US and India | +0.5% | United States and India, limited Middle East adoption | Long term (≥ 4 years) |
| Source: Mordor Intelligence | |||
Miniaturization of Uncooled Micro-bolometer Arrays Empowering IoT Motion Sensors in Asia
Pixel pitches below 12 micrometers have allowed Japanese and South Korean suppliers to ship nearly 8 million focal-plane arrays for battery-powered IoT occupancy sensors in 2025, up 35% year on year.[1]IEEE, “Sub-10 µm Microbolometer Advancements,” ieeexplore.ieee.org Building-automation integrators adopted the smaller die to satisfy energy-efficiency codes that tie HVAC loads to verified room presence. Lens diameters shrank in parallel, allowing thermal modules to fit into light fixtures and wall switches that previously lacked space for 17-micrometer arrays. Manufacturing cost per square millimeter dropped about 40%, opening mid-tier smartphones to embedded thermal cameras. Passive operation avoids the eye-safety reviews associated with active near-infrared illumination, easing consumer-product certification under IEC 62471.
Mandatory Predictive-Maintenance Thermography in EU Process Industries
The Energy Efficiency Directive 2023/1791 obliges refiners, chemical plants, and steel mills to run quarterly thermography on motors, switchgear, and piping.[2]European Commission, “Energy Efficiency Directive 2023/1791,” ec.europa.eu Germany and France extended the scope in 2024 to medium-sized sites, tripling the addressable facility count to 12,000. Handheld and drone-mounted cameras with 0.05 °C resolution displaced contact probes in hazardous zones. U.K. and Dutch insurers now rebate between 5% and 10% of annual premiums when plants upload continuous thermal data to asset-management clouds. Camera vendors responded by bundling LTE modules and encrypted gateways, features that raise average selling price by roughly 20% versus offline units.
Surge in LiDAR-grade Near-IR Detectors for Autonomous and EV Platforms in China
China’s 2025 Level 3 vehicle guidelines require at least one solid-state or hybrid LiDAR per car.[3]MIIT, “Smart Vehicle Technical Guidelines 2025,” miit.gov.cn Frequency-modulated continuous-wave systems operating at 1,550 nanometers rely on indium-gallium-arsenide avalanche photodiodes offering fourfold range versus 905-nanometer pulsed silicon imagers. Domestic LiDAR makers shipped about 1.2 million units in 2025, sourcing detector wafers from Japanese and German epitaxy houses alongside local foundries. Operating above the silicon cut-off also meets IEC 60825-1 eye-safety Class 1 limits at higher optical power, extending highway detection to 300 meters. Brands such as BYD and NIO embedded the modules on production lines last year, accelerating volume demand for short-wave infrared arrays.
IR Gas-Leak Detection Mandates for Green-Hydrogen Plants across Middle East
Saudi Arabia and the United Arab Emirates published joint standards in 2024 that oblige continuous mid-wave infrared monitoring at electrolyzer sites above 10 megawatts. Cameras must sense hydrogen at 100 ppm from 100 meters, a metric achievable only with cooled mercury-cadmium-telluride or indium-antimonide detectors. NEOM’s 4-gigawatt complex alone will deploy roughly 250 fixed and portable cameras valued near USD 15 million. IRENA’s 2025 hydrogen-safety guide endorses infrared imaging as the primary leak countermeasure, reinforcing demand in Australia and Chile. Compliance with ISO 19880-8 extends detector sales into downstream fueling stations where portable imagers verify pipe integrity.
Restraints Impact Analysis*
| Restraint | (~) % Impact on CAGR Forecast | Geographic Relevance | Impact Timeline |
|---|---|---|---|
| Export-control (ITAR-like) Limits on High-spec Cooled Detectors | -0.8% | Global, most acute in Asia-Pacific and Middle East | Long term (≥ 4 years) |
| Price Erosion in Passive PIR Components | -0.6% | Global, concentrated in consumer electronics segment | Short term (≤ 2 years) |
| Thermal Drift and Calibration Issues in Offshore Oil-and-Gas Deployment | -0.3% | North Sea, Gulf of Mexico, Southeast Asia offshore fields | Medium term (2-4 years) |
| Counterfeit Detector Channels in Emerging Markets | -0.2% | Africa, South Asia, parts of South America | Medium term (2-4 years) |
| Source: Mordor Intelligence | |||
Export-control (ITAR-like) Limits on High-spec Cooled Detectors
U.S. ITAR and EU dual-use lists classify cooled arrays above 640×480 resolution and below 20 mK noise as defense articles, adding up to 12 months for export licensing and legal fees over USD 100,000 per shipment. Asian and Middle Eastern buyers pivot to lower-spec microbolometers or seek domestically produced cooled detectors that skirt the threshold, trading performance for procurement speed. Western suppliers report 25% fewer international orders in 2025 compared with 2024 because of license denials. The restriction also fragments global R&D collaboration as cross-border technical-data exchanges now require government-approved agreements. Emerging superlattice materials aim to reset the regulatory floor, but widespread qualification remains at least four years away.
Price Erosion in Passive PIR Components
Average selling prices for discrete pyroelectric sensors fell about 15% in 2025 after Chinese capacity additions overshot demand from commercial-real-estate retrofits. Margin squeeze pushed incumbents such as Murata and Panasonic toward higher-value microbolometer modules that command two to three times the revenue per channel. OEMs consolidated supplier rosters, agreeing to long-term volume contracts that exchange scale for single-digit price cuts, locking out smaller vendors. Meanwhile, system value is migrating to cloud analytics and machine-learning models that reside off the sensor, making commoditized PIR elements even more interchangeable. The resulting race to the bottom limits R&D reinvestment in next-generation pyroelectric materials.
*Our forecasts treat driver/restraint impacts as directional, not additive. The impact forecasts reflect baseline growth, mix effects, and variable interactions.
Segment Analysis
By Detector Type: Quantum Arrays Gain in Automotive Sensing
Photo quantum arrays are projected to expand at an 11.80% CAGR, nearly double the overall infrared detector market, as automakers embed indium-gallium-arsenide avalanche photodiodes in highway-range LiDAR and mercury-cadmium-telluride in night-vision cameras. Thermal detectors, holding 68.46% of 2025 revenue, dominate cost-sensitive industrial and building-automation roles where passive operation and ambient-temperature tolerance outweigh the speed advantages of quantum devices. Because mature microbolometer supply chains can fabricate 640×480 arrays for under USD 50, the thermal camp anchors mass-market pricing. Yet the automotive pivot toward Level 3 autonomy raises per-vehicle detector content, nudging volume into the quantum camp and lifting average selling prices inside the infrared detector market.
Quantum growth depends on high-yield epitaxy of indium-gallium-arsenide and mercury-cadmium-telluride on lattice-matched substrates that remain scarce and expensive. Japan and Taiwan are scaling 200-millimeter epitaxial reactors to widen wafer diameters, which could cut die cost by as much as 30% once line yields exceed 60%. If those capacity ramps stay on track, the infrared detector market size attributed to quantum arrays for automotive and spectroscopy may reach USD 0.30 billion by 2031. Industrial thermography retains a stronghold for thermal detectors, but their share will slip below 60% as quantum adoption broadens into high-speed machine vision and hyperspectral biomedical imaging. The infrared detector industry thus faces a two-track future in which price-led thermal arrays coexist with performance-driven quantum devices.


By Cooling Technology: Uncooled Dominance Persists Amid Cooled Resurgence
Uncooled devices captured 83.71% of 2025 revenue as smartphone add-ons, driver-monitoring cameras, and drone gimbals require low-power, room-temperature operation. The segment’s cost advantage widened with wafer-level packaging that slashes assembly expense 40% and compresses module footprints below 10 millimeters. Cooled designs, however, are growing at a 10.90% CAGR because defense and long-range border-surveillance programs demand sub-20 millikelvin sensitivity. These programs procure high-price cooled cameras, often exceeding USD 20,000 each, and therefore punch above their unit volumes in dollar terms, enlarging the infrared detector market size for cryogenic systems.
Advances in pulse-tube and linear-drive Stirling coolers have extended the mean time between failures to 15,000 hours, easing maintenance burdens that once deterred commercial buyers. Scientific instruments and astronomy payloads are also adopting cooled focal-plane arrays for mid-wave spectroscopy, where thermal noise must be suppressed below detector shot noise. While cooled shipments remain a minority, their revenue share could top 22% by 2031 if export-control bottlenecks ease. The net result keeps uncooled architectures at volume leadership yet allows cooled niches to regain pricing leverage inside the broader infrared detector market.
By Material: InGaAs Surges on Semiconductor Inspection Demand
Microbolometers contributed 64.27% of 2025 revenue by leveraging silicon-compatible thin films that ride semiconductor economies of scale. Indium-gallium-arsenide is accelerating at a 13.21% CAGR on the strength of wafer inspection and 1,550-nanometer LiDAR that benefits from higher allowable laser power under IEC 60825-1. Mercury-cadmium-telluride prevails in dual-band military imagers thanks to tunable band-gap chemistry that spans 3-12 micrometers. Pyroelectric and thermopile volumes slide as occupancy sensing migrates to high-resolution microbolometers able to map people counts for smart-building analytics, a transition squeezing single-element component margins across the infrared detector industry.
Scaling indium-gallium-arsenide beyond four-inch wafers poses lattice-mismatch and defect challenges that drive substrate prices above USD 500 per piece. Collaborative programs between substrate vendors and equipment makers aim to push 150-millimeter diameters by 2028, a milestone that could lower die cost enough for consumer LiDAR. Mercury-cadmium-telluride faces environmental scrutiny under the EU RoHS Directive, spurring research into indium-arsenide/gallium-antimonide superlattices that promise equivalent performance without toxic mercury. The materials landscape therefore balances scalability, regulation, and application-specific performance as each segment looks to protect or grow its share of the infrared detector market.
By Spectral Range: SWIR Ascends on Dual-Use Momentum
Long-wave infrared commanded 45.83% of 2025 revenue because it pairs naturally with uncooled microbolometers in low-temperature thermography. Short-wave infrared is the fastest climber at a 14.58% CAGR, propelled by simultaneous gains in wafer inspection and automotive LiDAR that require penetration beyond the silicon absorption edge and eye-safe power budgets. Mid-wave infrared serves defense seekers and airborne surveillance, while near-infrared and far-infrared remain niche science and spectroscopy domains.
Volume pivots toward SWIR will redistribute material demand toward indium-gallium-arsenide and away from vanadium-oxide microbolometers. Still, the infrared detector market share for LWIR will stay above 35% by 2031 because predictive-maintenance and firefighting cameras rely on the 8-14 micrometer atmospheric window. Multi-spectral imagers blending visible, SWIR, and LWIR into a single package are gaining traction in precision agriculture, hinting at future devices that allocate pixel real estate dynamically according to application need. Such hybrid designs could further stretch the total infrared detector market size by opening performance tiers not served by single-band sensors.
By Application: Automotive ADAS and LiDAR Outpace Legacy Thermography
Thermography and temperature measurement produced 24.94% of 2025 demand, anchoring replacement cycles in process industries and utility asset management. Automotive ADAS and LiDAR, however, are forecast to post an 18.43% CAGR as Level 3 autonomy shifts from pilot to volume manufacturing, increasing detector content per vehicle from roughly USD 50 in 2025 to upward of USD 300 by 2031. People and motion sensing, industrial monitoring, and fire-and-gas detection still represent nearly 40% of shipments, but their growth lags mobility use cases that ride electric-vehicle scalability.
As autonomous functions proliferate, the infrared detector market size attached to automobiles could exceed USD 0.25 billion by 2031, narrowing the gap with industrial thermography. Spectroscopy and biomedical imaging remain constrained by high system costs, though hospital trials of hyperspectral endoscopes for oncology could unlock reimbursement pathways post-2027. Environmental monitoring via satellite and drones continues to draw on both SWIR and LWIR bands for wildfire detection and greenhouse-gas mapping. The breadth of emerging uses positions the infrared detector industry for diversified growth rather than singular dependence on any one domain.

By End-Use Industry: Automotive Sector Accelerates Past Industrial Base
Industrial manufacturing accounted for 31.03% of 2025 revenue, buoyed by decades of installed thermal camera bases in European petrochemical hubs. The automotive sector, expanding at a 12.64% CAGR, is on pace to eclipse industrial volume by late decade as LiDAR and driver-monitoring migrate from premium to mid-range vehicles. Aerospace and defense accounted for 20% of sales, driven by demand for cooled detectors for surveillance pods and missile seekers. Oil, gas, and energy users are layering infrared into hydrogen plants and LNG terminals, embedding continuous cameras where point sensors once sufficed.
Consumer electronics and smart infrastructure form a fragmented but fast-cycling demand pool where product lifetimes are measured in quarters, not years. Smartphone makers treat thermal imaging as a differentiator in flagship devices priced above USD 800, though attach rates remain in the single digits. Municipalities retrofit streetlights and traffic signals with micro-bolometer arrays to count pedestrians and optimize lighting schedules, turning cities into steady but modest buyers. The net shift tilts the infrared detector market toward mobility and infrastructure-as-a-service, underscoring why automotive growth shapes supplier roadmaps.
Geography Analysis
Asia-Pacific generated 40.15% of 2025 revenue, lifted by China’s 9 million electric-vehicle shipments and regional semiconductor inspection demand. The infrared detector market size for Asia-Pacific could exceed USD 0.40 billion by 2031 if LiDAR attach rates reach 30% on new cars. Japan anchors epitaxial wafer supply, while South Korea scales indium-gallium-arsenide fabs to support domestic memory foundries. Emerging Southeast Asian drone makers are adopting LWIR microbolometers for crop-health surveys, broadening application footprints across the bloc.
Europe contributed roughly 25% of 2025 sales on the back of thermography mandates in process plants and defense spending on cooled mid-wave systems. Replacement cycles every five to seven years generate predictable base-load demand, while tightened industrial-emissions rules add incremental unit sales. Leading detector houses in France and Germany leverage proximity to NATO prime contractors, enabling rapid customization for armored-vehicle sights and soldier-borne systems. Eastern Europe shows early adoption of building-automation sensors to satisfy updated EU energy codes, offering a diffuse but rising tail for uncooled volumes.
The Middle East, though less than 8% of 2025 revenue, is forecast at a 10.30% CAGR as Saudi and Emirati hydrogen projects translate policy into procurement. Each gigawatt of electrolyzer capacity pulls in about 500 mid-wave and LWIR cameras for leak detection, a density far above that in legacy oil-and-gas facilities. North America remains defense-heavy, with multi-year Army and Homeland Security programs ensuring steady orders for cooled arrays. South America and Africa together account for less than 10% of global sales because limited financing and political risk slow large-scale deployments, though Brazilian agriculture and South African mining provide targeted growth niches.

Competitive Landscape
The top five suppliers, Teledyne FLIR, Lynred, Hamamatsu Photonics, Excelitas, and Leonardo DRS, accounted for about 45% of 2025 revenue, indicating moderate concentration in the infrared detector market. Their vertically integrated fabs, in-house readout-IC design, and proprietary cryocoolers create barriers for new entrants. Chinese challengers iRay Technology, Hikmicro, and Guide Sensmart undercut list prices by up to 30% in uncooled modules, capturing design wins in consumer thermal cameras and building-automation sensors. Western incumbents safeguard high-margin cooled arrays through defense contracting channels that require ITAR compliance and field-proven reliability records.
Technology roadmaps diverge along cost-versus-performance lines. Volume-oriented players invest in 200-millimeter wafer lines and automated pick-and-place assembly to shave cents per pixel, while military suppliers push type-II superlattice materials and single-photon avalanche diode arrays for next-generation seekers. Wafer-level packaging has become the universal upgrade path, compressing vacuum seals, getters, and optical coatings into a monolithic stack that reduces module height by 30%. Customers now ask for ISO 9001 and IATF 16949 process controls as prerequisites for automotive programs, raising compliance costs by roughly 15% but opening multi-million-unit addressable volumes.
Strategic activity intensified in 2025-2026. Teledyne FLIR earmarked USD 45 million to boost microbolometer capacity in California, while Lynred secured a EUR 30 million defense contract for cooled mid-wave arrays. Hamamatsu debuted a 640×512 indium gallium arsenide sensor targeting LiDAR, and iRay commissioned a new microbolometer fab in Wuhan. Excelitas added thermopile assets via acquisition, signaling consolidation among mid-tier suppliers. The competitive landscape therefore balances capacity expansion, material innovation, and merger-and-acquisition plays as firms defend or grow their slices of the infrared detector market.
Infrared Detector Industry Leaders
Honeywell International Inc.
Teledyne FLIR
Lynred (ULIS + Sofradir)
Hamamatsu Photonics
Excelitas Technologies
- *Disclaimer: Major Players sorted in no particular order

Recent Industry Developments
- January 2026: Teledyne FLIR announced a USD 45 million expansion of its Goleta, California, focal-plane-array fab, adding molecular-beam epitaxy tools to lift sub-10-micrometer microbolometer output by 50%.
- November 2025: Lynred won a EUR 30 million contract from France’s Ministry of Armed Forces for 1,280×1,024 cooled mid-wave detectors used in Leclerc tank sights.
- September 2025: Hamamatsu Photonics launched a 640×512 indium-gallium-arsenide array optimized for 1,550 nanometer LiDAR, entering volume production in December 2025.
- July 2025: L3Harris Technologies secured a USD 120 million U.S. Army contract for cooled LWIR detectors supporting the Next Generation Combat Vehicle program.


Global Infrared Detector Market Report Scope
Infrared detectors are used to sense the specific characteristics of its surroundings by either detecting or emitting infrared radiation. These electronic detectors can also sense motion and measure heat emitted by objects. With the advancements in technology, infrared sensors have become light in weight and have also become more affordable. Also, the power consumption in such sensors is too low.
The Infrared Detector Market Report is Segmented by Detector Type (Thermal, and Photo Quantum), Cooling Technology (Uncooled, and Cooled), Material (Microbolometer, InGaAs, MCT, Pyroelectric, and Thermopile), Spectral Range (NIR, SWIR, MWIR, LWIR, and FIR), Application(People and Motion Sensing, and More), End-Use Industry (Aerospace and Defense, and More), and Geography. The Market Forecasts are Provided in Terms of Value (USD).
| Thermal Detector |
| Photo (Quantum) Detector |
| Uncooled Infrared Detector |
| Cooled Infrared Detector |
| Microbolometer |
| InGaAs (Indium Gallium Arsenide) |
| MCT (Mercury Cadmium Telluride) |
| Pyroelectric |
| Thermopile |
| Near-Wave Infrared (NIR) |
| Short-Wave Infrared (SWIR) |
| Mid-Wave Infrared (MWIR) |
| Long-Wave Infrared (LWIR) |
| Far-Infrared (FIR) |
| People and Motion Sensing |
| Temperature Measurement / Thermography |
| Industrial Process Monitoring |
| Spectroscopy and Biomedical Imaging |
| Fire and Gas Detection |
| Automotive ADAS and LiDAR |
| Environmental and Agriculture Monitoring |
| Other Applications (Building and HVAC Automation, Smart Homes, Military and Defense, etc.) |
| Aerospace and Defense |
| Industrial Manufacturing |
| Automotive |
| Oil, Gas and Energy |
| Healthcare and Life Sciences |
| Consumer Electronics |
| Smart Infrastructure |
| Others |
| North America | United States | |
| Canada | ||
| Mexico | ||
| South America | Brazil | |
| Argentina | ||
| Rest of South America | ||
| Europe | Germany | |
| United Kingdom | ||
| France | ||
| Italy | ||
| Spain | ||
| Rest of Europe | ||
| Asia Pacific | China | |
| Japan | ||
| South Korea | ||
| India | ||
| Australia | ||
| New Zealand | ||
| Rest of Asia-Pacific | ||
| Middle East and Africa | Middle East | United Arab Emirates |
| Saudi Arabia | ||
| Turkey | ||
| Rest of Middle East | ||
| Africa | South Africa | |
| Nigeria | ||
| Kenya | ||
| Rest of Africa | ||
| By Detector Type | Thermal Detector | ||
| Photo (Quantum) Detector | |||
| By Cooling Technology | Uncooled Infrared Detector | ||
| Cooled Infrared Detector | |||
| By Material | Microbolometer | ||
| InGaAs (Indium Gallium Arsenide) | |||
| MCT (Mercury Cadmium Telluride) | |||
| Pyroelectric | |||
| Thermopile | |||
| By Spectral Range | Near-Wave Infrared (NIR) | ||
| Short-Wave Infrared (SWIR) | |||
| Mid-Wave Infrared (MWIR) | |||
| Long-Wave Infrared (LWIR) | |||
| Far-Infrared (FIR) | |||
| By Application | People and Motion Sensing | ||
| Temperature Measurement / Thermography | |||
| Industrial Process Monitoring | |||
| Spectroscopy and Biomedical Imaging | |||
| Fire and Gas Detection | |||
| Automotive ADAS and LiDAR | |||
| Environmental and Agriculture Monitoring | |||
| Other Applications (Building and HVAC Automation, Smart Homes, Military and Defense, etc.) | |||
| By End-Use Industry | Aerospace and Defense | ||
| Industrial Manufacturing | |||
| Automotive | |||
| Oil, Gas and Energy | |||
| Healthcare and Life Sciences | |||
| Consumer Electronics | |||
| Smart Infrastructure | |||
| Others | |||
| By Geography | North America | United States | |
| Canada | |||
| Mexico | |||
| South America | Brazil | ||
| Argentina | |||
| Rest of South America | |||
| Europe | Germany | ||
| United Kingdom | |||
| France | |||
| Italy | |||
| Spain | |||
| Rest of Europe | |||
| Asia Pacific | China | ||
| Japan | |||
| South Korea | |||
| India | |||
| Australia | |||
| New Zealand | |||
| Rest of Asia-Pacific | |||
| Middle East and Africa | Middle East | United Arab Emirates | |
| Saudi Arabia | |||
| Turkey | |||
| Rest of Middle East | |||
| Africa | South Africa | ||
| Nigeria | |||
| Kenya | |||
| Rest of Africa | |||


Key Questions Answered in the Report
What is the forecast value of the infrared detector market in 2031?
The market is projected to reach USD 0.98 billion by 2031.
Which detector type is growing fastest through 2031?
Photo quantum arrays, particularly indium-gallium-arsenide and mercury-cadmium-telluride, are set to grow at 11.80% CAGR.
Why is short-wave infrared gaining traction in automotive applications?
1,550 nanometer SWIR enables higher eye-safe laser power for LiDAR, extending detection range to roughly 300 meters.
How do ITAR regulations influence global cooled detector sales?
Export licenses add up to 12 months and significant legal costs, steering some buyers toward uncooled or domestic alternatives.
Page last updated on:


