Industrial Internet Of Things (IIoT) Market Size and Share
Market Overview
| Study Period | 2020 - 2031 |
|---|---|
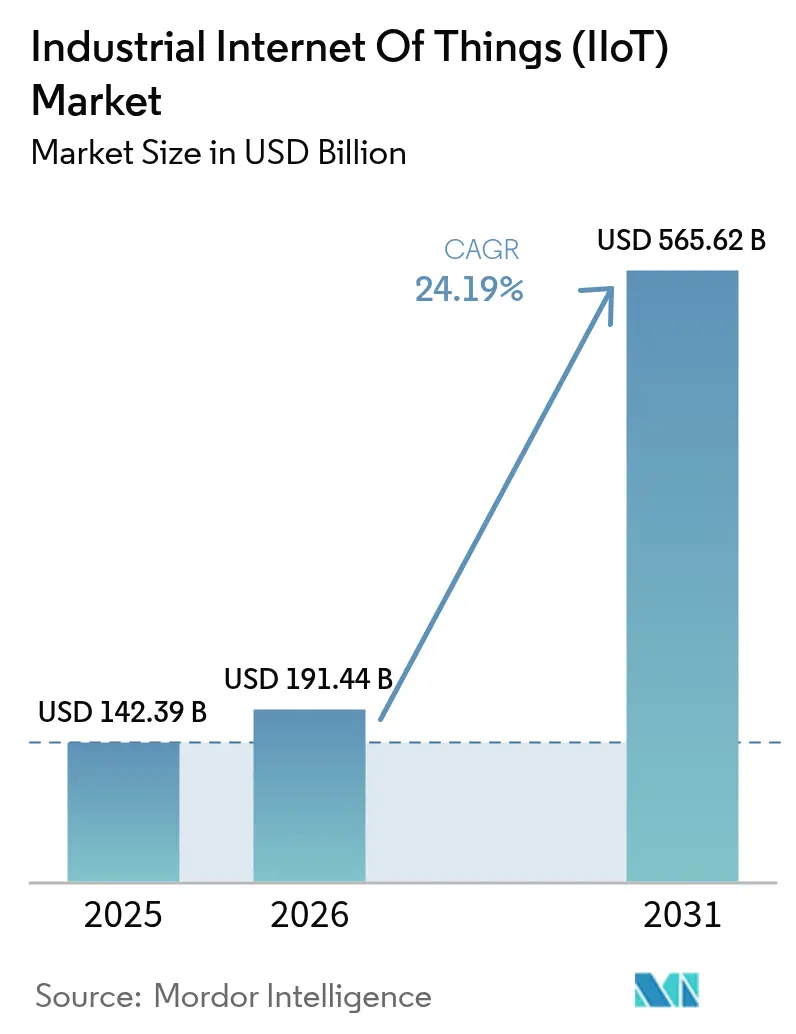
| Market Size (2026) | USD 191.44 Billion |
| Market Size (2031) | USD 565.62 Billion |
| Growth Rate (2026 - 2031) | 24.19% CAGR |
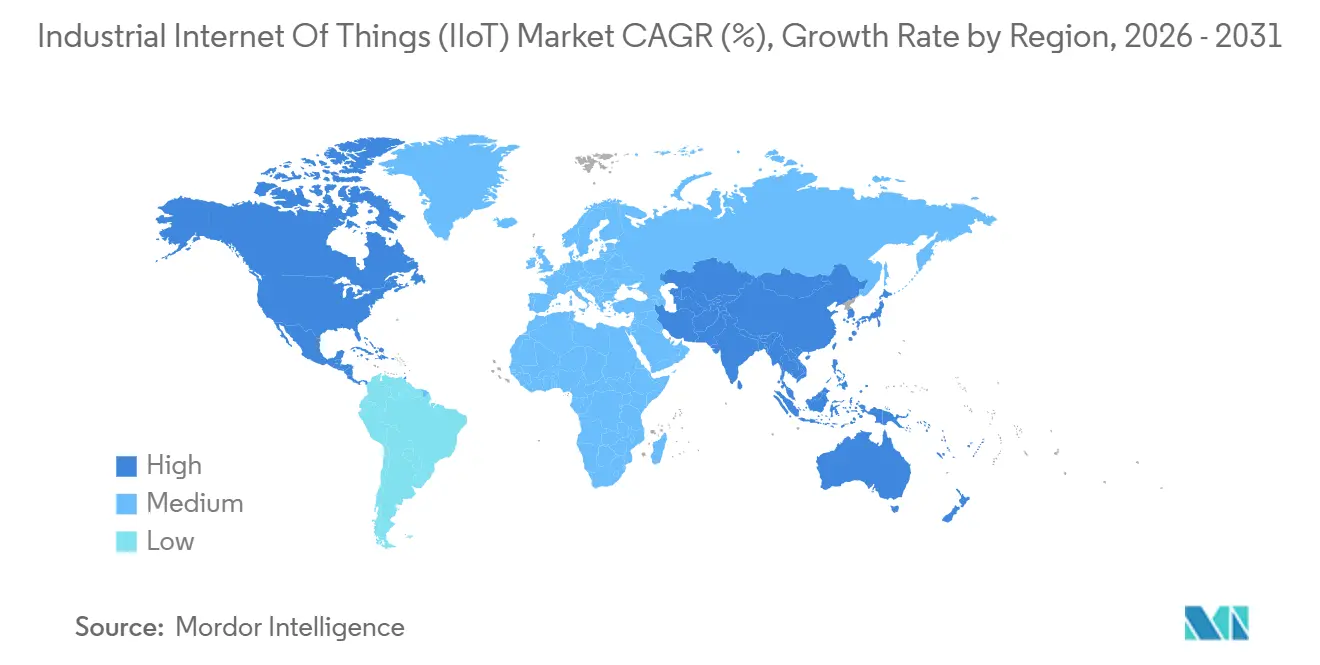
| Fastest Growing Market | Asia Pacific |
| Largest Market | North America |
| Market Concentration | Medium |
Major Players *Disclaimer: Major Players sorted in no particular order Image © Mordor Intelligence. Reuse requires attribution under CC BY 4.0. | |
Industrial Internet Of Things (IIoT) Market Analysis by Mordor Intelligence
The industrial internet of things market size is expected to increase from USD 142.39 billion in 2025 to USD 191.44 billion in 2026 and reach USD 565.62 billion by 2031, growing at a CAGR of 24.19% over 2026-2031. Soaring investments in connected sensors, edge-AI inference, and private 5G campus networks are transforming once-manual inspections into real-time, closed-loop control processes. Demand for deterministic latency is steering factories toward chiplet-based edge accelerators that deliver sub-millisecond inference, while hybrid data-sovereignty architectures keep proprietary recipes on-site and push noncritical workloads into hyperscaler clouds. Rapid cost declines in optical and MEMS sensors are widening deployment economics to include secondary pumps, dampers, and conveyors formerly deemed too low value for instrumentation. Meanwhile, predictive-maintenance pilots showing 30%-50% downtime cuts are persuading finance chiefs to green-light multi-facility rollouts despite lingering cyber-risk on aging operational-technology assets.
Key Report Takeaways
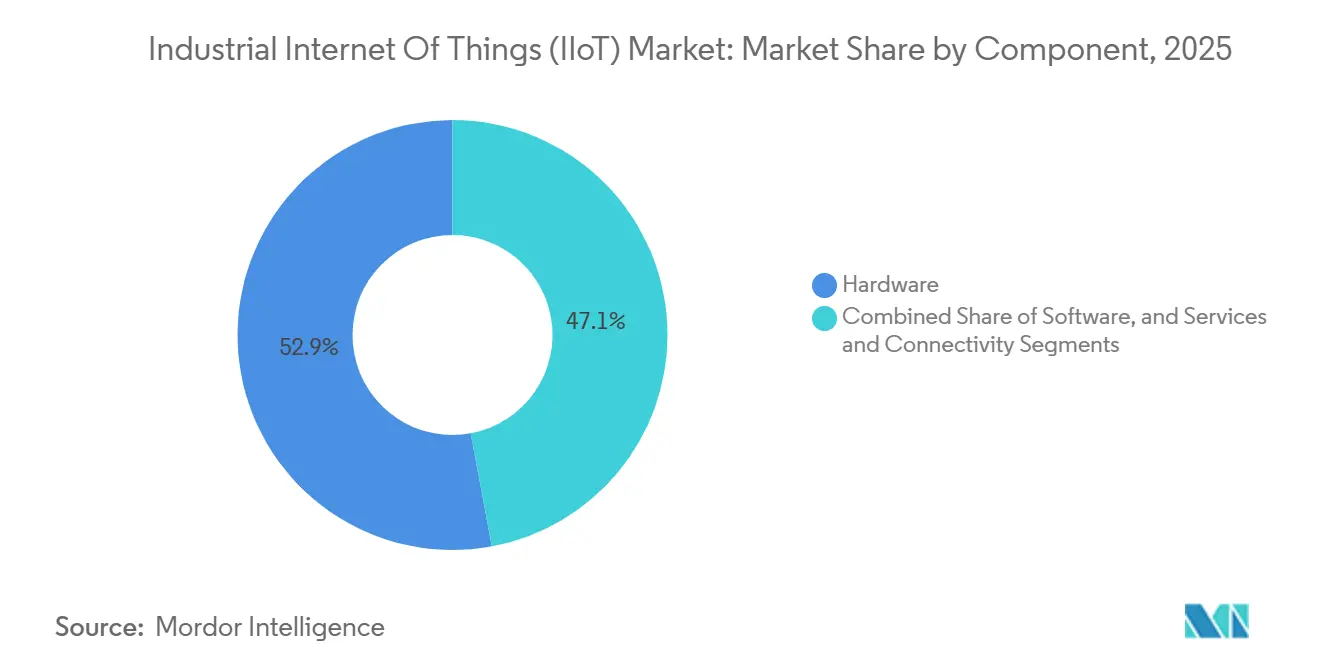
- By component, hardware led with 52.93% of industrial internet of things market share in 2025, while services and connectivity are forecast to expand at a 24.87% CAGR through 2031.
- By deployment model, hybrid / edge-cloud architectures accounted for 47.33% revenue share in 2025 and are projected to grow at a 25.11% CAGR to 2031.
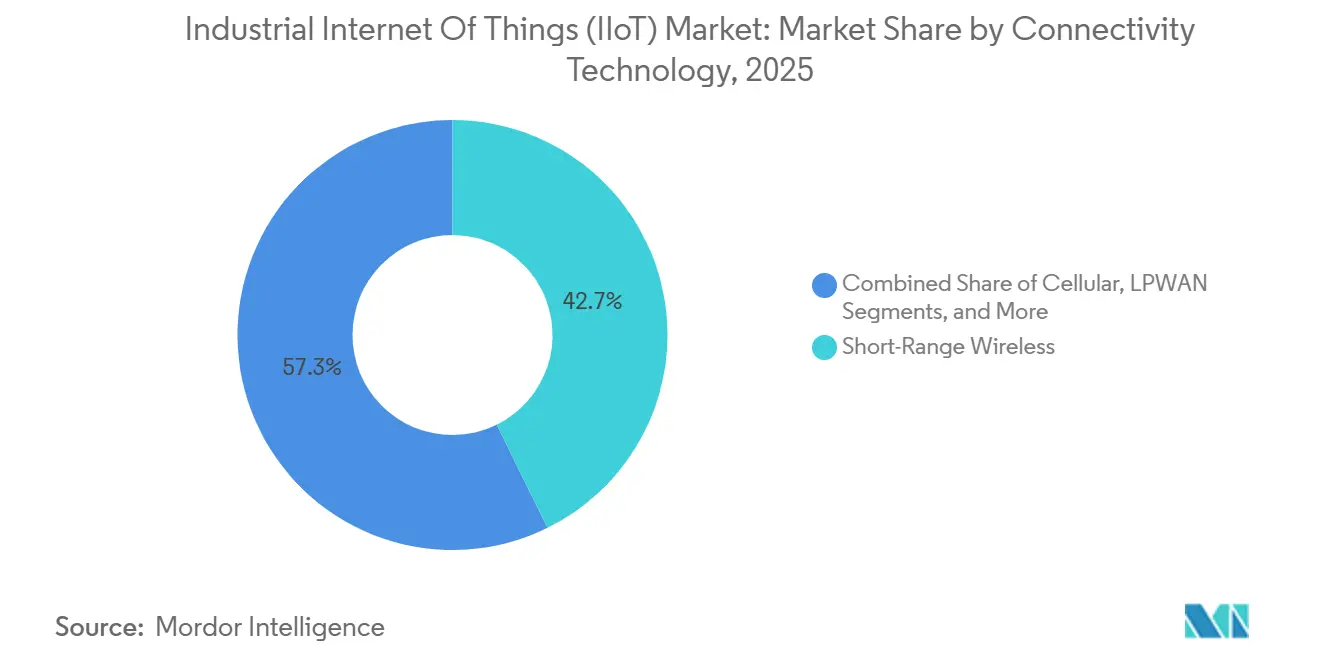
- By connectivity technology, wired links still dominate, yet cellular solutions are poised to rise at a 25.03% CAGR, outpacing all other wireless formats.
- By end-user vertical, manufacturing contributed 41.84% of 2025 spending, whereas healthcare and pharmaceuticals are set to advance at a 24.91% CAGR through 2031.
- By geography, North America held 36.53% revenue share in 2025, but Asia-Pacific is on track for a 25.99% CAGR, the fastest regional growth pace.
Note: Market size and forecast figures in this report are generated using Mordor Intelligence’s proprietary estimation framework, updated with the latest available data and insights as of 2026.
Global Industrial Internet Of Things (IIoT) Market Trends and Insights
Drivers Impact Analysis*
| Driver | (~) % Impact on CAGR Forecast | Geographic Relevance | Impact Timeline |
|---|---|---|---|
| Integration of advanced sensors and declining device ASPs | +4.2% | Global, concentrated in Asia-Pacific manufacturing hubs | Medium term (2-4 years) |
| Predictive-maintenance and OEE optimisation push | +5.1% | North America and Europe discrete manufacturing; Asia-Pacific process industries | Short term (≤ 2 years) |
| Government-backed smart-manufacturing programmes | +3.8% | United States, European Union, China, India | Long term (≥ 4 years) |
| Emergence of private 5G / 6G industrial campus networks | +4.6% | North America, Europe, South Korea, Thailand, Middle East pilots | Medium term (2-4 years) |
| ESG-driven energy-intensity benchmarking mandates | +2.9% | Core EU members with spill-over to North America and select Asia-Pacific | Long term (≥ 4 years) |
| Chiplet-based industrial edge-AI accelerators | +3.7% | Global, led by North America and Asia-Pacific semiconductor ecosystems | Medium term (2-4 years) |
| Source: Mordor Intelligence | |||
Integration of Advanced Sensors and Declining Device ASPs
Average selling prices for industrial sensors fell 15%–20% each year after 2024, enabling operators to monitor pumps, HVAC dampers, and conveyor idlers that collectively account for nearly 40% of plant energy draw. Optical and MEMS units displace thermocouples because they self-calibrate, output digitized signals, and bundle multiple measurements. The sudden influx of petabyte-scale time-series data raises demand for edge gateways and scalable analytics. Component makers now ship sensors pre-integrated with LoRaWAN, NB-IoT, or BLE radios to remove firmware work from plant engineers.[1]“Editorial Board, “Sensor Bundling with Connectivity Modules,” Financial Times, ft.com Expanded instrumentation directly enlarges the industrial internet of things market by shifting value from high-value rotating assets to thousands of lower-cost ancillary devices.
Predictive-Maintenance and OEE Optimization Push
Manufacturers record 12%–18% OEE lifts by pivoting from calendar to condition-based maintenance; Dover Corporation documented a 12% improvement on industrial refrigeration lines. Vibration, oil-debris, and infrared feeds now flow through edge servers running machine-learning models trained on historical failure modes. Predictive vendors increasingly offer outcome-based pricing linked to uptime, absorbing risk that once fell on plant owners. Continuous-process sectors, where a single outage costs USD 500,000–2 million a day, lead adoption. These economic gains are a principal catalyst behind the expanding industrial internet of things market.
Government-Backed Smart-Manufacturing Programmes
Public funding lowers adoption risk for smaller enterprises. The United States CHIPS and Science Act devoted USD 285 million to a National Digital Twin Institute in 2024. Horizon Europe earmarked EUR 1.2 billion for Industry 4.0 pilot sites across Germany, France, and Italy. China extended Made in China 2025 subsidies, covering up to 40% of smart-factory CAPEX, while India’s PLI scheme reimburses 6% of incremental sales tied to real-time quality monitoring. These incentives establish reference architectures that ripple through the industrial internet of things market.
Emergence of Private 5G / 6G Industrial Campus Networks
Thailand’s telecom regulator reserved 3.7 GHz spectrum solely for private industry in 2025; within a year, 50+ factories installed dedicated 5G cells. NTT DATA and Cargill linked 50 grain-processing sites with private LTE-M and 5G, securing sub-10 ms response thresholds. U.S. CBRS licenses enabled John Deere to connect precision agriculture rigs over miles-wide fields. Hyperscalers now bundle spectrum, infrastructure, and managed services, lowering RF-engineering barriers for midsize firms. The resulting low-latency backbone underpins real-time loops critical to the industrial internet of things market.
Restraints Impact Analysis*
| Restraint | (~) % Impact on CAGR Forecast | Geographic Relevance | Impact Timeline |
|---|---|---|---|
| Legacy OT cyber-vulnerabilities | -3.4% | Global, acute in North America and Europe | Short term (≤ 2 years) |
| Vendor-lock and protocol-interoperability gaps | -2.8% | Global, especially multi-site enterprises | Medium term (2-4 years) |
| Brown-field digital-twin talent scarcity | -2.1% | North America, Europe, selected Asia-Pacific markets | Long term (≥ 4 years) |
| Shadow-IT risk from low-code IIoT apps | -1.6% | Global, concentrated in discrete manufacturing | Short term (≤ 2 years) |
| Source: Mordor Intelligence | |||
Legacy OT Cyber-Vulnerabilities
A November 2024 ransomware attack on Rockwell Automation encrypted engineering workstations and crippled remote support, highlighting how air-gapped assumptions no longer suffice. Dragos cataloged 14 control-system vulnerabilities with CVSS scores above 8 in 2024 . Firmware patching often voids warranties, trapping operators in security-versus-uptime dilemmas. Cyber insurers now exclude OT losses or charge steep surcharges, which delays investment in the industrial internet of things market among food and pharma plants that prize continuity.
Vendor-Lock and Protocol-Interoperability Gaps
Closed APIs from incumbent automation vendors inflate middleware costs; enterprises spend up to 30% of IIoT budgets bridging OPC UA, MQTT, and proprietary schemas. While OPC UA excels at telemetry, configuration write-back lags, limiting full closed-loop control. Standards bodies move slower than vendor roadmaps, so fragmentation endures. This technical debt tempers the otherwise rapid expansion of the industrial internet of things market.
*Our forecasts treat driver/restraint impacts as directional, not additive. The impact forecasts reflect baseline growth, mix effects, and variable interactions.
Segment Analysis
By Component: Services Integration Outpaces Device Revenue
Hardware delivered 52.93% revenue in 2025, spanning gateways, edge servers, and rugged sensors that anchor the industrial internet of things market. Services and connectivity, however, are projected to post a 24.87% CAGR, overtaking hardware as integrators bundle device management, private-network SLAs, and analytics subscriptions. Software suites positioned between the two layers enjoy recurring license revenue and high gross margins, especially when shipped as vertical templates. Edge servers migrate toward fanless DIN-rail designs certified for extreme temperatures, while sensors integrate BLE and Wi-Fi 6E radios to cut bills of material 15%.[2]Product Brief, “Industrial Edge Servers,” Intel, intel.com Connectivity contracts now mirror telecom managed services, aligning vendor incentives with uptime. Together, these shifts underscore how integration value creation is reshaping the industrial internet of things market.
The pivot toward services signals maturation. Once customers purchase gateways outright, but rising architectural complexity prompts multiyear engagements covering design, deployment, and support. Hyperscalers fold device on-boarding, OTA updates, and time-series storage into broader cloud suites, squeezing stand-alone platform vendors. As margins migrate from metal to know-how, the industrial internet of things industry must cultivate domain specialists proficient in both OT protocols and cloud DevOps. Vendor success increasingly hinges on delivering outcome guarantees rather than unit shipments.


By Deployment Model: Hybrid Architectures Dominate
Hybrid / edge-cloud landscapes controlled 47.33% of 2025 revenue and are poised for a 25.11% CAGR. Sovereign control over recipes and batch data keeps sensitive workloads on-site, while upstream analytics exploit hyperscaler elasticity. On-premise estates persist in regulated verticals such as aerospace and pharmaceuticals, yet software-defined automation now abstracts hardware to allow seamless migration when rules evolve. Cloud-first greenfield sites remain minority share because retrofitting serial PLCs with IP stacks dilutes ROI.
Edge computing bifurcates into protocol-translation gateways and rugged servers capable of Kubernetes deployments. Distributions such as K3s permit uniform DevOps pipelines from cloud to shop floor, simplifying governance. Supply criticality drives twin deployment modes: low-latency AI at the edge for vision inspection and batch analysis in cloud for energy benchmarking, both integral to the industrial internet of things market size narrative. Compliance frameworks extend to edge nodes through hardened images, mitigating cyber-threat vectors without stalling innovation.
By Connectivity Technology: Cellular Gains on Wired Incumbents
Wired Ethernet and fieldbus links still anchor process industries, yet cellular captured momentum with a 25.03% CAGR forecast. Private 5G offers deterministic 1 ms latency and supports thousands of devices per cell, suiting automotive body-in-white lines and electronics SMT floors where reliability and density converge. LPWAN formats, LoRaWAN and NB-IoT, excel in remote oil wells, mines, and agriculture. LoRaWAN gateways span 10 km, connecting battery nodes that last years, a sweet spot for dispersed asset fleets.
Short-range BLE and Wi-Fi 6E equip autonomous mobile robots, scanners, and wearables inside factories. Multi-band modules now ship supporting LTE-M, NB-IoT, and 5G NR in a single SKU, easing inventory headaches. Still, coexistence remains reality; many facilities run fiber backbones, private 5G for latency-critical flows, and LoRaWAN for yard-level telemetry. Unified connectivity orchestrators emerge to cut OPEX, an essential evolution as the industrial internet of things market pursues scale.
By End-User Vertical: Healthcare Surges on Serialization Mandates
Manufacturing retained 41.84% spending in 2025, split between discrete assembly and continuous processing. Yet healthcare and pharmaceuticals are set for the steepest ascent at 24.91% CAGR because unit-level serialization under the DSCSA and EU FMD compels real-time code verification on packaging lines. Cold-chain integrity for biologics and mRNA vaccines demands high-resolution temperature logging, boosting wireless sensor demand. Oil and gas prioritize pipeline integrity over vast geographies, leveraging satellite LPWAN links, while utilities digitize distribution grids to balance renewables.
Transportation and logistics embed telematics to trim fuel and curtail spoilage. Mining outfits automate haulage trucks in explosive zones, requiring intrinsically safe designs certified to IECEx standards. Across sectors, value migrates from routine monitoring toward predictive, compliance, and optimization workflows, swelling total addressable revenue. These dynamics anchor long-range growth for the industrial internet of things market.
Geography Analysis
North America commanded 36.53% revenue in 2025 thanks to an advanced manufacturing base, abundant venture investment, and federal R&D outlays via the CHIPS Act and Manufacturing USA institutes. Nearshoring pulls automotive and electronics lines into Mexico and Canada, where smart-factory retrofits align with just-in-time mandates. Cybersecurity concerns slow some brownfield conversions, yet predictive-maintenance returns generally outweigh risk.
Asia-Pacific is forecast to grow at a 25.99% CAGR, the fastest pace among regions. China’s provincial incentives reimburse smart-factory CAPEX, India’s PLI scheme subsidizes IIoT infrastructure, and Japan’s Society 5.0 frames cyber-physical convergence. South Korea allocated KRW 500 billion to connect 10,000 SMEs by 2027. Australia and New Zealand emphasize mining and agriculture, where IoT economics favor high per-site spend.
Europe maintains sizable investment through Horizon Europe and national Industry 4.0 grants.[3]Agency Statement, “Horizon Europe Framework,” European Commission, ec.europa.eu Germany leads with edge-AI pilot clusters, France invests in pharma compliance systems, and Italy modernizes SME machine tools. The UK funds cyber-secure digital manufacturing amid supply-chain resiliency drives. The Middle East pilots IIoT in Saudi Vision 2030 industrial parks, while adoption in Africa and South America clusters around South African mining, Brazilian agribusiness, and Argentinian energy, is hindered by connectivity and currency fluctuation, yet is positioned for catch-up as satellite backhaul prices fall.

Competitive Landscape
The industrial internet of things market remains moderately fragmented; no vendor tops 10% share. Siemens, ABB, Schneider Electric, and Rockwell Automation upsell analytics atop installed PLC bases, while AWS IoT and Microsoft Azure IoT court greenfield projects by abstracting hardware complexity. Semiconductor firms Intel, NXP, and Infineon embed inference engines and secure enclaves inside microcontrollers, letting OEMs deliver sub-millisecond decisions without external accelerators.
Patent filings in time-sensitive networking and edge-AI have surged 40% since 2024 as IEEE 802.1 standards grant Ethernet deterministic behavior previously reserved for proprietary buses. Hyperscalers purchase domain software, AWS acquired a SCADA vendor in 2024, closing OT knowledge gaps. White-space remains in verticalized solutions such as pharma serialization and renewable energy grid analytics where generic platforms lack built-in workflows. Smaller entrants win by guaranteeing uptime or energy savings, moving revenue toward outcomes rather than licenses.
OPC Foundation’s Unified Architecture specification gains traction as a neutral layer, though vendors still bolt on proprietary extensions. Market entry barriers lower via chiplet modularity and cloud-native microservices, yet integration skill shortages and security concerns preserve moderate concentration. Overall, the industrial internet of things market scores 6 on the concentration scale because the top five suppliers control about 60% of revenue, leaving notable space for niche innovators.
Industrial Internet Of Things (IIoT) Industry Leaders
Siemens AG
Cisco Systems Inc.
ABB Ltd.
Rockwell Automation Inc.
Honeywell International Inc.
- *Disclaimer: Major Players sorted in no particular order


Recent Industry Developments
- February 2026: Siemens and NVIDIA partnered to embed Omniverse into Siemens Xcelerator, enabling physics-based digital-twin visualization that trims prototype cycles 30%–40%.
- January 2026: ABB acquired a European OT-security firm for USD 180 million, bolstering protection for brownfield sites.
- December 2025: Schneider Electric released EcoStruxure Automation Expert 2.0, compliant with IEC 61499 and decoupling logic from hardware.
- November 2025: AWS opened a Wavelength zone with Verizon in Detroit, furnishing sub-10 ms edge latency for automotive vision inspection.


Global Industrial Internet Of Things (IIoT) Market Report Scope
IoT is a network of internet-connected objects. These objects collect and exchange data using sensors embedded within them. IoT systems connect specialized devices designed for specific purposes with limited programmability and customizability. Moreover, IoT systems also store and process data in a distributed manner.
The Industrial Internet Of Things (IIoT) Market Report is Segmented by Component (Hardware, Software, Services and Connectivity), Deployment Model (On-premises, Cloud, and Hybrid/Edge-Cloud), Connectivity Technology (Wired, Short-Range Wireless, Cellular, and LPWAN), End-user Vertical (Discrete Manufacturing, Process Manufacturing, Oil and Gas, and More), and Geography. The Market Forecasts are Provided in Terms of Value (USD).
| Hardware |
| Software |
| Services and Connectivity |
| On-premises |
| Cloud |
| Hybrid / Edge-Cloud |
| Wired (Ethernet, PROFINET, Modbus-TCP) |
| Short-Range Wireless (BLE, Wi-Fi 6/6E) |
| Cellular (4G LTE-M, Private 5G) |
| LPWAN (LoRa WAN, Sigfox, NB-IoT) |
| Discrete Manufacturing |
| Process Manufacturing |
| Oil and Gas |
| Utilities (Power, Water) |
| Transportation and Logistics |
| Mining and Metals |
| Healthcare and Pharmaceuticals |
| Other Verticals |
| North America | United States |
| Canada | |
| Mexico | |
| South America | Brazil |
| Argentina | |
| Rest of South America | |
| Europe | Germany |
| United Kingdom | |
| France | |
| Italy | |
| Spain | |
| Rest of Europe | |
| Asia-Pacific | China |
| India | |
| Japan | |
| South Korea | |
| Australia and New Zealand | |
| Rest of Asia-Pacific | |
| Middle East | Saudi Arabia |
| United Arab Emirates | |
| Turkey | |
| Rest of Middle East | |
| Africa | South Africa |
| Nigeria | |
| Egypt | |
| Rest of Africa |
| By Component | Hardware | |
| Software | ||
| Services and Connectivity | ||
| By Deployment Model | On-premises | |
| Cloud | ||
| Hybrid / Edge-Cloud | ||
| By Connectivity Technology | Wired (Ethernet, PROFINET, Modbus-TCP) | |
| Short-Range Wireless (BLE, Wi-Fi 6/6E) | ||
| Cellular (4G LTE-M, Private 5G) | ||
| LPWAN (LoRa WAN, Sigfox, NB-IoT) | ||
| By End-user Vertical | Discrete Manufacturing | |
| Process Manufacturing | ||
| Oil and Gas | ||
| Utilities (Power, Water) | ||
| Transportation and Logistics | ||
| Mining and Metals | ||
| Healthcare and Pharmaceuticals | ||
| Other Verticals | ||
| By Geography | North America | United States |
| Canada | ||
| Mexico | ||
| South America | Brazil | |
| Argentina | ||
| Rest of South America | ||
| Europe | Germany | |
| United Kingdom | ||
| France | ||
| Italy | ||
| Spain | ||
| Rest of Europe | ||
| Asia-Pacific | China | |
| India | ||
| Japan | ||
| South Korea | ||
| Australia and New Zealand | ||
| Rest of Asia-Pacific | ||
| Middle East | Saudi Arabia | |
| United Arab Emirates | ||
| Turkey | ||
| Rest of Middle East | ||
| Africa | South Africa | |
| Nigeria | ||
| Egypt | ||
| Rest of Africa | ||


Key Questions Answered in the Report
What CAGR is projected for the industrial internet of things market between 2026 and 2031?
The industrial internet of things market is forecast to grow at a 24.19% CAGR over 2026-2031.
Which component segment is expanding faster than hardware?
Services and connectivity are projected to rise at a 24.87% CAGR, outpacing hardware sales.
Why are hybrid / edge-cloud deployments prevailing over pure cloud or on-premise models?
Hybrid setups balance data sovereignty for proprietary process parameters with cloud elasticity for non-critical analytics, driving a 25.11% CAGR.
How do private 5G networks benefit industrial sites?
Dedicated spectrum delivers sub-10 ms latency and high device density, enabling closed-loop automation and mobile-robot fleets.
Which region is expected to record the fastest growth through 2031?
Asia-Pacific is on track for a 25.99% CAGR, propelled by subsidies in China, India, South Korea, and Japan.
What role do chiplet-based edge-AI accelerators play in IIoT?
Chiplet modularity triples inference efficiency, reduces supply-chain risk, and supports real-time quality inspection at the network edge.
Page last updated on:


