Market Overview
| Study Period | 2021 - 2031 |
|---|---|
| Forecast Data Period | 2026 - 2031 |
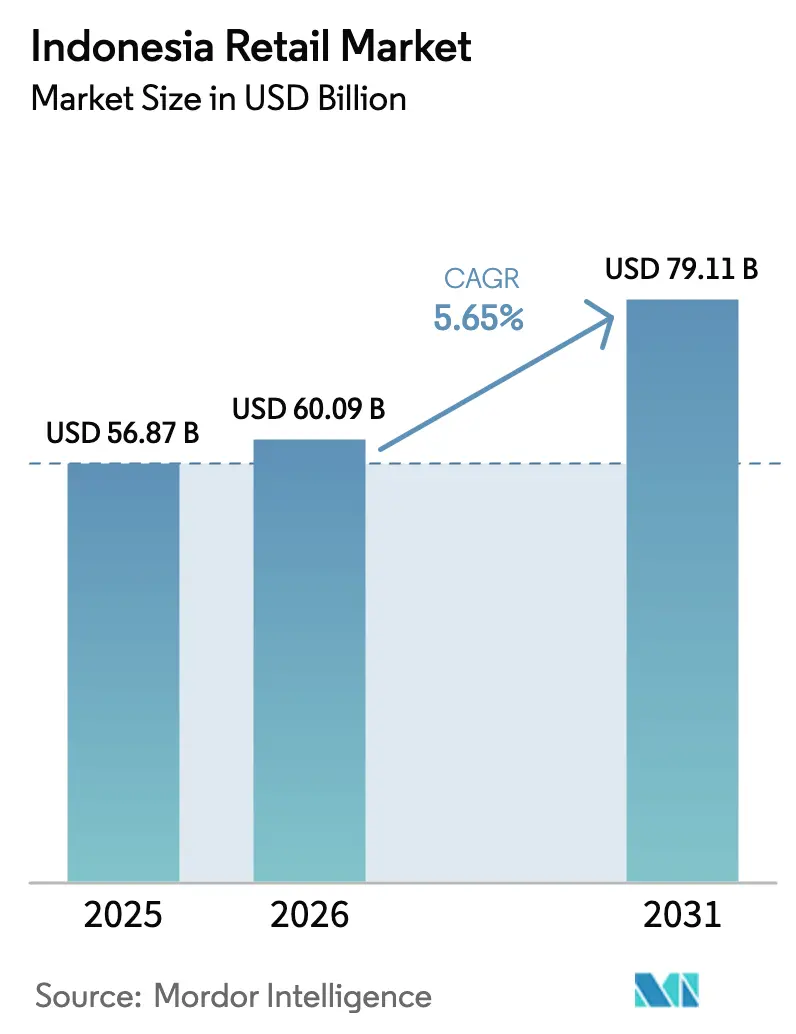
| Base Year Market Size (2025) | USD 56.87 Billion |
| Market Size (2026) | USD 60.09 Billion |
| Market Size (2031) | USD 79.11 Billion |
| Growth Rate (2026 - 2031) | 5.65% CAGR |
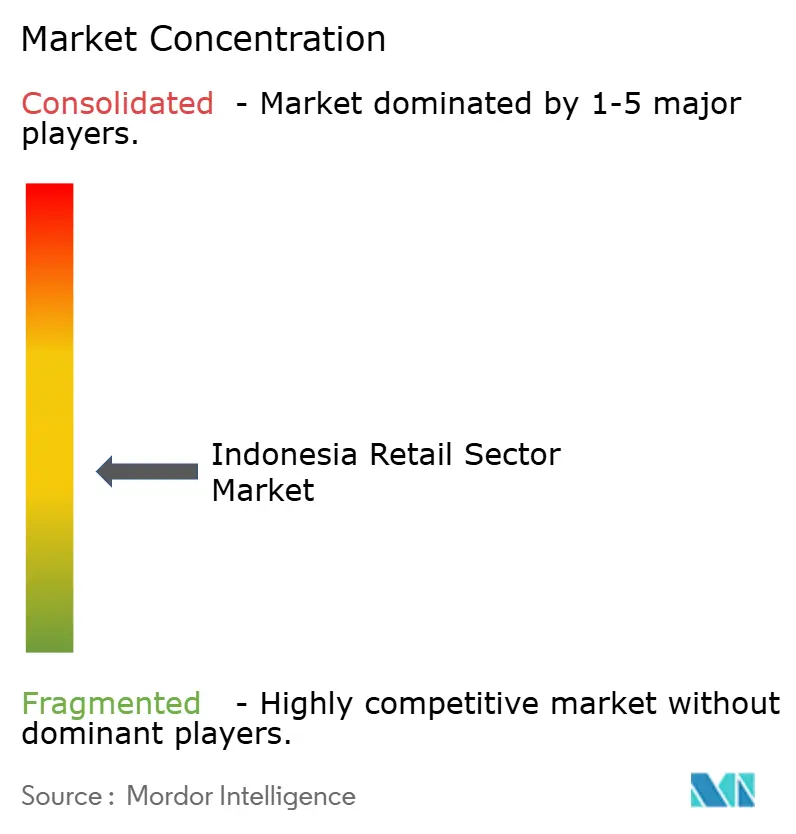
| Market Concentration | Medium |
Major Players *Disclaimer: Major Players sorted in no particular order Image © Mordor Intelligence. Reuse requires attribution under CC BY 4.0. | |
Indonesia Retail Market Analysis by Mordor Intelligence
The Indonesia retail market size is expected to grow from USD 56.87 billion in 2025 to USD 60.09 billion in 2026 and is forecast to reach USD 79.11 billion by 2031 at a 5.65% CAGR over 2026-2031. The growth profile is shaped by a large consumer base, faster adoption of digital payments, and rapid expansion of minimarkets, while logistics frictions, regulatory complexity, and the durability of traditional warungs continue to shape channel dynamics. Food and beverages anchor day-to-day spending, but health, beauty, and personal care are set to outpace other product categories as middle-income consumers in tier-2 cities shift to higher value brands. Modern trade gains from convenience and near-ubiquitous QRIS acceptance, yet traditional formats still hold most of the grocery transactions. The Indonesia retail market is therefore evolving in a two-speed pattern that rewards proximity retail, omnichannel execution, and data-light formats suited to dispersed demand patterns.
Key Report Takeaways
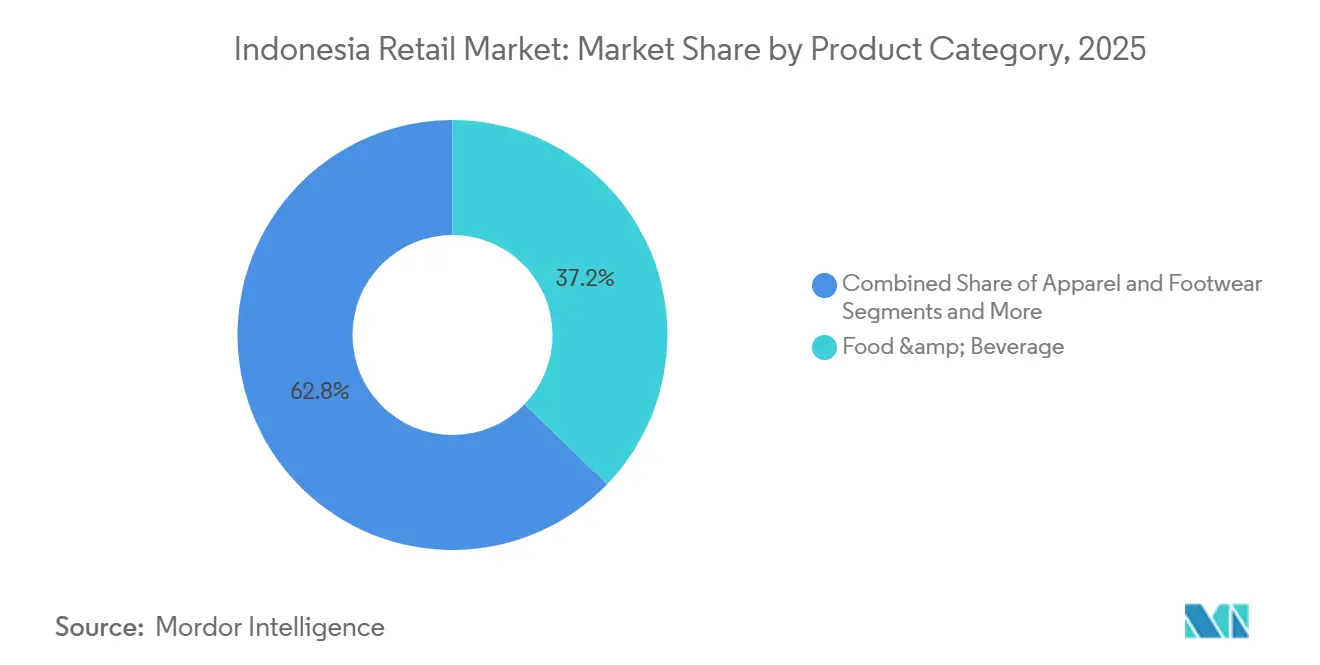
- By product category, food and beverages led with 37.24% of the Indonesia retail market size in 2025, and health, beauty, and personal care are forecast to expand at an 8.48% CAGR through 2031.
- By distribution channel, convenience stores and minimarkets held 42.38% of the Indonesia retail market size in 2025, and hypermarkets and supermarkets are projected to grow at a 7.87% CAGR to 2031.
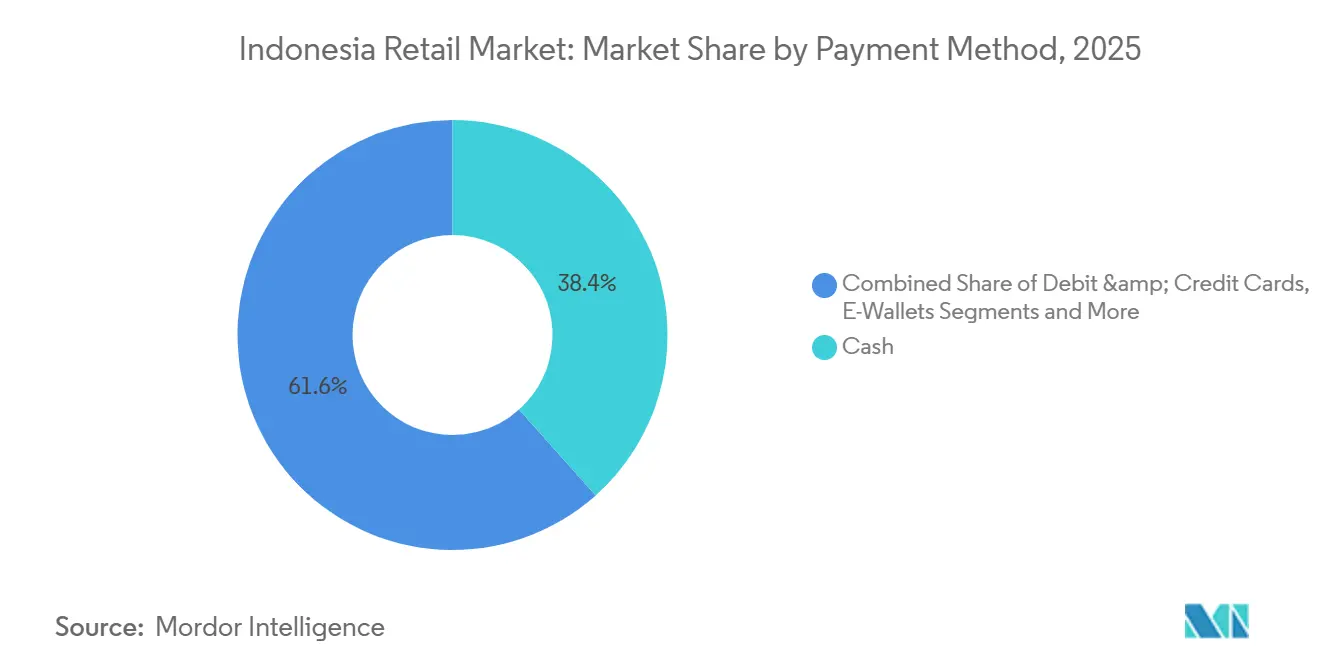
- By payment method, cash accounted for 38.36% of the Indonesia retail market size in 2025, and e-wallets are projected to grow at a 9.74% CAGR over 2026–2031.
- By region, Greater Jakarta held 34.35% of the Indonesia retail market size in 2025, and Sulawesi is forecast to grow at an 8.75% CAGR through 2031.
Note: Market size and forecast figures in this report are generated using Mordor Intelligence’s proprietary estimation framework, updated with the latest available data and insights as of January 2026.
Indonesia Retail Market Trends and Insights
Drivers Impact Analysis*
| Driver | (~) % Impact on CAGR Forecast | Geographic Relevance | Impact Timeline |
|---|---|---|---|
| Rapid Urban-Middle Class Expansion in Tier-2 Cities | +1.8% | Tier-2 and tier-3 cities across Java, Sumatra, and Sulawesi | Long term (≥ 4 years) |
| Government Push for Cashless Society via QRIS and BI-FAST | +1.2% | Nationwide, with early depth in Java urban corridors | Short term (≤ 2 years) |
| Affordable Smartphones Catalyzing Mobile-First E-commerce | +1.7% | Nationwide, with strong effects outside major metros | Medium term (2-4 years) |
| FMCG Shift to Direct-to-Retailer Distribution Models | +0.7% | Java distribution corridors and emerging regional hubs | Medium term (2-4 years) |
| Relaxation of Foreign Investment Caps in Sub-sectors | +0.9% | Nationwide, with a focus on prime malls and large formats | Long term (≥ 4 years) |
| Tourism Rebound Supporting Bali and Leisure Hubs | +0.6% | Bali, Yogyakarta, Lombok, Labuan Bajo | Short term (≤ 2 years) |
| Source: Mordor Intelligence | |||


Rapid Urban-Middle Class Expansion in Tier-2 Indonesian Cities
Indonesia’s tier-2 cities are experiencing faster consumption growth than the capital, driven by a rising number of middle-income households and improved infrastructure that reduces service costs and expands brand reach. In 2024, Jakarta’s gross regional domestic product per capita reached roughly IDR 344 million (USD 20,600), far exceeding most other provinces and highlighting the concentration of spending power in core metropolitan markets. Nevertheless, companies report stronger comparable growth outside Jakarta, supported by new mall developments and retail densification in provincial hubs [1]“Press Release, 1 September 2025,” BPS-Statistics Indonesia, bps.go.id. For example, UNIQLO operated 77 stores across Indonesia by August 2025 and noted higher growth outside the capital in FY2024, consistent with continued momentum across Southeast Asia, India, and the Australia region[2]“FAST RETAILING Results for FY2025 and Estimates for FY2026,” Fast Retailing Co., Ltd., fastretailing.com. This consumption trend is further reinforced by the share of middle and near-middle-class households in national spending, alongside rising consumer confidence through mid-2025 before a late-summer dip. As second-tier cities expand modern retail infrastructure, the Indonesian market is witnessing sustained upgrades in categories such as health and beauty, quick-service dining, and select apparel segments.
Government Push for Cashless Society Accelerating Modern Retail Adoption
The widespread adoption of the Quick Response Code Indonesian Standard (QRIS) across tens of millions of merchants has significantly increased digital retail transactions. Usage of QRIS surged alongside BI-FAST, Bank Indonesia’s 24/7 real-time payment system connecting over 100 financial institutions, facilitating instant transfers and merchant collections. Policy rate cuts in 2025, together with the Payment System Blueprint, further supported transaction growth while keeping inflation near target. Additionally, the central bank expanded QRIS cross-border interoperability within ASEAN, with ongoing sandbox testing and phased rollouts to additional corridors. Retailers that implemented QRIS and BI-FAST experienced higher transaction volumes and smoother checkouts, enhancing conversion rates for convenience stores and supermarket formats in dense urban areas.
Rising Penetration of Affordable Smartphones Driving Mobile-First E-commerce
Widespread mobile connectivity and the availability of budget 4G smartphones have fueled app-based shopping, strengthening the growth of mobile-first marketplaces. Domestic initiatives supporting the assembly of low-cost devices have expanded digital access for rural consumers and brought more MSMEs online. Marketplace platforms introduced features such as endless aisles and store-to-home fulfillment, combining online product discovery with same-day delivery from nearby inventories. Category growth has been strongest in consumer packaged goods, beauty, and fast fashion, while high-value electronics showed mixed performance in early 2025. Overall, the Indonesian retail market is increasingly driven by mobile conversion and micro-promotions that boost purchase frequency at low average ticket sizes.
Domestic FMCG Manufacturers’ Shift to Direct-to-Retailer Distribution
Leading FMCG companies deepened direct-to-retailer contracts to trim landed costs and compress lead times into minimarket networks. Indofood delivered strong branded sales in 2024 and maintained a nationwide manufacturing and logistics base that supports both traditional and modern channel partners. The company’s disclosures point to broad coverage in grocery, including direct arrangements with large modern trade operators. As retailers run more automated replenishment with closer supplier links, shelf availability improves on high-velocity SKUs. This shift reduces reliance on multi-tier wholesalers and aligns inventory to demand signals in urban corridors where the Indonesia retail market is most active.
Restraints Impact Analysis*
| Restraint | (~) % Impact on CAGR Forecast | Geographic Relevance | Impact Timeline |
|---|---|---|---|
| Persistently High Logistics Costs Across the Archipelago | -1.3% | Eastern Indonesia, inter-island lanes, remote provinces | Long term (≥ 4 years) |
| Price-Sensitive Consumer Base Limiting Premiumization | -0.8% | Nationwide, with emphasis outside Jakarta and Bali | Medium term (2-4 years) |
| Fragmented Traditional "Warung" Network Hindering Modern Trade Growth | -1.1% | National, particularly in rural and semi-urban areas | Long term (≥ 4 years) |
| Complex Provincial Licensing and Zoning Regulations | -0.7% | National, with varying impact by province | Medium term (2-4 years) |
| Source: Mordor Intelligence | |||
Persistently High Logistics Costs Across the Archipelago
Inter-island shipping costs and long lead times weigh on margins and store rollout outside Java, which narrows the addressable footprint for large-format retail. Sea-toll routes helped bulk-haul costs on selected lanes, but last-mile frictions persist due to uneven warehouse density and cold-chain gaps in Eastern Indonesia. The policy response improved import administration and clarified sanctions, yet structural infrastructure gaps remain, especially for temperature-controlled logistics. Retailers concentrate distribution centers near provincial hubs, add automation, and use store clusters to meet service time targets while protecting unit economics. The Indonesia retail market outside Java therefore favors capital-light franchising and digital fulfillment models until operating costs improve more broadly.
Price-Sensitive Consumer Base Limiting Premiumization
Volatile food prices and conservative household budgeting curtail discretionary upgrades outside a few urban corridors, which limits premium formats. Confidence weakened in late summer 2025 after a midyear pickup, reflecting cautious views on purchasing power and inflation. Premium supermarkets and specialty operators run smaller networks than value-focused minimarkets and must rely on targeted assortments and cost discipline. Department store recovery improved profitability through store rationalization and mix shifts rather than broad premium trading up. The Indonesia retail market thus needs value architecture across price tiers, with premium lines concentrated in Jakarta-Bali corridors and selective nodes in major province capitals.
*Our forecasts treat driver/restraint impacts as directional, not additive. The impact forecasts reflect baseline growth, mix effects, and variable interactions.
Segment Analysis
By Product Category: Health, Beauty, Personal Care Surge on Halal Certification
Food and beverages held 37.24% of 2025 category sales, supported by inelastic staples that anchor household budgets even when confidence dips, which keeps base volumes stable for grocery channels. Health, beauty, and personal care is forecast to grow at an 8.48% CAGR during 2026–2031, signaling the premium-growth pocket within an otherwise value-driven landscape for the Indonesia retail market. Halal compliance is rising in importance ahead of the 2026 certification expansion, and leading chains introduced formats and merchandising to capture the trade-up. Category momentum is tied to influencer-led discovery and social video that surfaces new brands at attractive price points. The Indonesia retail market continues to direct floor space and content investments toward high-turnover beauty, wellness, and personal care, where shopper engagement is trending higher.
The noodles and pantry staple base stays vital for basket frequency, while beauty adds ticket lift for stores and marketplaces that curate fast-moving SKUs. Indofood posted sizeable branded sales in 2024, supported by its extensive manufacturing and distribution footprint across the country, which underpins shelf availability in both modern outlets and warungs. Corporate disclosures point to direct supply relationships with major convenience chains, aligning replenishment with store-level demand and reducing latency from factory to shelf. As retailers test hybrid digital-physical floor concepts, beauty and wellness brands gain visibility through interactive screens and personalized recommendations that boost conversion. This combination of staples stability and beauty-led trade-up keeps the Indonesia retail market on a balanced path, where value formats capture volume and curated lines deliver margin.


By Distribution Channel: Convenience Stores Outrun Hypermarkets on Proximity
Convenience stores and minimarkets held 42.38% of the channel mix in 2025, reaffirming proximity retail as the primary frequency format in both metro and provincial cities across the Indonesia retail market. Large formats continue to adjust footprints, with several international banners exiting or shifting to remodel strategies as mall-centric shopping evolves. Supermarket count trends remain positive, and fresh-focused operators near residential clusters are improving weekly trip capture with curated produce and same-day delivery pilots. Operators in the mid-market segment use entertainment, dining, and service zones to drive dwell time and differentiate locations. The Indonesia retail market favors footfall-productive formats that minimize travel time and offer reliable stock depth for top-up baskets and quick-replenishment needs.
Minimarkets sustain growth through tight site selection, standardized layouts, and stronger direct-supply arrangements that improve in-stock rates for high-velocity items. Department stores and lifestyle anchors continue to streamline assortments and rationalize unproductive space, as evidenced by the improved profitability at leading operators in 2024 and 2025. Specialty concepts like health and beauty move into tier-2 cities to leverage rising middle-income demand with controlled store footprints. The blended approach of click-to-collect, store-to-home delivery, and QRIS-enabled points of sale supports frictionless checkout and loyalty capture. These execution levers keep proximity and curated mid-size formats central to how the Indonesia retail market balances convenience with choice in dense and semi-urban neighborhoods.
By Payment Method: E-Wallets Displace Cash via QRIS Interoperability
Cash held 38.36% of 2025 transactions, but digital instruments accelerated as QRIS unified acceptance at tens of millions of merchant points, improving reach into MSMEs. E-wallets are projected to grow at a 9.74% CAGR in 2026–2031 with penetration driven by QR interoperability, instant transfers, and loyalty rewards that improve conversion for the Indonesia retail market. Bank Indonesia continues to drive digital payment adoption through QRIS expansion and the BI‑FAST system, which supports faster, more convenient retail transactions. In September 2025, the central bank lowered the BI‑Rate by 25 basis points to 4.75%, aiming to stimulate economic growth while maintaining price stability. These measures have encouraged broader merchant and consumer adoption of digital payments, particularly in urban retail channels, contributing to higher transaction volumes and smoother checkout experiences[3]“BI-Rate lowered by 25 bps to 4.75% Strengthening Economic Growth, Maintaining Stability,” Bank Indonesia, bi.go.id. . The Indonesia retail market increasingly benefits from the reduction in tender friction, which raises throughput in peak hours and supports quick-serve dining, convenience, and pharmacy channels.
Bank transfers, virtual accounts, and card instruments remain relevant for higher-value purchases and subscription-type services, while BNPL balances continue to expand under supervisory oversight. OJK highlighted stable conditions in the financial sector in 2025 with attention to consumer protection and risk frameworks that underpin fintech participation[4]“Financial Services Sector Stability Maintained Amid Global and Domestic Dynamics,” OJK, ojk.go.id. . Policy enhancements around registration, data localization, and aggregator licensing help formalize the market and give large retailers clarity when integrating embedded finance. This regulatory footing lowers operational risk for integrated checkout flows that include pay-later and split-payment options. As these rails deepen, the Indonesia retail market sees higher digital basket conversion and more capture of small-ticket frequency transactions in stores and in apps.
Geography Analysis
Greater Jakarta holds a large share of national sales and concentrates a high proportion of modern trade, with the region’s strong income levels and mall density reinforcing this outcome. The region’s consumer base remains a bellwether for sentiment, and shifts in confidence readings through 2025 showed how food inflation can influence purchase timing across categories. Policy support from the central bank helped stabilize conditions and encouraged growth in retail digital transactions during the second half of 2025. Omnichannel adoption is pronounced in the capital region, where retailers combine physical showrooms, app-based ordering, and QRIS-enabled checkout to serve high-frequency demand. This mix ensures that the Indonesia retail market continues to rely on Greater Jakarta for scale while calibrating capital to favor productive remodels and localized pricing.
The rest of Java, including Surabaya and Semarang, provides depth for mid-size operators as franchise-led minimarkets and supermarkets move closer to residential communities. Retailers open smaller footprints with curated fresh selections and everyday value to serve weekly and top-up trips. Payment interoperability through QRIS and growing acceptance of instant transfers via BI-FAST simplify checkout and returns across a wider range of store formats. Outside Java, Sumatra and Kalimantan register steady expansion in primary hubs where transportation and warehousing infrastructure are improving. The Indonesia retail market benefits from steady growth in these areas as operators deploy phased store openings paired with distribution investments to reduce lead times.
Sulawesi is emerging as a growth frontier as resource-led incomes and infrastructure spending increase purchasing power in its key provinces. Bali and nearby islands add outperformance driven by tourism and by steady integration of cashless payments for visitors, which expands the effective spending radius beyond core hotel zones. Regulatory steps that streamline imports and clarify sanctions reduce uncertainty for retailers that source specialized products and components through ports outside Java. Traditional channels remain vital in remote districts, but digital payments and app-based ordering raise assortment access where physical store networks are thin. Across these geographies, the Indonesia retail market maintains a two-track approach: invest for scale in Java and commit to targeted growth in the high-potential regional nodes that show sustained volume and margin characteristics.
Competitive Landscape
The competitive landscape in Indonesia’s retail market remains diverse, with modern minimarkets concentrated among a few leading chains while traditional and specialty retail channels stay highly fragmented. In convenience retail, the top two players dominate procurement, logistics, and network coverage, creating high barriers for mid-sized entrants. Large marketplaces lead E-commerce with strong brand awareness and high conversion rates, while omnichannel specialists continue expanding physical stores in electronics and fashion to reinforce loyalty. Traditional trade still accounts for the majority of grocery volume, making partnerships with FMCG manufacturers essential for modern retailers to maintain both direct chain distribution and coverage for small neighborhood outlets. This structure allows the market to support large-scale efficiencies in modern trade while sustaining micro-enterprise activity in local communities.
Company strategies in this environment focus on three main pillars. First, omnichannel capabilities, with lifestyle and electronics retailers integrating online catalogs, nationwide inventory, and rapid delivery from local stores or hubs. Second, data-driven merchandising and loyalty programs, which optimize assortment planning and promotion timing within narrow price bands that align with household budgets. Third, compliance capabilities, including Halal certification, QRIS adoption, and adherence to evolving payment and aggregator regulations, ensure operations meet both consumer expectations and regulatory requirements. Together, these approaches enable retailers to align execution with real household demand while maintaining financial and operational oversight.
Recent strategic initiatives illustrate these themes in practice. Lotte Shopping plans to strengthen its Indonesia operations and establish a regional headquarters in Singapore in 2026 to coordinate merchandising and partnerships across the region. IKEA Indonesia has expanded its digital presence through marketplace participation and partnered with the Ministry of Trade to integrate MSMEs into its stores and global supply chain. Leading lifestyle groups reported strong growth in the first half of 2025 and implemented technologies like Endless Aisle and BluTab to expand product access and accelerate deliveries from nearby locations. Supportive actions from banks and regulators, including interest rate cuts and real-time payment systems, have boosted the adoption of digital payments in physical retail. Overall, the market is being reshaped by firms that combine supply chain strength, omnichannel engagement, and compliance at scale.
Indonesia Retail Industry Leaders
Indomaret (PT Indomarco Prismatama)
Alfamart (PT Sumber Alfaria Trijaya Tbk)
Hypermart & Foodmart (PT Matahari Putra Prima Tbk)
Transmart Carrefour (PT Trans Retail Indonesia)
Hero Supermarket & Guardian (PT Hero Supermarket Tbk)
- *Disclaimer: Major Players sorted in no particular order

Recent Industry Developments
- September 2025: Bank Indonesia lowered the BI-Rate by 25 basis points to 4.75% on September 17, 2025, bringing the policy rate to its lowest level since October 2022 in a bid to stimulate economic growth while maintaining inflation within the 2.5±1% target corridor for 2025 and 2026.
- September 2025: Lotte Shopping announced strategic plans to strengthen overseas operations in high-growth markets, including Indonesia, with a focus on expanding the Lotte Mart Express shop-in-shop model and establishing an International Headquarters (iHQ) in Singapore in 2026 to act as a control tower for HR, finance, strategy, marketing, and partnerships.
- June 2025: Indonesian Ministry of Trade and IKEA Indonesia signed a Memorandum of Understanding to expand the market reach of Micro, Small, and Medium Enterprises by providing opportunities to showcase flagship products at IKEA Indonesia stores and integrate as local partners in IKEA’s global supply chains.
- February 2025: OJK issued Regulation No. 4/2025 on Financial Services Aggregation Operators, integrating entities into a unified PAJK category, defining capital requirements, and mandating data-center location in Indonesia, with a 12-month transition period for licensing. The move clarifies the perimeter for fintech aggregators and supports responsible innovation that aligns with consumer protection.


Research Methodology Framework and Report Scope
Market Definition and Key Coverage
Our study defines the Indonesian retail market as the revenue generated within the country from the sale of finished consumer goods to end users through organized brick-and-mortar formats (hypermarkets, supermarkets, department stores, convenience and specialty stores) and regulated digital commerce platforms. Transactions routed through informal warung kiosks, wholesale depots, fuel stations, and foodservice outlets fall outside this frame.
Scope exclusion: Automotive dealerships, fuel retail, and pure food-service chains were excluded because their economics and regulatory codes differ from core consumer retail.
Segmentation Overview
- By Product Category
- Food and Beverage
- Apparel and Footwear
- Consumer Electronics and Appliances
- Home and Furniture
- Health, Beauty and Personal Care
- Others
- By Distribution Channel
- Hypermarkets and Supermarkets
- Department Stores
- Convenience Stores and Mini-markets
- Specialty Stores
- Traditional (Warung / Kiosks)
- Online
- By Payment Method
- Cash
- Debit & Credit Cards
- E-Wallets
- Bank Transfers / Pay-Later
- By Region
- Greater Jakarta
- Rest of Java
- Sumatra
- Kalimantan
- Sulawesi
- Bali & Nusa Tenggara
- Papua & Maluku
Detailed Research Methodology and Data Validation
Primary Research
Analysts then interviewed store managers in Greater Jakarta, franchise owners in Central Java, FMCG key-account leads, and e-wallet executives across Bali and Sulawesi. The discussions refined typical basket size, discount cadence, regional freight mark-ups, and promotional intensity, which grounded the assumptions lifted from desk work.
Desk Research
We began by mapping demand using Statistics Indonesia household-consumption tables, Bank Indonesia monthly retail sales indices, and Ministry of Trade commodity-flow dashboards, which framed baseline turnover. Trade papers from Aprindo, customs tariff sheets, and QRIS policy circulars clarified channel costs and payment shifts. Company filings, investor decks, and reputable press articles carried through Dow Jones Factiva offered store counts, ticket sizes, and expansion plans. D&B Hoovers supplemented chain-level financials, letting analysts benchmark organized operators. The sources listed illustrate, rather than exhaust, the secondary pool tapped for data collection and validation.
Market-Sizing & Forecasting
We anchored 2024 value through a top-down synthesis of household consumption, retail share of GDP, and official turnover, which were filtered through organized-channel penetration rates gathered from interviews. Select bottom-up checks, such as sampled average selling price times store-level traffic and GMV splits, aligned totals. Key variables in the model include disposable income per capita, store-footprint additions, online checkout conversion, logistics cost inflation, payment mix, and VAT trajectory. Multivariate regression, guided by primary-expert consensus, projects how shifts in income, urban population, and smartphone penetration steer growth, while scenario tests adjust for VAT hikes or fuel shocks when bottom-up detail is thin.
Data Validation & Update Cycle
Outputs pass two rounds of variance testing against Aprindo indices and Bank Indonesia surveys before sign-off. Reports refresh each year, with interim revisions whenever material policy or economic events arise, ensuring clients receive the latest calibrated view.
Why Mordor's Retail In Indonesia Baseline Numbers Inspire Solid Confidence
Published estimates often diverge because providers carve different scopes, apply varied currency bases, and refresh on dissimilar calendars. Gaps widen when informal kiosks, wholesale leakage, or duty-free receipts are blended into retail tallies that Mordor deliberately omits.
Key gap drivers include competitors counting unregistered trade, using straight GDP multipliers, or rolling three-year updates without fresh primary validation, whereas our analysts revisit variables annually and corroborate findings through dual-path checks.
Benchmark comparison
| Market Size | Anonymized source | Primary gap driver |
|---|---|---|
| USD 56.88 B (2025) | Mordor Intelligence | |
| USD 361.10 B (2024) | Global Consultancy A | Includes informal trade and wholesale flows, single top-down build, five-year refresh cadence |
| USD 175.11 B (2024) | Regional Consultancy B | Bundles automotive fuel and foodservice, applies GDP multipliers, limited primary validation |
The comparison shows that by selecting a focused scope, blending top-down logic with on-ground checks, and refreshing annually, Mordor Intelligence offers a balanced, transparent baseline that decision-makers can replicate with confidence.


Key Questions Answered in the Report
What is the current size and growth outlook of the Indonesia retail market?
The Indonesia retail market size is USD 60.09 billion in 2026 and is projected to reach USD 79.11 billion by 2031 at a 5.65% CAGR, supported by modern trade expansion and digital payment adoption.
Which product categories are set to grow fastest in Indonesia through 2031?
Health, beauty, and personal care are forecast to grow at an 8.48% CAGR, outpacing staples, while food and beverages remain the largest base for transaction frequency and store traffic.
How are payments changing in Indonesian retail formats?
Cash still carries a significant share, but e-wallets are projected to grow at a 9.74% CAGR, and QRIS plus BI-FAST are lifting digital transaction volumes across convenience, supermarket, and specialty formats.
Which regions offer the most attractive growth beyond Jakarta?
Sulawesi is forecast as the fastest-growing region at an 8.75% CAGR, while the Rest of Java contributes scale, and Bali benefits from tourism-linked discretionary demand and cashless readiness.
What channels are winning in the Indonesia retail market?
Convenience stores and minimarkets lead with a 42.38% share in 2025, supermarkets are expanding in residential clusters, and omnichannel approaches are strengthening with store-to-home delivery and QRIS-enabled checkout.
How are leading retailers building competitive advantage in Indonesia?
Leaders combine national logistics with data-driven merchandising and regulatory compliance, including QRIS integration, Halal certification where relevant, and omnichannel capabilities that improve conversion and service speed.
Page last updated on:


