
Market Overview
| Study Period | 2021 - 2031 |
|---|---|
| Forecast Data Period | 2026 - 2031 |
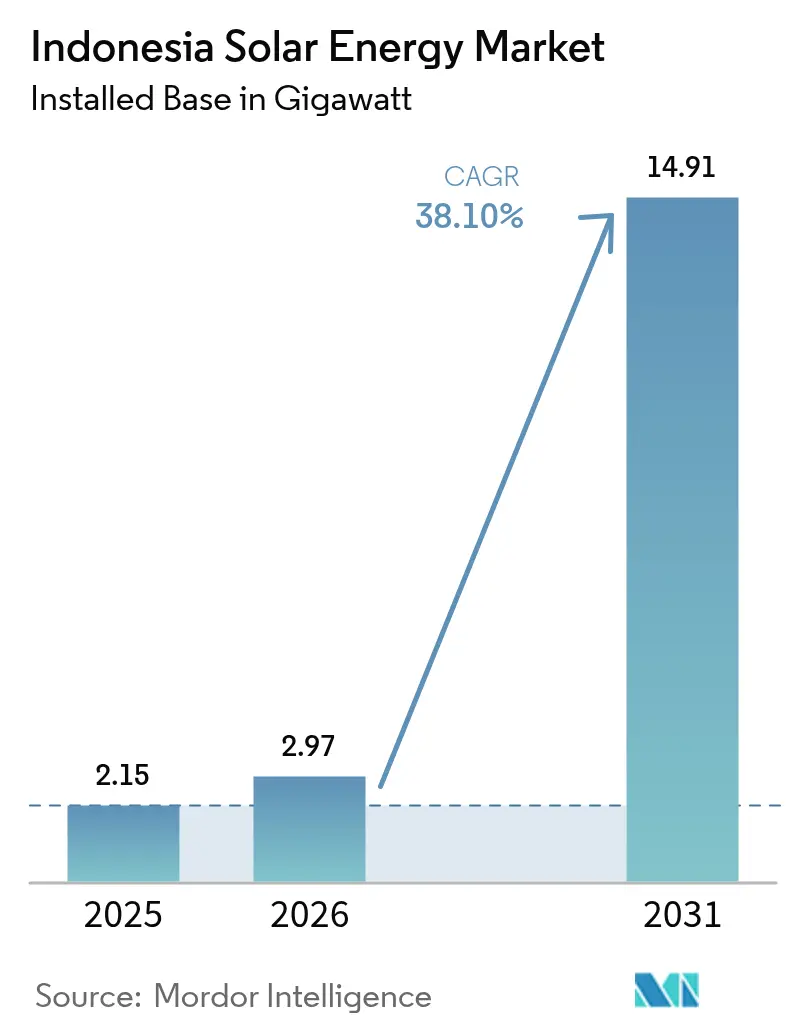
| Base Year Market Size (2025) | 2.15 gigawatt |
| Market Volume (2026) | 2.97 gigawatt |
| Market Volume (2031) | 14.91 gigawatt |
| Growth Rate (2026 - 2031) | 38.10 % |
| Market Concentration | Medium |
Major Players *Disclaimer: Major Players sorted in no particular order Image © Mordor Intelligence. Reuse requires attribution under CC BY 4.0. | |
Indonesia Solar Energy Market Analysis by Mordor Intelligence
The Indonesia Solar Energy Market size is expected to grow from 2.15 gigawatt in 2025 to 2.97 gigawatt in 2026 and is forecast to reach 14.91 gigawatt by 2031 at 38.10% CAGR over 2026-2031.
Jakarta’s pivot from diesel subsidies toward grid-scale and distributed photovoltaic systems, the 5.746 GW rooftop quota framework, and PLN’s commitment to 17.1 GW of solar capacity in its RUPTL 2025-2034 blueprint, together underpin this growth trajectory, signaling a decisive reallocation of capital away from coal baseload. Module average selling prices fell nearly 50% during 2024, shipping costs normalized, and Indonesian EPC bidders routinely met PLN’s ceiling tariff of IDR 1,200 per kWh, which pushed the Indonesian solar energy market below grid-parity levels in high-irradiance provinces. Corporate renewable-power purchase agreements (RE-PPAs) surged as RE100 manufacturers in Java and Batam locked in twenty-year rooftop contracts that guarantee Scope 2 abatement and long-term price certainty.(1)RE100 Secretariat, “Annual Progress Report 2024,” re100.org Utility-scale developers attracted by the archipelago’s 207 GW technical potential, the USD 20 billion JETP commitment, and regulatory clarity under Presidential Regulation 112/2022 are queueing projects in Java, Sumatra, and Sulawesi despite grid-absorption quotas and foreign-exchange risks.
Key Report Takeaways
- By technology, solar PV held 100.00% of the Indonesian solar energy market share in 2025.
- By grid type, on-grid systems accounted for a 89.85% share of the Indonesian solar energy market size in 2025, while off-grid capacity is forecast to expand at a 41.20% CAGR through 2031.
- By end-user, utility-scale plants commanded 65.20% of the Indonesian solar energy market share in 2025 and are projected to grow at a 40.00% CAGR through 2031.
Note: Market size and forecast figures in this report are generated using Mordor Intelligence’s proprietary estimation framework, updated with the latest available data and insights as of 2026.
Indonesia Solar Energy Market Trends and Insights
Drivers Impact Analysis*
| Driver | (~) % Impact on CAGR Forecast | Geographic Relevance | Impact Timeline |
|---|---|---|---|
| Government rooftop net-metering incentives strengthened (2023) | +6.20% | National, with early gains in Jakarta, Surabaya, Bandung | Short term (≤ 2 years) |
| Declining global module ASPs and shipping costs | +8.50% | National, benefiting Java-Bali industrial corridors | Medium term (2-4 years) |
| Corporate RE-PPA demand from RE100 manufacturers | +5.80% | Java, Batam, Karawang manufacturing zones | Medium term (2-4 years) |
| Diesel-hybrid swaps on remote islands cut PLN subsidy burden | +4.30% | Eastern archipelago: NTT, Maluku, Papua | Long term (≥ 4 years) |
| Jakarta & provincial mandatory-rooftop by-laws | +3.70% | Jakarta, West Java, Bali, East Java | Short term (≤ 2 years) |
| Sulawesi nickel-smelter self-generation requirement | +4.10% | Sulawesi (Morowali, Konawe industrial parks) | Medium term (2-4 years) |
| Source: Mordor Intelligence | |||
Government Rooftop Incentives Accelerate Distributed Adoption
MEMR Regulation 2/2024 ended net-metering and replaced it with a 5.746 GW quota, clarifying interconnection rules and protecting PLN revenues while sustaining tax allowances for commercial systems. Jakarta’s Governor Regulation 38/2024 now obliges the installation of rooftop solar on new commercial buildings exceeding 500 m², a mandate mirrored in West Java and Bali. Together with the quota, this delivers a transparent pipeline that boosts developer visibility until 2028. The mechanism caps excess-generation credits, steering households toward self-consumption yet unlocking larger corporate installations that can absorb daytime output. Developers have accelerated engineering timelines to secure quota allocations early, anticipating tighter windows once the residential segment restarts in 2027. At the same time, municipal fines and permitting incentives ensure higher compliance, thereby expanding the Indonesian solar energy market in densely populated urban districts.
Module ASP Declines Compress Levelized Costs Below Grid Parity
Polysilicon spot prices declined from USD 30/kg in 2023 to USD 8/kg by Q4 2024, halving crystalline-silicon module ASPs and enabling EPC bids as low as IDR 1,050 per kWh in recent PLN tenders. Normalized freight rates shaved another 15-20% off landed costs for Chinese Tier-1 modules, pushing levelized electricity costs beneath coal benchmarks in East Nusa Tenggara and South Kalimantan. Developers responded by lodging unsolicited PPA proposals that already exceed PLN’s 17.1 GW solar allocation for 2025-2034. Yet margin pressure remains as manufacturers offload high-priced inventory, compelling Indonesian firms to hedge order timing. Forward curves indicate that if Chinese factory utilization stays above 600 GW annually, the Indonesian solar energy market will benefit from sub-USD 0.07 kWh tariffs through 2026.
RE100 Corporate Commitments Drive C&I PPA Volume
Multinationals in Karawang, Batam, and Cikarang posted aggressive clean-power targets in 2024, and SUN Energy reported a 40% jump in contracted capacity as electronics and automotive exporters sought long-term RE-PPAs. C&I customers prioritize certainty over arbitrage, enabling 15-20-year tenors with U.S.-dollar debt serviced by rupiah tariffs plus inflation escalators. Provincial governments streamline rooftop permitting within 14 days for projects tied to export-oriented factories, trimming soft costs. However, the 20% TKDN rule elongates equipment lead times because domestic assembly capacity remains below 1 GW, necessitating partial imports to meet project deadlines. Even with these frictions, C&I PPAs are on track to exceed 1 GW annually by 2027, making them a stabilizing anchor for the Indonesian solar energy market.
Diesel Displacement in Eastern Archipelago Eases Fiscal Strain
PLN spent IDR 45 trillion (approximately USD 2.9 billion) subsidizing diesel in 2024 and now targets a 50-70% fuel cut via hybrid mini-grids across 200 islands. ADB’s USD 500 million concessional package and political-risk insurance lowered the cost of capital, triggering bids from Vena Energy and Akuo Energy for the initial 150 MW tender. Battery storage paired with bifacial modules delivers dispatchable power at USD 0.18-0.22 kWh, well below diesel’s USD 0.35 kWh, and every commissioned site retires a perpetual fuel-logistics liability for PLN. The program is forecast to displace 800 million liters of diesel annually by 2030, freeing budget headroom that can be redirected to grid upgrades on Java-Bali. Nickel-smelter self-generation mandates in Sulawesi add complementary demand, making the eastern islands the fastest-growing geography within the Indonesian solar energy market.
Restraints Impact Analysis*
| Restraint | (~) % Impact on CAGR Forecast | Geographic Relevance | Impact Timeline |
|---|---|---|---|
| 40% TKDN local-content rule inflates costs | -5.40% | National, acute in utility-scale projects | Medium term (2-4 years) |
| Grid-absorption quota & curtailment risk | -4.80% | Java-Bali grid, spillover to Sumatra | Short term (≤ 2 years) |
| Lack of sovereign guarantee for floating-PV PPAs | -2.90% | Reservoir sites in West Java, Riau | Long term (≥ 4 years) |
| High IDR-FX hedging costs for IPPs | -3.60% | National, impacting foreign-financed projects | Medium term (2-4 years) |
| Source: Mordor Intelligence | |||
TKDN Local-Content Mandate Elevates Project Economics
MEMR Decree 191/2024 trimmed the TKDN threshold to 20%, yet developers still face 12-18% higher EPC costs because Indonesia lacks polysilicon and wafer plants, leaving PT Len Industri’s 600 MW line as the chief compliant source. Queue times stretch to nine months, compelling utility-scale sponsors to renegotiate PPA schedules or accept partial-import penalties. PLN remains reluctant to uplift tariffs, forcing margin compression that cascades through the supply chain. Several IPPs now bundle balance-of-system gear from domestic suppliers to surpass the 20% threshold, although audits can delay commercial-operation certificates by up to 90 days. Unless new gigawatt-scale factories reach commercial operation before 2027, the TKDN rule will continue to hinder the Indonesian solar energy market.
Grid-Absorption Constraints Trigger Curtailment Incidents
Java-Bali’s grid experienced up to 30% solar curtailment during off-peak afternoons in mid-2024, exposing insufficient storage and slow-cycling coal baseload.(2) State Electricity Company (PLN), “Diesel Subsidy Budget 2024,” pln.co.id Projects signed before 2024 lack compensation clauses, so revenue loss falls squarely on sponsors, prompting some foreign lenders to widen debt-service-coverage cushions. PLN budgeted IDR 30 trillion (USD 1.9 billion) for 1 GW of batteries and transmission upgrades, yet procurement bottlenecks mean meaningful relief will not surface until 2027. In the interim, PLN capped annual new on-grid solar at 2-2.5 GW to maintain frequency stability, effectively throttling utility-scale expansion on Java. Sumatra and Kalimantan pick up the slack, but developers still view curtailment as the second-largest risk to the Indonesian solar energy market after TKDN cost inflation.
*Our forecasts treat driver/restraint impacts as directional, not additive. The impact forecasts reflect baseline growth, mix effects, and variable interactions.
Segment Analysis
By Technology: PV Monopoly Reflects Climatic and Economic Realities
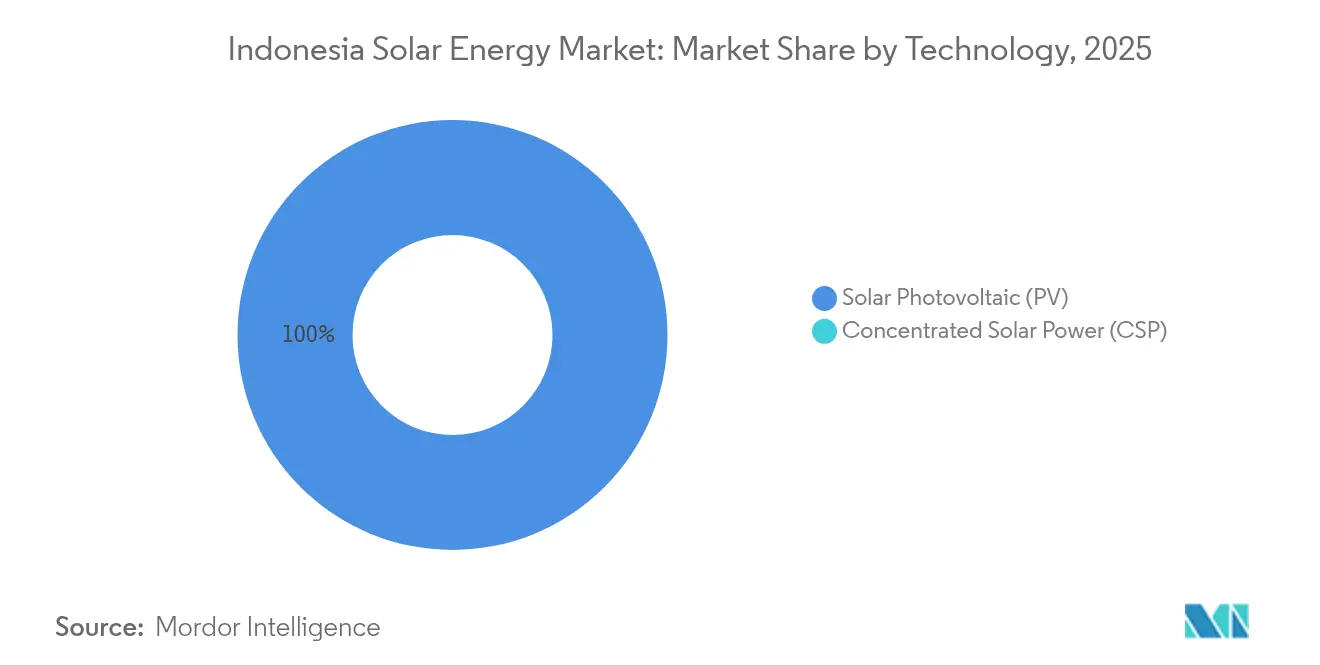
Solar PV accounted for 100.00% of the Indonesian solar energy market size in 2025 and is forecast to advance at a 38.10% CAGR through 2031. CSP remains commercially unviable because most Indonesian sites record 1,400-1,600 kWh/m² DNI, which is well below the 2,000 kWh/m² threshold that CSP needs to remain competitive. PV capex of USD 800-1,200 kW undercuts CSP’s USD 4,000-6,000 kW, so investors concentrate capital on crystalline-silicon routes. Bifacial and TOPCon modules captured 60% of 2024 imports as developers chase 10-15% yield gains in land-constrained Java. Compliance with IEC 61215 and IEC 61730 standards upholds bankability despite price compression, further reinforcing PV’s exclusive status in the Indonesian solar energy market.
Second-generation cell technologies accelerate yield improvements, mitigating curtailment risks by enabling lower nameplate sizing for fixed quotas. LONGi and Trina each delivered over 500 MW of bifacial shipments in 2024, primarily for floating PV and hybrid diesel sites. As module energy density rises, developers forecast a 7% drop in land requirements by 2027, alleviating community-acceptance barriers in peri-urban Java while bolstering project IRRs.



By Grid Type: Off-Grid Surge Driven by Island Economics
On-grid installations held 89.85% of 2025 capacity, but off-grid systems are forecast to post the fastest 41.20% CAGR through 2031, spurred by PLN’s diesel-hybrid strategy. Levelized costs for off-grid hybrid plants now range from USD 0.18 to 0.22 kWh, well below diesel’s USD 0.35 kWh, reflecting declines in storage costs and concessional financing. These economics underpin PLN’s tender covering 200 island sites totaling 150 MW, the first tranche of an estimated 800 MW program due by 2028. On-grid growth remains centered on Java and Sumatra, but annual quotas of 2-2.5 GW cap expansion to safeguard stability. Consequently, the Indonesian solar energy market is experiencing its most significant volume growth in off-grid provinces, even though absolute capacity on Java still dominates.
Battery procurement accounts for 35-40% of off-grid capital expenditure, and suppliers have begun local pack assembly to sidestep import duties, thereby nudging their TKDN scores higher. If targeted donor financing flows as scheduled, off-grid solar will displace 800 million liters of diesel yearly by 2030, removing a significant fiscal burden for PLN and accelerating electrification ratios in remote provinces.
By End-User: Utility-Scale Dominance Persists Amid C&I Momentum
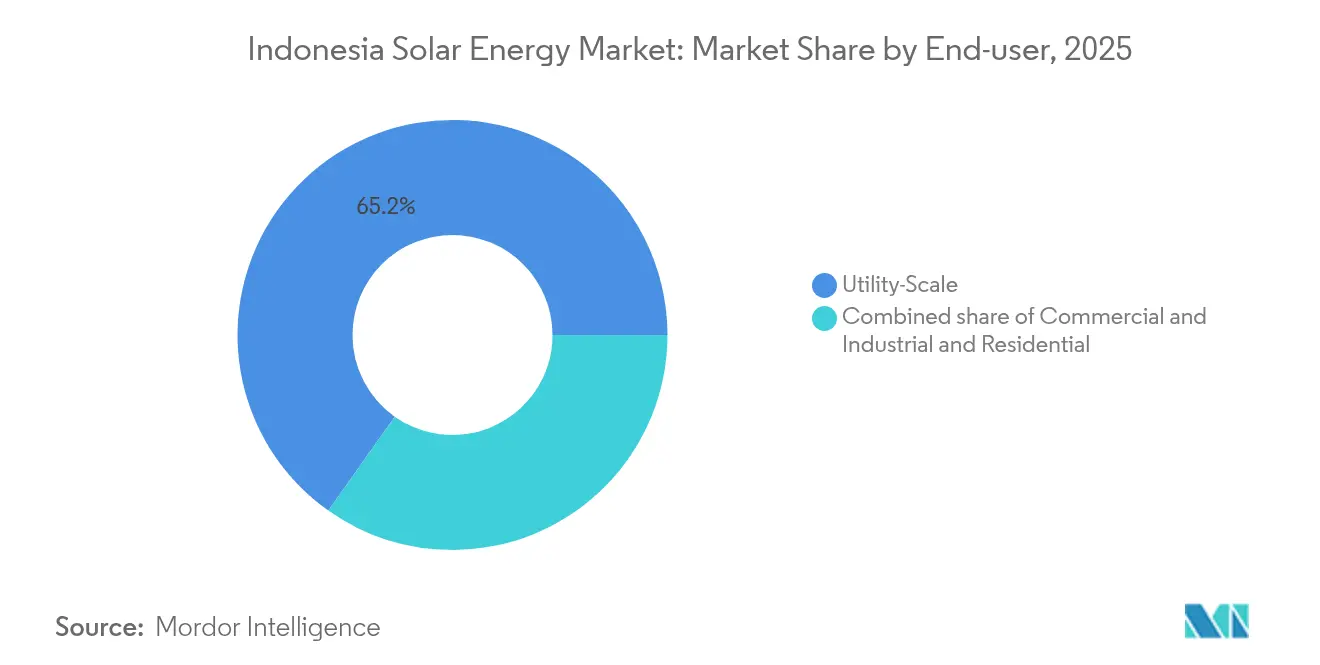
Utility-scale plants controlled 65.20% of the Indonesian solar energy market share in 2025 and are projected to expand at a 40.00% CAGR through 2031. Scale brings EPC costs down to USD 800-900 kW in low-cost land corridors of Sumatra and Kalimantan, while Presidential Regulation 112/2022’s ceiling-price mechanism guarantees PPA visibility. ACWA Power’s 500 MW Central Java project demonstrates foreign capital’s appetite for large-scale contracts, despite Indonesia’s BB+ credit rating. C&I rooftops grow almost as fast because RE100 firms prioritize decarbonization of exported goods; SUN Energy added 200 MW of new PPAs in 2024 alone, equal to a 40% year-on-year jump. Residential uptake lags after the abolition of net-metering removes excess-generation credits, but households may revive once module prices stabilize below USD 0.18/W.
Future uptake hinges on permit streamlining under the Online Single Submission (OSS) system, which reduces licensing time from 60 days to under 20 days for rooftop arrays of less than 5 MW. Coupled with declining storage prices, this favors midsize hybrid plants that merge rooftop generation with 2-4 hour batteries, offering resilience to export-oriented manufacturers facing supply-chain ESG audits.
Geography Analysis
Java hosted roughly 69.30% of 2025 solar capacity, mirroring its industrial load centers and mature transmission grid, while Sumatra accounted for about 17.40% on the back of captive demand from plantation and mining operations. Sulawesi emerged as a rising pole after MEMR mandated nickel-smelter self-generation, and the eastern archipelago provinces, which combined held 4.20%, yet promise 44-49% CAGRs through 2031.
Java’s dominance faces curtailment pressures that drove PLN to cap new on-grid capacity. Rooftop mandates and industrial PPAs still push the island’s cumulative installations upward, but incremental utility-scale additions divert to Sumatra, where spare transmission capacity and lower land prices remain available. Sumatra’s palm-oil and rubber estates secure bilateral mini-grids to curb diesel exposure, fueling a medium-term boom that complements PLN’s grid-connected pipeline.
Sulawesi’s Morowali and Konawe industrial parks host a 4 GW smelter load that must meet a 30% renewable energy target by 2027, translating to a solar demand of 1.2-1.5 GW. PT Vale Indonesia’s 150 MW captive project opens the slate, while Chinese operators negotiate multi-buyer PPAs to pool loads and share TKDN-compliant procurement. Eastern archipelago deployments confront high freight costs and scarce EPC capacity; yet, the ADB and World Bank de-risk projects through political-risk insurance and grant-funded feasibility studies, accelerating the Indonesian solar energy market at the periphery.
Regulatory Landscape
Indonesia’s solar buildout is anchored by Presidential Regulation 112/2022 for power-purchase pricing and procurement, and by MEMR Regulation 2/2024 for rooftop PV connected to the PLN grid. The latter shifted the scheme from net-metering to a quota-based framework totaling 5.746 GW for 2024-2028. Under this mechanism, rooftop quota proposals for 2024-2028 are submitted to the Directorate General of Electricity and evaluated with the Directorate General of New, Renewable Energy and Energy Conservation (EBTKE), tightening interconnection governance while keeping a defined pipeline for developers.
Local-content policy remains a key compliance gate. MEMR Decree 191/2024 lowered TKDN requirements to 20%, while MEMR Regulation 11/2024 introduced TKDN relaxation for certain solar power projects with COD scheduled by 30 June 2026, tied to conditions such as PPAs signed before 31 December 2025 and commitments to develop domestic solar manufacturing facilities. In parallel, PP No. 40/2025 (National Energy Policy) and MEMR Regulation 10/2025 (electricity-sector energy transition roadmap aligned with PP 112/2022) set the longer-term policy context that utilities, IPPs, and C&I PPA structures need to align with as solar scales across the archipelago.
Competitive Landscape
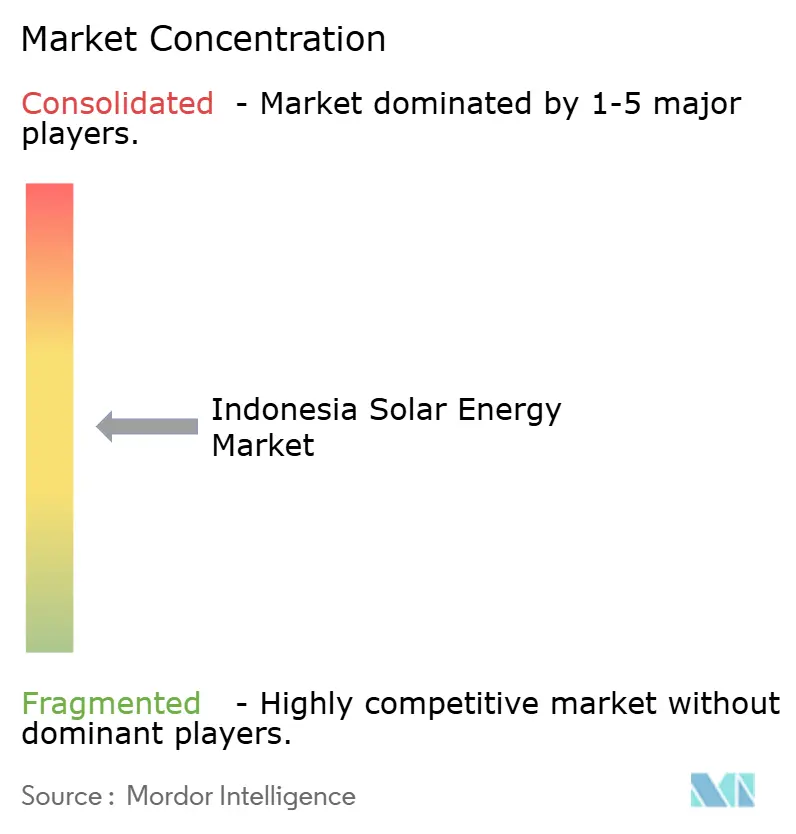
The Indonesian solar energy industry is moderately fragmented, with no single developer commanding more than 15% of the commissioned capacity. Local specialists, such as SUN Energy, PT SESNA, and PT Solardex, dominate C&I rooftops by leveraging provincial networks and expedited permitting. International IPPs, such as ACWA Power, Masdar, TotalEnergies Eren, and Vena Energy, provide utility-scale expertise, combining low-cost capital with EPC capabilities, especially in floating PV prospects where domestic players lack experience. Chinese Tier-1 suppliers (Canadian Solar, Trina Solar, LONGi, JA Solar, Risen Energy) shipped 85% of the 2024 modules, buoyed by 50% ASP declines that outpaced those of legacy Western vendors.
Strategic positioning now hinges on mastering TKDN logistics and securing scarce grid-allocation slots. Partnerships with PT Len Industri guarantee quota priority but entail waiting nine months, prompting some IPPs to stockpile imported modules and retrofit local junction boxes to remain compliant. Floating PV and hybrid storage remain under-penetrated; only 192 MW of a 14.7 GW technical potential is online, and grid-scale batteries still total just 150 MW. These gaps invite new entrants willing to bundle EPC, storage, and compliance solutions into a single bankable package, thereby widening the opportunity space in the Indonesian solar energy market.
Indonesia Solar Energy Industry Leaders
PT Sumber Energi Sukses Makmur
PT Solardex Energy Indonesia
Canadian Solar Inc.
PT. Sumber Energi Surya Nusantara
PT. Surya Utama Nuansa
- *Disclaimer: Major Players sorted in no particular order

Market Opportunities and Future Outlook
Integrated procurement and portfolio packaging are providing a clearer route to scale for utility-scale solar beyond the traditional project-by-project tender cadence. PT PLN (Persero) initiated the Mentari Nusantara I tender under the GIGA ONE procurement scheme at 1.225 GW, bundling projects across Java, Sumatra, Kalimantan, Sulawesi, West Nusa Tenggara, and Maluku-Papua, which widens the addressable scope for IPPs and EPCs that can deliver multi-site execution, grid interconnection, and TKDN compliance through a single program. This approach also creates room for suppliers to standardize designs (modules, inverters, mounting, SCADA) across multiple islands, while managing logistics and local-content documentation.
Two demand pockets offer defined, near-term project pathways: (i) hybridization of diesel systems in remote and islanded grids under the 2025 hybrid power plant policy (MEMR Regulation 19/2025), which formalizes renewable plus battery replacements for diesel generators, and (ii) corporate and industrial rooftops where long-tenor PPAs and phased expansions are being executed. TotalEnergies ENEOS completed a Phase 2 rooftop solar addition for PT Perusahaan Industri Ceres in Bandung, lifting the combined on-site capacity to 3.6 MWp, illustrating how industrial sites can add capacity in repeatable phases. Floating solar also remains under-penetrated relative to technical potential in the report scope, and PLN’s plan to allocate 10,000 hectares of reservoir surface area for floating PV points to an active pipeline that depends on reservoir engineering, environmental permitting, and bankable PPA structuring.
Recent Industry Developments
- July 2026: PT PLN (Persero) communicated plans to utilize around 10,000 hectares of reservoir surface area for floating solar PV development. The signal reinforces floating PV as a priority deployment channel alongside ground-mounted projects, expanding the addressable project pipeline for developers with hydrology, anchoring, and reservoir-permitting capabilities.
- June 2026: TotalEnergies ENEOS completed Phase 2 of a rooftop solar project for PT Perusahaan Industri Ceres in Bandung, adding 1.4 MWp and bringing the combined installation to 3.6 MWp. The expansion highlights how C&I customers are scaling rooftop capacity in phases under longer-tenor arrangements, supporting repeat business for developers that can manage engineering upgrades with minimal operational disruption.
- October 2024: ACWA Power and PLN agreed to co-develop a 500 MW utility-scale solar project in Central Java. The commitment elevated the reference size for single-site projects in the country and strengthened the role of international IPPs in competing for large allocations under PLN planning and procurement.


Research Methodology Framework and Report Scope
Market Definition and Coverage
For this study, the market covers solar power additions and installed base inside Indonesia, counted as grid connected and off-grid solar capacity that is deployed for power generation across end users.
Scope exclusions: We exclude broader renewable power assets (such as hydro, geothermal, and wind) and we also exclude downstream retail electricity services that do not add solar capacity.
Segmentation Overview
- By Technology
- Solar Photovoltaic (PV)
- Concentrated Solar Power (CSP)
- By Grid Type
- On-Grid
- Off-Grid
- By End-User
- Utility-Scale
- Commercial and Industrial (C&I)
- Residential
- By Component (Qualitative Analysis)
- Solar Modules/Panels
- Inverters (String, Central, Micro)
- Mounting and Tracking Systems
- Balance-of-System and Electricals
- Energy Storage and Hybrid Integration
Data Sources, Market Sizing, and Validation
Desk Research
Desk work starts with building a clear picture of Indonesia power demand, supply additions, and solar project activity, and then mapping that to capacity outcomes. Public sources are used to anchor the base, such as MEMR statistics and policy documents, PLN planning documents (RUPTL), IEA and IRENA country indicators, and World Bank energy datasets. We also review project announcements, reputable press, and company filings or investor presentations to track commissioning timing and pipeline movement.
To reduce gaps, we cross-check installed capacity and additions using multiple lenses, including customs and trade indicators where relevant for equipment inflows, and patent databases to spot technology direction without over-reading single filings. A paid subscription for company financials and intelligence is used selectively to confirm developer footprints and project ownership changes, and then assumptions are corrected if they look inconsistent. The sources listed here are illustrative only, and many other public and paid references were also used for data collection, validation, and clarification.
Primary Interviews and Surveys
Primary checks were run with a mix of developers, EPC participants, equipment distributors, and power sector stakeholders, so the model reflects how projects actually move from plans to commissioned capacity. Since this is a country market, inputs were validated across key demand pockets and grid conditions, and then adjusted for typical commissioning delays and curtailment risk where it was repeatedly flagged.
Distribution of primary research fieldwork respondents
| Company type | Respondent position |
|---|---|
| Top tier: 30% | CXOs: 14% |
| Mid tier: 53% | Functional/Unit leaders: 32% |
| Smaller Players: 17% | Managers: 54% |
Market-Sizing & Forecasting
Sizing is built using a top-down and bottom-up approach, where national power planning and renewable build targets are first converted into realistic solar capacity additions for each year. The top-down side relies on signals that can be checked, such as PLN procurement and pipeline visibility, utility interconnection readiness, typical project size mix, and observed lead times from financial close to commissioning.
Those totals are then corroborated with selective bottom-up approximations, mainly by rolling up a sampled set of announced and under-construction projects and stress-testing them with simple volume checks (for example, expected module and inverter demand implied by the capacity to be installed). We also use market fingerprints like solar irradiation suitability by location, rooftop versus ground-mount adoption patterns, and policy triggers that affect offtake bankability, and then those are applied consistently across years.
For the forecast, scenario analysis is used so we can reflect different outcomes for permitting speed, grid absorption, and the pace of utility-scale tenders, and then the final path is chosen based on the most repeated view from industry conversations. Where project data is incomplete, we fill gaps with conservative commissioning probability bands that are tied back to how often similar projects reached COD in recent years.
Data Validation & Update Cycle
Validation is done through step-by-step variance checks, where the modeled additions are compared against independent signals like grid-connected capacity releases, project COD news, and procurement calendars. If a year shows an unusual jump or drop, the drivers are traced back to a small set of assumptions, and follow-up calls are triggered when the mismatch cannot be explained with public information.
Before sign-off, the model and write-up go through multi-stage analyst review so calculation logic, unit consistency, and year mapping are clean. Reports are refreshed annually, and interim updates are made when policy changes, major tenders, or commissioning waves materially shift the near-term outlook. Right before delivery, a final pass is completed so clients receive the most current view available.
Mordor Intelligence's Indonesia Solar Energy Market Size Compared Against Other Published Estimates
Published market sizes for solar in Indonesia often do not match, mainly because the unit of measurement and the scope definition change from one publisher to another. Some estimates talk in revenue terms, while others report installed capacity, and they also vary on whether they count only grid-connected assets or include off-grid deployments.
The main gap comes from mixing revenue-based renewable energy totals into a solar-only capacity view, where Mordor Intelligence counts installed solar capacity in gigawatts and keeps the scope limited to solar PV and CSP additions and installed base rather than total renewable electricity value.
Benchmark comparison
| Source | Market Size | Gaps in Research Methodology |
|---|---|---|
| Mordor Intelligence | USD 0.00 B (2025) | |
| Industry Research Publisher A | USD 0.00 B (2024) | Reports the market in installed capacity terms (GW) for solar, and it is not stated as a USD market value, so a direct comparison to a USD baseline is not possible without a separate pricing and revenue conversion layer. |
| Industry Research Publisher B | USD 16.50 B (2025) | Uses a broader renewable energy revenue scope that includes multiple technologies and applications, which inflates the number when it is read as a solar-only market size and also depends heavily on power price and currency timing assumptions. |
Overall, the spread is mostly explained by unit choice and scope, since capacity-based solar sizing and revenue-based renewable sizing answer different questions. By keeping the inputs tied to observable commissioning and pipeline signals, and by avoiding implicit price conversion when the core metric is capacity, the final estimate stays traceable and easier to replicate year to year.


Key Questions Answered in the Report
How fast will the Indonesia solar energy market grow between 2026 and 2031?
Capacity is projected to expand from 2.97 GW in 2026 to 14.91 GW by 2031, posting a 38.10% CAGR.
Which segment leads the Indonesia solar energy market today?
Utility-scale projects hold 65.20% of installed capacity, driven by large PPAs under Presidential Regulation 112/2022.
Why are off-grid systems seeing the highest growth rate?
Diesel-hybrid replacements on remote islands cut PLN’s fuel subsidies and benefit from concessional ADB financing.
How does the TKDN rule affect project economics?
The 20% local-content requirement lifts EPC costs by 12-18% because Indonesia lacks upstream polysilicon manufacturing.
What are the main risks facing investors?
Grid curtailment on Java-Bali, currency volatility, and the absence of sovereign guarantees on floating-PV PPAs remain the key execution risks.
Page last updated on:


 Your data is secure and never sold or shared.


