
Market Overview
| Study Period | 2020 - 2031 |
|---|---|
| Forecast Data Period | 2026 - 2031 |
| Base Year Market Size (2025) | USD 8.38 Billion |
| Market Size (2026) | USD 8.99 Billion |
| Market Size (2031) | USD 12.73 Billion |
| Growth Rate (2026 - 2031) | 7.22 % |
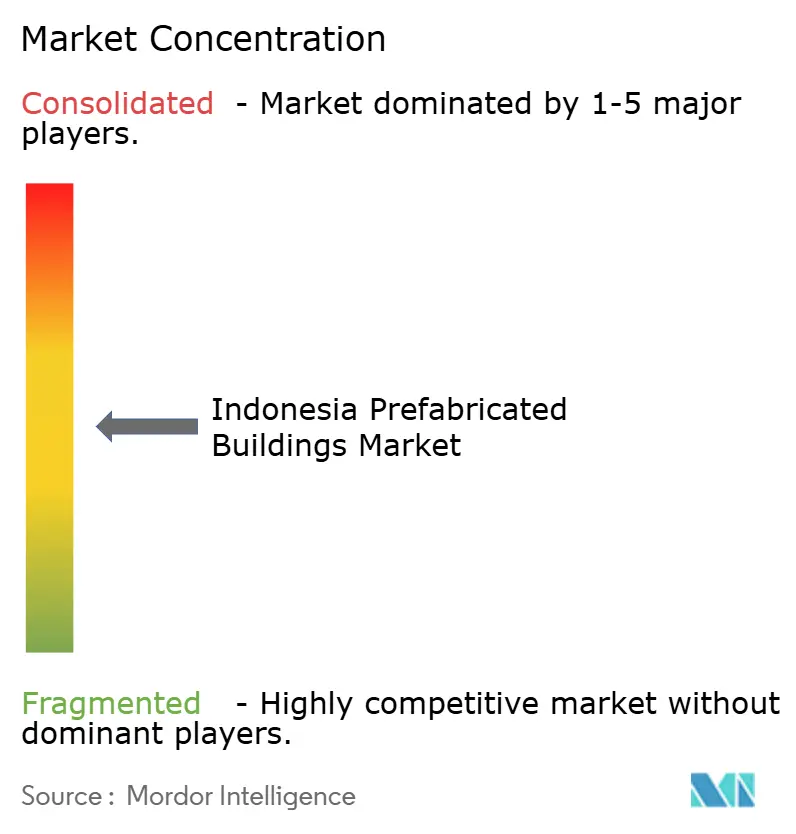
| Market Concentration | Medium |
Major Players *Disclaimer: Major Players sorted in no particular order Image © Mordor Intelligence. Reuse requires attribution under CC BY 4.0. | |
Indonesia Prefabricated Buildings Market Analysis by Mordor Intelligence
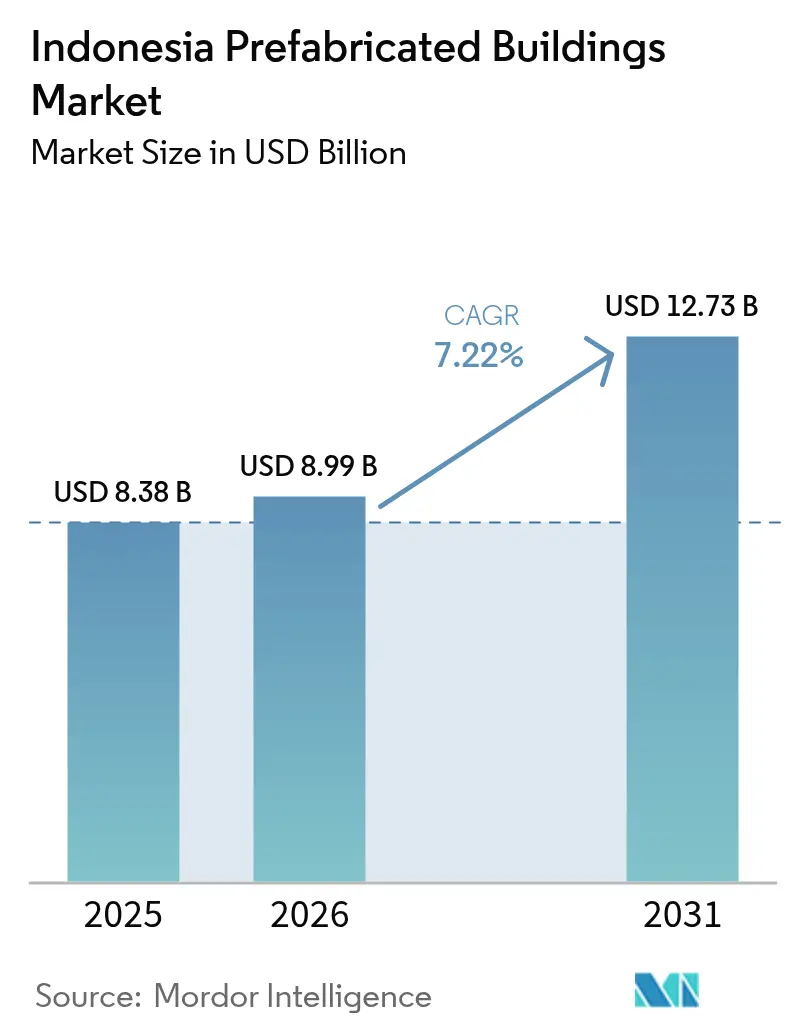
The Indonesia prefabricated buildings market size is expected to grow from USD 8.38 billion in 2025 to USD 8.99 billion in 2026 and is forecast to reach USD 12.73 billion by 2031 at 7.22% CAGR over 2026-2031. Market momentum stems from the government’s decision to industrialize construction so it can clear a 9.9 million-unit housing backlog while meeting the infrastructure objectives set in the 2025–2029 national development plan[1]Indonesia.go.id, “Peta Jalan Wujudkan Hajat Hidup Layak bagi MBR,” Government of Indonesia, indonesia.go.id.
Rising allocations for public works, stronger private-sector participation, and greater adoption of modular technologies create a runway for sustained double-digit revenue growth in several high-value niches of the Indonesia prefabricated buildings market. President Prabowo Subianto’s “3 Million Homes” program establishes annual volume targets—2 million rural houses and 1 million urban apartments—that make factory production more economical than site-built methods, driving rapid order inflows for concrete, timber, and volumetric modules. At the same time, the Nusantara new capital project and offshore mining expansion broaden demand beyond residential, strengthening the multi-segment outlook for the Indonesia prefabricated buildings market.
Key Report Takeaways
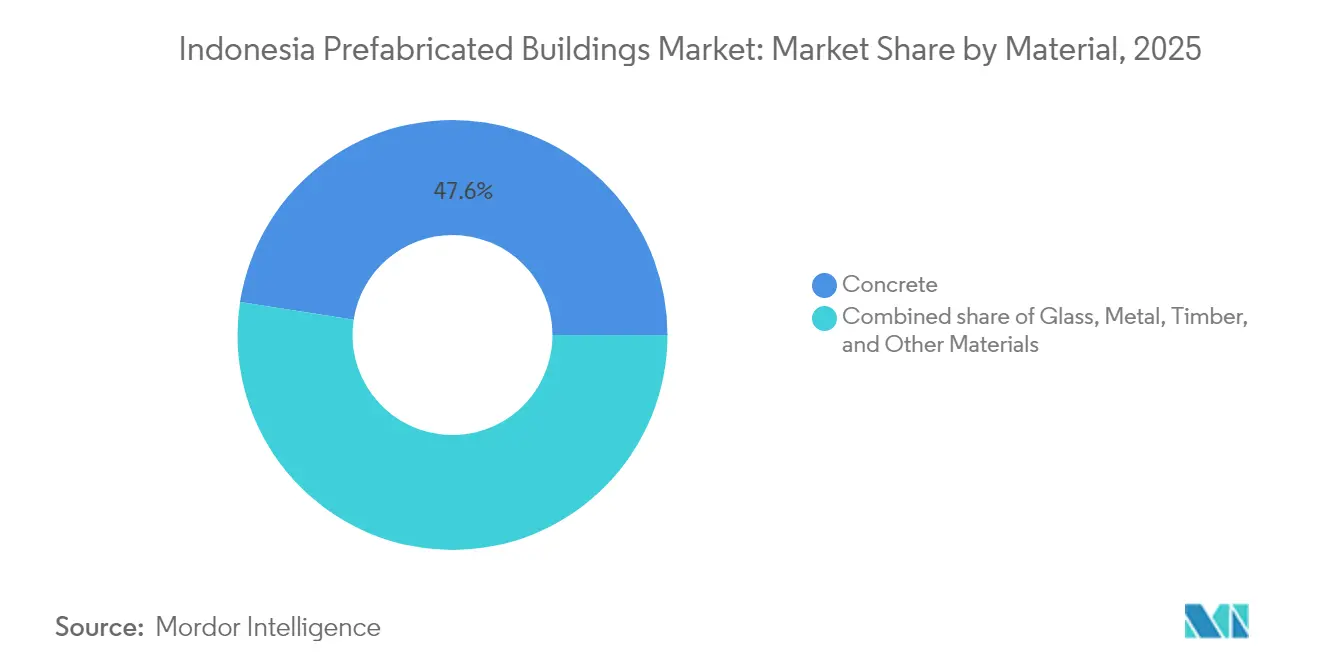
- By material type, concrete captured 47.55% of the Indonesia prefabricated buildings market share in 2025. The timber segment is projected to grow at a 7.78% CAGR through 2031.
- By application, residential commanded 54.65% of the Indonesia prefabricated buildings market size in 2025, while commercial applications are advancing at a 7.46% CAGR to 2031.
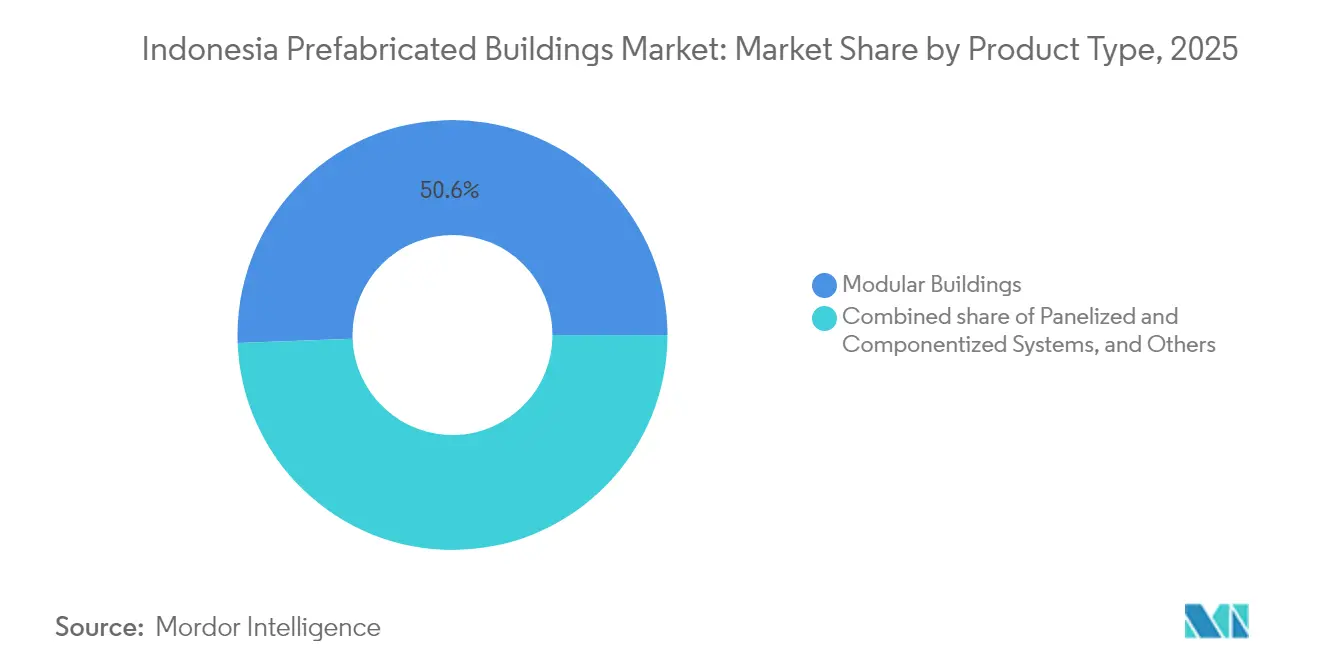
- By product type, modular buildings held 50.60% revenue share of the Indonesia prefabricated buildings market in 2025 and lead growth at a 7.72% CAGR through 2031.
- By key cities, Jakarta led with a 21.85% share in 2025; the Rest of Indonesia is forecast to expand at an 7.95% CAGR through 2031.
Note: Market size and forecast figures in this report are generated using Mordor Intelligence’s proprietary estimation framework, updated with the latest available data and insights as of 2026.
Indonesia Prefabricated Buildings Market Trends and Insights
Drivers Impact Analysis*
| Driver | (~) % Impact on CAGR Forecast | Geographic Relevance | Impact Timeline |
|---|---|---|---|
| One-Million Homes public housing push accelerating modular adoption | +1.8% | National, Java & Sumatra focus | Short term (≤ 2 years) |
| Skilled-labor gaps in eastern islands favoring off-site production | +1.2% | Maluku, Papua, Sulawesi | Medium term (2-4 years) |
| Nusantara new capital’s fast-track demand for worker accommodation | +1.5% | East Kalimantan | Short term (≤ 2 years) |
| Mandatory green-building rating spurs low-waste volumetric timber | +0.9% | Urban centers nationwide | Long term (≥ 4 years) |
| Offshore nickel-mining camps requiring rapid relocatable pods | +0.7% | Sulawesi & Maluku | Medium term (2-4 years) |
| Carbon-tax readiness driving industrialized net-zero construction | +0.6% | Major cities | Long term (≥ 4 years) |
| Source: Mordor Intelligence | |||
One-Million Homes Public Housing Push Accelerating Modular Adoption
The shift from the prior “One Million Homes” target to the ambitious “3 Million Homes” program alters the demand calculus in favor of prefabrication. Annual construction quotas surpass the capacity of traditional builders, prompting the Ministry of Public Works and Housing to fast-track standardized RISHA modules priced below IDR 8 million per unit to meet affordability thresholds. Middle-Eastern sovereign investors have pledged financing for up to 1 million units, importing volumetric methods refined in desert housing projects that reduce construction times by 30%-40% compared with in-situ techniques.
Confiscated land from corruption cases lowers acquisition costs, further strengthening the value proposition of the Indonesia prefabricated buildings market for public-sector buyers. Factory pre-installation of plumbing and electrical lines minimizes reliance on scarce site labor, allowing rural projects to proceed on schedule even during monsoon seasons.
Skilled-Labor Gaps in Eastern Islands Favoring Off-Site Production
Indonesia’s east-west labor imbalance has widened since 2024 as mega-projects shift outside Java. The Nusantara development alone needs roughly 300,000 construction workers, yet East Kalimantan can supply barely a third of that figure[2]The Jakarta Post, “New capital city development requires 300,000 construction workers,” thejakartapost.com. Prefabricated modules produced in Java travel by roll-on-roll-off vessels, arriving ready-to-assemble so local crews focus on anchoring and finishing rather than skilled trades. With national infrastructure spending set at IDR 422.7 trillion for 2024, contractors increasingly rely on modular methods to arbitrage labor costs between surplus regions and short-supply provinces, thereby sustaining orders for the Indonesia prefabricated buildings market.
Nusantara New Capital’s Fast-Track Demand for Worker Accommodation
The IDR 48.8 trillion 2025 allocation for Nusantara earmarks specific funding for worker dormitories, early civil-service housing, and government offices, requiring lightning-fast delivery timetables. Chinese firm Citic Construction will erect 60 residential towers using hybrid steel-concrete modules, demonstrating international confidence in Indonesia’s modular ecosystem. Green-forest-city mandates cap on-site waste and carbon intensity, giving an edge to prefabricated volumetric systems that generate 50% less waste than cast-in-place alternatives. Digital twins and BIM are integrated from design through commissioning, positioning the Indonesia prefabricated buildings market as a showcase for smart-city construction.
Mandatory Green-Building Rating Spurs Low-Waste Volumetric Timber
Regulation No. 21/2021 and local bylaws such as Jakarta’s Regulation 38/2012 compel new projects to earn green-building points, pushing developers toward low-embodied-carbon materials. Timber modules sequester carbon for decades and generate minimal off-cuts because CNC mills pre-cut each panel to ±2 mm tolerance. Academic trials on cross-laminated timber confirm resilience against zone-4 seismic loads, clearing a key engineering hurdle for medium-rise adoption. As the Indonesia Carbon Exchange matures, developers can monetize carbon savings, offsetting the 15% price premium of volumetric timber units. These factors widen the adoption window for the Indonesia prefabricated buildings market in urban high-performance segments.
Restraints Impact Analysis*
| Restraint | (~) % Impact on CAGR Forecast | Geographic Relevance | Impact Timeline |
|---|---|---|---|
| Fragmented permitting across 38 provinces inflates compliance cost | -1.4% | Nationwide; outer islands hardest hit | Medium term (2-4 years) |
| High up-front factory CAPEX vs. volatile residential demand | -1.1% | Java & Sumatra industrial belts | Short term (≤ 2 years) |
| Limited domestic fire-testing facilities delaying multistory timber | -0.8% | Major urban centers | Long term (≥ 4 years) |
| Inter-island logistics premium on 12-meter modules | -0.9% | Eastern Indonesia & offshore sites | Medium term (2-4 years) |
| Source: Mordor Intelligence | |||
Fragmented Permitting Across 38 Provinces Inflates Compliance Cost
Regional autonomy leaves each province free to impose unique documentation, soil-test, and structural-review requirements. Processing times stretch from 14 days in streamlined districts to several months elsewhere, obliging manufacturers to tweak identical modules for differing local codes[3]International Journal of Scientific and Research Publications, “Activities in The Certificate of Occupancy Process…,” ijsrp.org. The National Standardization Agency issues SNI prefabrication standards, yet uneven enforcement forces companies to budget 3%-5% of project cost for compliance specialists. That drag tempers the addressable growth of the Indonesia prefabricated buildings market.
High Up-Front Factory CAPEX vs. Volatile Residential Demand
Modern volumetric lines cost USD 10-50 million; repayment hinges on steady multi-year order books. Yet mortgage-rate swings and shifting subsidy rules periodically stall housing launches, as seen in 2024 when residential building permits fell 8.6% year-on-year. Some producers run below 60% capacity during down-cycles, lengthening ROI horizons and deterring new entrants to the Indonesia prefabricated buildings market.
*Our forecasts treat driver/restraint impacts as directional, not additive. The impact forecasts reflect baseline growth, mix effects, and variable interactions.
Segment Analysis
By Material Type: Concrete Dominance Faces Timber Innovation
Concrete retained 47.55% of Indonesia prefabricated buildings market share in 2025, reflecting mature supply chains, standardized molds, and robust precast codes. Heritage projects such as Jakarta’s MRT employed precast girders that set precedents for structural integrity and lifecycle cost, reinforcing developer confidence in concrete modules. The Indonesia prefabricated buildings market size for concrete solutions is positioned to expand steadily as public-works spending maintains high baseline volumes.
Timber, while accounting for a smaller slice, is growing fastest at a 7.78% CAGR to 2031. Carbon-tax scenarios modeled by the Ministry of Finance assign price pathways that make engineered timber par with reinforced concrete by 2027 on a whole-life-cost basis, accelerating investment in CLT mills. International hotel chains are piloting four-story timber lodges in Labuan Bajo, signaling wider commercial acceptance. Consequently, the Indonesia prefabricated buildings market will likely witness timber capture incremental points of market share each year through the decade.



By Application: Residential Scale Drives Commercial Innovation
Residential accounted for 54.65% of the Indonesia prefabricated buildings market size in 2025, underpinned by the “3 Million Homes” agenda and provincial subsidy schemes. RISHA concrete units and simple timber cabins make up the bulk of deliveries, often assembled by community cooperatives. This segment remains price-sensitive, favoring standardized designs that allow bulk procurement through e-catalogs managed by the National Public Procurement Agency.
Commercial builds—offices, hotels, data centers—present smaller but faster-expanding revenue pools. A 7.46% CAGR through 2031 reflects growing private capital inflows into logistics and tourism. Mines in Sulawesi now lease plug-and-play accommodation pods for USD 19 per bed per night, a model that improves cashflow visibility for manufacturers. As a result, commercial work is expected to capture a larger portion of Indonesia prefabricated buildings market share over the forecast horizon.
By Product Type: Modular Buildings Lead Integrated Solutions
Modular buildings held 50.60% of 2025 revenue and are forecast to post the highest CAGR at 7.72%. Factories now ship 95%-finished rooms complete with bathroom pods, conduits, and IoT sensors, cutting commissioning to as little as 15 days. PT Wijaya Karya reported an 8.4% gross-margin uptick in Q3 2024 by shifting from panelized supply toward end-to-end modular turnkey packages. Consequently, the Indonesia prefabricated buildings market is pivoting to full volumetric formats, especially for government dormitories and mid-scale hotels.
Panelized and componentized systems keep traction where road clearances restrict box transport or where architects require bespoke facades. Hybrid steel-timber stacks now appear in coastal resorts, illustrating design latitude. Those niches sustain competition but will expand slower than the modular mainstay of the Indonesia prefabricated buildings market.
Geography Analysis
Jakarta contributed 21.85% of 2025 sales, anchored by transit-oriented apartment blocks and green‐retrofit mandates for office towers. Still, new capital spending is migrating eastward. The Rest of Indonesia segment is on track for an 7.95% CAGR, outpacing the overall Indonesia prefabricated buildings market as provincial governments fast-track ports, roads, and mining facilities in Sulawesi, Maluku, and Papua. Surabaya and Bandung leverage technical universities and industrial estates to seed local prefab clusters, reducing dependence on Jakarta suppliers and slashing delivery times by two weeks on average.
Decentralization also spurs competition among regional EPC firms, creating price tension that benefits public tenders but pressures margins. Over time, distributed factory networks should reduce logistics premiums, unlocking further penetration of the Indonesia prefabricated buildings market in remote provinces.
Regulatory Landscape
Indonesia's prefabricated buildings activity sits within the national construction services framework under Law No. 2 of 2017 (as amended by Law No. 6 of 2023) and the government's risk-based business licensing regime under Government Regulation No. 28 of 2025. For market participants bidding into public works and housing programs, compliance is shaped by Ministry of Public Works and Housing rules on business activity and product/service standards, supervision, and sanctions (including the framework set under Ministry Regulation No. 6 of 2025), alongside mandatory domestic content (TKDN) requirements referenced in the Ministry of PUPR Decree No. 602/KPTS/M/2023.
On the technical side, Ministry-issued NSPK and specifications influence acceptance of prefabricated components in civil and building projects, including the 2025 General Specifications (Spesifikasi Umum 2025) for road and bridge construction that set baseline requirements for materials and execution. In March 2026, the Directorate General of Construction Development (Ditjen Bina Konstruksi) convened stakeholders in Yogyakarta to gather input for a draft Presidential Regulation (Raperpres) on Building Supply/Provision Services (Usaha Penyediaan Bangunan), indicating tighter formalization around accreditation, registration, and certification for businesses supplying industrialized building solutions.
Value Chain Analysis
The Indonesia prefabricated buildings value chain starts with project origination and design, where owners (public housing and public works agencies, IKN/Nusantara project entities, and private developers) increasingly specify repeatable module designs and short schedules that favor BIM-enabled engineering and standardization. This flows into upstream inputs such as cement and aggregates for precast concrete, steel coils/sections for light-gauge and structural frames, insulation and sandwich panels, MEP kits, and interior finishes, followed by factory fabrication (precast yards, panel lines, and volumetric assembly). In-country suppliers and integrators include modular cabins/pods and building systems providers such as PT Sanwa Prefab Technology for panels and portable structures, GRHYA for cabins and pods, and Timberlab for mass timber solutions. Large contractors and SOEs also act as integrators by bundling engineering, procurement, and installation for government-linked work.
Midstream activities include QA/QC and certification to meet SNI/Ministry standards and TKDN thresholds for public procurement, after which modules are distributed via road and inter-island shipping to installation sites. The downstream stage covers on-site cranage, anchoring, envelope completion, and commissioning, which is increasingly paired with after-sales maintenance for pods and worker accommodation camps. Logistics and permitting remain the main friction points for 12-meter class modules and multi-province rollouts, while ongoing efforts to formalize "building provision businesses" through the Raperpres process and the Ministry of Housing and Residential Areas (Kementerian PKP) April 2026 push for modular housing under the 3 million homes program are pulling more participants into standardized, repeatable production-and-installation workflows.
Competitive Landscape
The market is moderately fragmented, with state-owned giants PT Wijaya Karya and PT Hutama Karya leveraging sovereign credit lines to secure mega-projects. These firms often bundle EPC, financing, and facility management into a single tender. On the other hand, private players like PT Summarecon Prefab focus on higher-margin commercial constructions, utilizing agile design teams and imported robotic welding to reduce lead times. Partnerships with global innovators are becoming increasingly common: Citic Construction combines Chinese funding with volumetric expertise, while Japanese and Qatari investors collaborate to develop subsidized timber housing estates.
Competitive dynamics revolve around vertical integration, BIM proficiency, and ESG alignment. Companies adopting online IoT monitoring gain an edge by securing maintenance contracts that extend revenue beyond initial project delivery. Simultaneously, local steel fabricators are diversifying into turnkey pods to mitigate risks associated with commodity price fluctuations. These developments indicate that the Indonesian prefabricated buildings sector is likely to shift towards larger, technology-driven players over the next five years, although project-based procurement will continue to provide opportunities for specialized regional firms.
Indonesia Prefabricated Buildings Industry Leaders
PT Wijaya Karya (WIKA) Building
Kirby Building Systems
Bali Prefab
Superior Prima Sukses PT Tbk
PT Bukaka Teknik Utama Tbk
- *Disclaimer: Major Players sorted in no particular order

Market Opportunities and Future Outlook
Demand pull from national housing delivery and fast-track project schedules continues to create whitespace for standardized, factory-built systems that reduce site labor intensity and accelerate handover, especially in worker accommodation, temporary housing, and repeatable low-rise units that align with the government's 3 million homes agenda. A concrete proof point is PT Wijaya Karya Bangunan Gedung Tbk (WEGE) launching Netro (a smart net-zero modular housing system using PPVC) in May 2025, illustrating how productized modular platforms are being positioned for government-linked housing programs and for developers seeking faster and more controllable delivery.
Opportunity is also forming around system-level enablers rather than only new product formats. In December 2024, the Ministry of PUPR finalized a 2025-2029 roadmap for construction material and equipment supply chain management, and in 2026 Ditjen Bina Konstruksi continued public consultation for a Draft Presidential Regulation on Building Provision Business (Usaha Penyediaan Bangunan), supporting clearer accreditation and certification pathways for industrialized building suppliers. Taken together with sustainable construction requirements under PUPR Regulation No. 9 of 2021 and TKDN-driven procurement behavior, these initiatives expand the addressable space for compliant local manufacturers and EPCs that can document domestic content, demonstrate BIM-enabled processes, and offer repeatable module catalogs for multi-site programs across provinces.
Recent Industry Developments
- July 2026: PT Superior Prima Sukses Tbk (BLES) communicated its position as the largest lightweight brick producer in Indonesia, citing 5.6 million m3 of annual capacity across six production lines (including sites in Mojokerto, Lamongan, Sragen, Sidoarjo, and Banjarnegara). The scale reinforces domestic availability of walling materials that support prefab and fast-track construction packages. It also raises competitive pressure on regional supply as housing and contractor demand concentrates around reliable, high-volume producers.
- April 2026: PT Wijaya Karya Bangunan Gedung Tbk (WEGE) completed the Transmigration Mess project in Rempang, Batam using its WGF 2.0 modular technology under a reported contract value of Rp57.4 billion. Delivery of a modular accommodation facility highlights how off-site construction is being used for rapid workforce and community-support infrastructure. Execution on a defined modular system improves referenceability for similar government-linked housing and accommodation tenders.
- August 2024: Sumitomo Forestry partnered with Sinarmas Land to develop around 4,100 residential units near Jakarta under an announced USD 1.2 billion investment, incorporating eco-friendly wooden structures and EDGE certification. The program anchors a high-visibility pathway for timber-based prefabrication in mainstream residential development. It also supports broader adoption of standardized, lower-waste building methods aligned with green-building requirements in major urban markets.


Research Methodology Framework and Report Scope
Market Definition and Coverage
This market covers the value of prefabricated buildings in Indonesia where major building parts are produced off-site in a controlled facility and then assembled at the project location, including modular, panelized, and componentized systems across residential, commercial, and other uses.
Scope exclusions: Fully on-site, stick-built construction that does not use factory-made building sections is excluded.
Segmentation Overview
- By Material Type
- Concrete
- Glass
- Metal
- Timber
- Other Materials
- By Application
- Residential
- Commercial
- Others
- By Product Type
- Modular Buildings
- Panelized & Componentized Systems
- Other Prefab Types
- By Key Cities
- Jakarta
- Surabaya
- Bandung
- Medan
- Rest of Indonesia
Data Sources, Market Sizing, and Validation
Desk Research
Desk research was used to build the base demand picture in Indonesia and to anchor the model on construction activity that can be observed in public data. We mainly used official indicators such as Statistics Indonesia (BPS) releases on construction and housing, Bank Indonesia macro series that affect build cycles, and Ministry of Public Works and Housing publications that indicate project pipelines and technical standards.
To keep the sizing grounded, we also referred to sources such as customs and trade statistics for relevant building materials, building and safety codes published by Indonesian authorities, and open technical papers and journals that discuss prefabrication methods and adoption barriers. Company annual reports, investor presentations, and credible business press were used to cross-check capacity statements and project wins. In addition, a paid subscription focused on company financials and another on shipment-level import and export data were used selectively to validate a few assumptions. These sources are illustrative, and many other public and paid references were also checked for data collection, validation, and clarification.
Primary Interviews and Surveys
Primary interviews and surveys were used to convert broad construction signals into prefabricated-specific shares, pricing logic, and realistic adoption timelines. We spoke with manufacturers, EPC and construction contractors, distributors, and project owners, and then compared the same topics with independent engineering and procurement voices across Indonesia to close gaps from desk research and recheck assumptions.
Because demand can vary by project type and city clusters, we stress-tested inputs with respondents following residential programs, commercial build-outs, and industrial and infrastructure sites. The results were then reconciled back to what can be explained by observable construction activity.
Distribution of primary research fieldwork respondents
| Company type | Respondent position |
|---|---|
| Top tier: 38% | CXOs: 13% |
| Mid tier: 46% | Functional/Unit leaders: 43% |
| Smaller Players: 16% | Managers: 44% |
Market-Sizing & Forecasting
Sizing starts with a top-down reconstruction where national construction output and building activity signals are translated into an addressable pool for prefabricated buildings using penetration rates gathered from interviews. The totals are then corroborated with selective bottom-up approximations, such as sampled project counts by major cities, typical building-area to spend conversions, and indicative ASP by product type and material. These checks are used to adjust outliers.
Inputs tracked in the model include construction spending and starts, urban housing demand and policy-led housing programs, share of modular versus panelized systems in awarded projects, material cost movement (steel, concrete, and timber proxies), and lead-time advantages that affect contractor preference. Where bottom-up information was incomplete for smaller provinces, gaps were handled through city-to-rest-of-country ratios that were validated during follow-up calls.
For forecasting, scenario analysis was used, since adoption depends on policy pacing, contractor capacity, and project pipeline timing. The base case was built from a consensus view from interviews, followed by sensitivity checks on penetration, ASP progression, and the expected mix shift across applications.
Data Validation & Update Cycle
Validation was done through several checks so the final value stays explainable from start to finish. We compared outputs against independent signals such as construction growth, announced project pipelines, and observed price ranges, and then reviewed any large variances at the segment and city level before sign-off.
If an assumption moved materially, such as a change in project approvals or a visible shift in material prices, respondents were re-contacted and the model was rerun. Reports are refreshed annually, with interim updates when major events impact demand, and a final pre-delivery review is done so clients receive the latest updated view.
Mordor Intelligence's Indonesia Prefabricated Buildings Industry Study Market Size Measured Against Other Published Estimates
Published market sizes for prefabricated buildings in Indonesia can differ a lot, even when the topic sounds the same. Most gaps come from what is counted as a prefabricated building sale, the base year used, and how price and adoption are projected across residential, commercial, and industrial activity.
Traditional on-site construction spend sits outside Mordor Intelligence's scope, which is why some broader construction-linked estimates do not align with a prefabrication-only demand pool. Differences also show up when a source bundles products, services, and solutions together, uses a more conservative or aggressive penetration path, or applies currency conversion and inflation timing differently when moving from local pricing to USD values.
Benchmark comparison
| Source | Market Size | Gaps in Research Methodology |
|---|---|---|
| Mordor Intelligence | USD 8.38 B (2025) | |
| Trade Publisher A | USD 0.49 B (2025) | Often presented as a narrower revenue view tied to a limited set of prefab building solutions, which can exclude large project categories captured when the market is built from construction activity and prefab penetration. |
| Industry Research Group B | USD 3.40 B (2025) | Typically relies on a tighter segment mapping and region split, and may apply different adoption shares and price progression by material and application, which shifts the total even for the same base year. |
The table shows that the spread is mainly explained by what gets counted and how the demand pool is constructed before forecasting begins. By tying totals to clear activity indicators and then checking them with realistic penetration and pricing inputs, our estimate stays traceable and repeatable even when public data is not perfectly complete.


Key Questions Answered in the Report
What is the current value of the Indonesia prefabricated buildings market?
The market is valued at USD 8.99 billion in 2026 and is forecast to reach USD 12.73 billion by 2031.
How fast is the sector growing?
It is expanding at a 7.22% CAGR over the 2026–2031 period, underpinned by large-scale housing and infrastructure programs.
Which product type is gaining the most traction?
Fully integrated modular buildings lead sales with 50.60% share in 2025 and exhibit the highest 7.72% CAGR through 2031.
Why is timber prefabrication becoming more popular?
Mandatory green-building rules and looming carbon taxes enhance the cost competitiveness of engineered timber, driving a 7.78% CAGR for the segment.
What role does the Nusantara new capital project play?
Nusantara is accelerating demand for rapid-deployment worker housing and government offices, boosting order books for modular suppliers.
Page last updated on:





