
Market Overview
| Study Period | 2021 - 2031 |
|---|---|
| Forecast Data Period | 2026 - 2031 |
| Base Year Market Size (2025) | USD 13.88 Billion |
| Market Size (2026) | USD 14.6 Billion |
| Market Size (2031) | USD 18.81 Billion |
| Growth Rate (2026 - 2031) | 5.18 % |
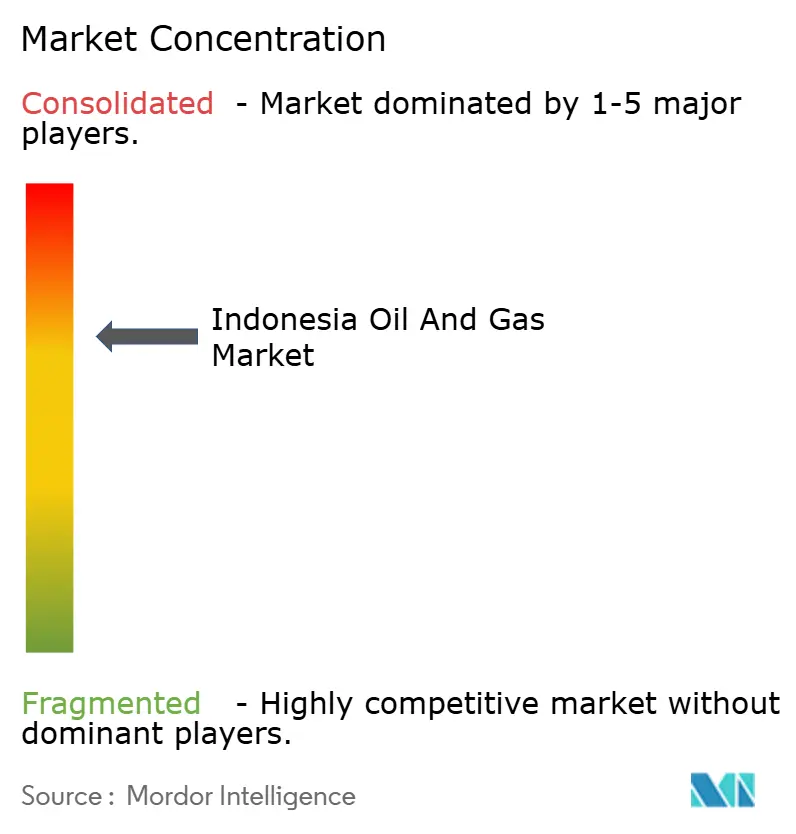
| Market Concentration | Medium |
Major Players *Disclaimer: Major Players sorted in no particular order Image © Mordor Intelligence. Reuse requires attribution under CC BY 4.0. | |
Indonesia Oil And Gas Market Analysis by Mordor Intelligence
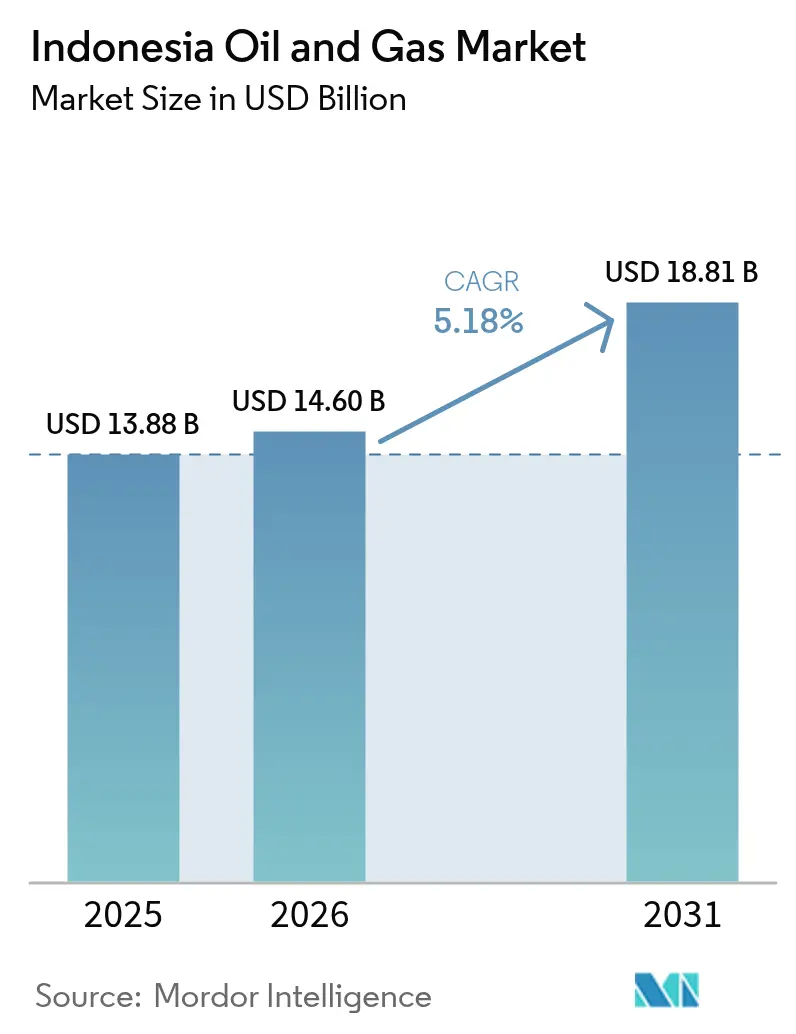
The Indonesia Oil And Gas market size is expected to grow from USD 13.88 billion in 2025 to USD 14.6 billion in 2026 and is forecast to reach USD 18.81 billion by 2031 at 5.18% CAGR over 2026-2031.
This trajectory highlights how the Indonesian oil and gas market is shifting from long-mature onshore basins toward offshore growth, carbon capture integration, and digital transformation. Rising domestic demand, favorable production-sharing terms, and deep-water discoveries are widening capital flows into exploration while sustaining service revenues from maintenance and turnaround activities that keep aging infrastructure online. Competitive intensity is shaped by Pertamina’s 60% share of national output, the return of international oil companies that leverage advanced recovery techniques, and escalating investment in CCUS hubs, which extend field life and lower lifecycle emissions. Offshore fields in the Natuna Sea, Abadi Masela, and Mahakam Delta are redefining project economics, with FPSOs and subsea tiebacks significantly shortening the time to first gas. Meanwhile, small-scale LNG solutions are broadening the market reach to remote islands and mining enclaves.
Key Report Takeaways
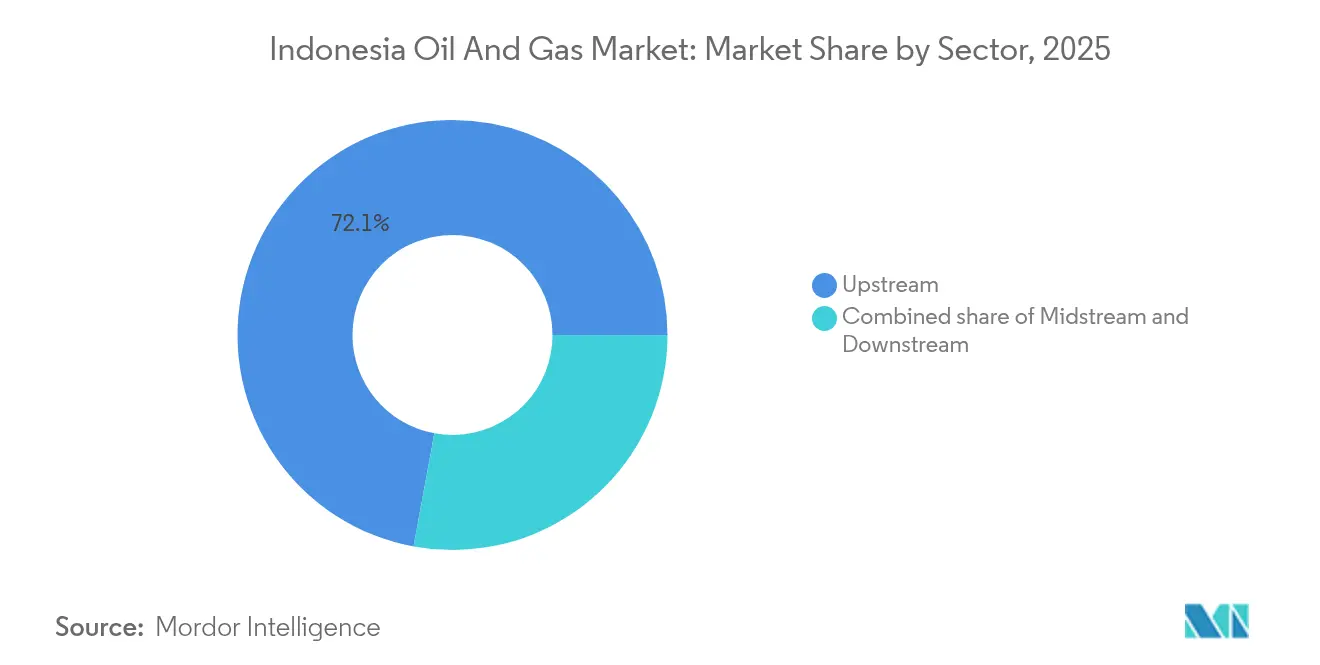
- By sector, upstream activities held a 72.10% Indonesia oil and gas market share in 2025, while midstream and downstream segments are projected to grow at 4.75% and 4.22% CAGRs, respectively, through 2031.
- By location, offshore developments are advancing at a 5.92% CAGR through 2031, outpacing the mature onshore segment that still commanded 58.10% of the Indonesian oil and gas market size in 2025.
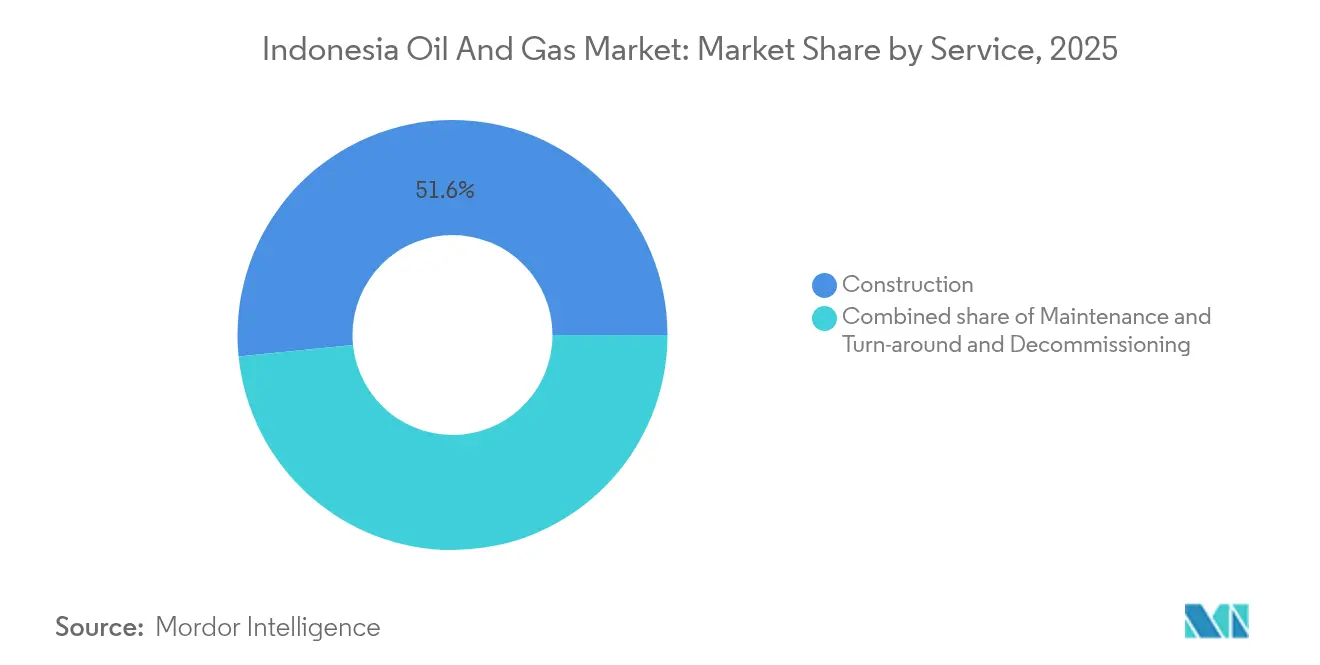
- By service, maintenance, and turn-around offerings are forecast to expand at a 6.05% CAGR, yet construction services retained a 51.60% share of the Indonesian oil and gas market size in 2025.
Note: Market size and forecast figures in this report are generated using Mordor Intelligence’s proprietary estimation framework, updated with the latest available data and insights as of 2026.
Indonesia Oil And Gas Market Trends and Insights
Drivers Impact Analysis*
| Driver | (~) % Impact on CAGR Forecast | Geographic Relevance | Impact Timeline |
|---|---|---|---|
| Robust domestic demand from rising middle class | +0.8% | National, with concentration in Java, Sumatra, and Kalimantan urban centers | Medium term (2-4 years) |
| Government push for 1 mb/d crude & 12 Bcf/d gas by 2030 | +1.1% | National, with focus on Natuna, Mahakam, and East Java basins | Long term (≥ 4 years) |
| LNG export arbitrage to North-East Asia | +1.0% | Coastal regions, particularly Bontang, Tangguh, and planned Jawa-1 facilities | Medium term (2-4 years) |
| PSC gross-split incentives attracting IOCs | +0.7% | National, with early gains in frontier basins and deep-water blocks | Short term (≤ 2 years) |
| Carbon-capture hubs boosting mature-field economics | +0.4% | Mature basins in South Sumatra, Central Java, and East Kalimantan | Long term (≥ 4 years) |
| AI-enabled digital oilfields cutting lifting cost | +0.5% | National, with pilot implementations in Pertamina and IOC operations | Medium term (2-4 years) |
| Source: Mordor Intelligence | |||
Robust Domestic Demand from Rising Middle Class
Indonesia’s growing middle class is driving up gasoline, diesel, and petrochemical consumption, with daily crude demand projected to reach 1.8 million barrels by 2030, up from roughly 1.6 million barrels in 2025.[1]Ministry of Energy and Mineral Resources, “Energy Outlook 2025–2035,” esdm.go.id Java’s urbanization rate above 60% intensifies transport fuel use, despite efficiency drives, while rising personal incomes underpin higher demand for plastics and packaging. Natural gas demand is expected to reach 12 Bcf/d by 2030, as combined-cycle power plants supplement renewable energy intermittency and meet the needs of industrial boilers. Fuel-subsidy reforms redirect savings into roads, ports, and mass transit projects, which further spur energy needs, reinforcing the long-term pull for domestic hydrocarbons.
Government Push for 1 Million bbl/d Crude and 12 Bcf/d Gas by 2030
SKK Migas targets 1 million barrels per day (bbl/d) of oil and 12 billion cubic feet per day (Bcf/d) of gas to curb import dependence, which already covers 60% of refined-product demand. Priority accelerators include 127 blocks slated for fast-track approval, fiscal sweeteners for enhanced recovery, and digital field surveillance that lifts output from marginal reservoirs. Projects such as Abadi LNG and the Tangguh expansion underpin gas deliverability, whereas steamflood and chemical EOR initiatives at Minas and Duri slow base decline. The regulatory path features gross-split PSCs that streamline audits and guarantee earlier cash flow, attracting Chevron, Harbour Energy, and Medco into frontier acreage.
LNG Export Arbitrage to North-East Asia
Indonesia’s 34 MTPA of operating LNG capacity from Bontang and Tangguh traditionally feeds Japan, South Korea, and China, where spot premiums can rise USD 2–3/MMBtu above domestic. While Abadi LNG will inject another 9.5 MTPA, policymakers warn that swelling domestic offtake could see Indonesia pivot from a net exporter to an importer late this decade. Pertamina’s USD 1.5 billion program for modular regas units enables diesel displacement on outer islands, expanding local gas penetration and partially cushioning export erosion. Producers thus navigate a dual market, capturing arbitrage when available, while prioritizing long-term Indonesian contracts that hedge policy risk.
PSC Gross-Split Incentives Attracting IOCs
Introduced in 2017, gross-split PSCs grant contractors a fixed production percentage upfront, thereby eliminating the need for exhaustive cost-recovery audits.[2]Upstream Online, “Gross-Split PSCs Lure IOCs Back,” upstreamonline.com Subsequent amendments enhance splits for deep-water, high-CO₂, or CCUS-integrated projects, resulting in after-tax IRRs that are up to 4 percentage points higher than those under legacy terms. Faster cash visibility has lured TotalEnergies back into Mahakam infill drilling and enticed Shell to re-enter the Corridor Block after setbacks from its divestment. Early-mover benefits include carbon-credit eligibility for verified sequestration associated with producing assets, thereby increasing the blended project NPV.
Restraints Impact Analysis*
| Restraint | (~) % Impact on CAGR Forecast | Geographic Relevance | Impact Timeline |
|---|---|---|---|
| Renewable-energy build-out & EV adoption | -0.4% | National, with accelerated impact in Java and urban centers | Medium term (2-4 years) |
| Declining output from ageing basins | -0.7% | Legacy producing regions: South Sumatra, Central Java, East Kalimantan | Short term (≤ 2 years) |
| Land-right & indigenous community disputes | -0.3% | Papua, Kalimantan, and remote Sumatra regions | Long term (≥ 4 years) |
| ESG-linked financing constraints | -0.4% | Global, with spillover effects on Indonesian upstream projects | Short term (≤ 2 years) |
| Source: Mordor Intelligence | |||
Renewable-Energy Build-Out and EV Adoption
Indonesia aims for 23% renewable energy penetration by 2025 and net-zero emissions by 2060, ambitions that redirect capital from fossil fuel projects into solar, wind, and geothermal units totaling 10 GW under construction. Fiscal incentives for EV assembly plants draw global OEMs to West Java, in line with a national goal of 2 million battery electric vehicles on the roads by 2030. While gas still balances intermittency, long-run gasoline demand faces attrition as charging networks densify across toll-road corridors. Yet infrastructure gaps and price sensitivity moderate short-term displacement, allowing the Indonesian oil and gas market to retain core transport and industrial segments.
Declining Output from Ageing Basins
Production falls 5–8% annually at Minas, Duri, and Mahakam, despite the implementation of waterflood and steam cycles, and lifting unit costs increase by 15–20% per year.[3]Pertamina, “Enhanced Recovery at Minas and Duri,” pertamina.com The Mahakam Delta, once Indonesia’s largest gas hub, now yields 600 MMcf/d, down from peaks above 1 Bcf/d. AI-driven well diagnostics reduced optimization time by 66% at Attaka, yet base decline still erodes national volumes faster than new projects can ramp up. Sustaining 1 million barrels per day (mb/d) thus hinges on continuous infill drilling, EOR pilots, and accelerated tie-backs from satellite fields.
*Our forecasts treat driver/restraint impacts as directional, not additive. The impact forecasts reflect baseline growth, mix effects, and variable interactions.
Segment Analysis
By Sector: Upstream Dominance Drives Market Growth
Indonesia's oil and gas market size for the upstream segment was USD 10.01 billion in 2025, accounting for 72.10% of the overall revenue and projected to grow at a 5.55% CAGR through 2031. Major capital commitments include BP's USD 7 billion Tangguh UCC and Inpex's USD 20 billion Abadi LNG project, signaling durable corporate confidence in long-cycle gas projects. Production-sharing reforms, digital subsurface imaging, and reservoir robotics enhance recovery rates from legacy wells, reinforcing upstream cash flow even as basins mature.
Gross-split PSCs heighten transparency, with cost certainty spurring Chevron's return to the Rapak Block and Harbour Energy's infill campaign at Tuna. Digital asset integrity systems deployed by Pertamina and FPT Software reduced unplanned shutdowns by 15%, demonstrating the operational advantage that AI integration provides. Midstream expansions—new pipelines linking Central Sulawesi to Java—protect evacuation economics, while downstream petrochemical integration at Tuban refinery monetizes heavier crudes into high-margin olefins.



By Location: Offshore Growth Outpaces Onshore Maturity
Onshore operations still accounted for 58.10% of the Indonesian oil and gas market share in 2025; however, offshore CAGRs of 5.92% underscore where incremental barrels are expected to arise. Deep-water wells in the Natuna Sea achieve initial flow rates exceeding 10,000 bbl/d, supported by FPSO units that bypass costly fixed platforms. Abadi FLNG’s subsea-to-shore design reduces surface footprint, complying with stringent maritime spatial directives while reducing project time.
Onshore producers face higher lifting costs and community permitting, prompting Pertamina to ramp up steamflood operations at Duri and pilot polymer floods at Rokan. In contrast, offshore contractors deploy wired drill-pipe telemetry to optimize steerable drilling, thereby reducing the number of days on the well. Environmental stewardship remains stringent, with marine-mammal monitoring and zero-discharge mandates preceding SKK Migas approvals for any subsea tie-back.
By Service: Maintenance Complexity Drives Service Growth
Construction retained 51.60% of the Indonesian oil and gas market share in 2025, as pipeline builds, LNG tanks, and gas-fired power plants required extensive heavy civil works. Yet, maintenance and turn-around services are tipped to grow at a 6.05% CAGR, beating overall output because 70% of wells are classified as mature and demand condition-based servicing. Predictive analytics cut pump failure at Mahakam by 18%, while drones and crawler robots inspect flare stacks without shutdown.
Decommissioning emerges as a niche, with 12 offshore platforms scheduled for retirement by 2030, unlocking USD 300 million in plug-and-abandon contracts. Service providers that couple digital twins with modular well-plugging equipment secure a competitive advantage under strict local-content rules. Real-time collaboration centers in Jakarta liaise with Kalimantan work sites, enabling expert oversight with minimal travel cost and greenhouse emissions.
Geography Analysis
South Sumatra supplies roughly 25% of the nation's crude, leveraging steam-assisted gravity drainage to extend fields that began production in the 1960s. Enhanced recovery boosts recovery factors to 40%, cushioning the natural decline and keeping the Cilacap refinery well-stocked to meet Java’s motor-fuel demand. East Kalimantan’s Mahakam Delta, now a brownfield, still anchors LNG feed-gas volumes for Bontang, though output slipped to 600 MMcf/d in 2025.
The Natuna basin is estimated to hold 200 Tcf of high-CO₂ gas; TCF-level reservoirs, such as East Natuna, remain dormant pending declines in carbon-capture costs and a rise in gas prices. Central Java balances waning onshore liquids with refinery throughput gains, importing sweet crudes and blending with local Naphthenic streams to maximize middle-distillate yield. Papua’s offshore Arafura Sea prospects remain under-tested, hindered by sparse infrastructure and unresolved land tenure. Yet, the government’s new “Ring-Fence” fiscal model offers accelerated depreciation to entice drilling.
Deep-water clusters form Indonesia’s frontier, requiring 2,500-m water-depth capability, dynamic positioning rigs, and subsea trees rated to 15,000 psi. Government marine zoning ensures coexistence with tuna fisheries and coral reef conservation; exploration plans must pass environmental impact assessments that detail oil-spill modeling, waste management, and decommissioning escrow arrangements.
Regulatory Landscape
Indonesia’s oil and gas sector is anchored by Law No. 22/2001, which establishes state control over hydrocarbon resources and separates upstream (hulu) and downstream (hilir) governance. The Ministry of Energy and Mineral Resources (KESDM), through the Directorate General of Oil and Gas, sets policy and supervises sector compliance, while SKK Migas manages upstream contractor oversight and work programs under the production sharing framework.
The fiscal and contractual regime has been updated through the Gross Split PSC framework, formalized under MEMR Regulation No. 13/2024 and detailed through implementation guidance under MEMR Decree No. 230.K/MG.01/MEM.M/2024. This tightens contractor terms for complex plays, including deepwater and higher-CO2 developments. Institutional governance was further strengthened via MEMR Regulation No. 15/2025, which reorganized parts of SKK Migas to bolster internal control functions, and SKK Migas implemented adjustments to NGL reporting in March 2026, a change regulators cited as improving the accounting of national oil lifting.
Competitive Landscape
The Indonesian oil and gas market is moderately concentrated, with Pertamina accounting for approximately 60% of crude and gas output. Chevron, Shell, and ExxonMobil collectively share another 20%, while the remaining balance is split among Medco, Harbour Energy, Jadestone, and independent companies.[4]Indonesia Business Post, “Pertamina Market Share,” indonesiabusinesspost.com Gross-split PSCs reduce bureaucracy, enabling nimble operators to fast-track wildcats and monetization. International majors leverage deep-water expertise and CCUS capabilities for complex reservoirs, co-venturing with local players to meet domestic-content mandates.
Technological race shapes rivalry: Schlumberger's digital-rock study at Abadi accelerates reservoir modeling, Halliburton's smart completions in Natuna raise uptime, and Baker Hughes supplies carbon-capture compressors rated at 250 bar. Pertamina invests heavily in AI, partnering with FPT Software to create a 30,000-sensor IoT mesh that has boosted recovery and reduced downtime by 12% by 2024. The small-scale LNG value chain presents growth opportunities—PGN, a Pertamina affiliate, is rolling out mini-FSRUs, while Chart Industries supplies ISO tanks for trucked LNG to Sumba's mining districts.
Fiscal policy builds protective moats: local-content thresholds of 35% for equipment, in-country fabrication yards for topsides, and mandatory knowledge transfer secure differentiators for incumbents. Environmental credentials are now considered in tender evaluations, with CCS participation, methane-intensity targets, and ESG disclosure influencing license awards.
Indonesia Oil And Gas Industry Leaders
PT Pertamina
Chevron Corporation
Petroliam Nasional Berhad
Exxon Mobil Corporation
PT Medco Energi Internasional Tbk
- *Disclaimer: Major Players sorted in no particular order

Market Opportunities and Future Outlook
A key whitespace is accelerating incremental supply from mature assets and underutilized infrastructure while keeping domestic gas availability aligned with industrial and power demand. This is showing up in upstream brownfield optimization and enhanced recovery, as operators and service providers apply digital asset integrity systems and EOR techniques. In July 2026, Pertamina Hulu Energi (PHE) OSES initiated Indonesia’s first offshore chemical EOR (CEOR) at the Rama Offshore Field, which points to a new offshore EOR service niche beyond traditional onshore programs.
Gas commercialization and LNG-linked value chains also create practical openings, given how existing facilities can shorten lead times. Eni’s May 2026 LNG offtake deals for its Indonesia projects, structured around utilizing existing Bontang LNG infrastructure, indicate a way for new supply hubs to move molecules without waiting for entirely new export systems. On the policy and licensing side, the government’s May 2026 offer of 13 oil and gas blocks in the first 2026 bidding round expands the inventory for IOCs and independents operating under the updated gross-split structure, while SKK Migas’ stated push to bring multiple upstream projects onstream in 2026 supports near-term contracting for drilling, well services, and tie-in work.
Recent Industry Developments
- July 2026: PT Pertamina Hulu Energi (PHE) OSES initiated Indonesia’s first offshore Chemical Enhanced Oil Recovery (CEOR) program at the Rama Offshore Field in the Southeast Sumatra Working Area. The initiative extends EOR from predominantly onshore applications into offshore operations, creating demand for specialty chemicals, injection engineering, and offshore production optimization services.
- May 2026: The Indonesian government offered 13 oil and gas blocks in the first bidding round of 2026, with authorities disclosing an estimated resource potential of 16 billion barrels of oil and 81 trillion cubic feet of gas across the package. The offering expands the near-term pipeline for exploration and appraisal activity and reinforces the role of the gross-split contracting environment in attracting new capital and technical capability.
- November 2024: BP green-lit the USD 7 billion Tangguh UCC project, combining an 11.4 MTPA liquefaction expansion with a CCUS hub designed for 2.5 million t/y of CO2 injection. This decision strengthened Indonesia’s long-cycle gas investment case while embedding carbon management into an LNG growth project, shaping contractor opportunities across LNG trains, compression, and CO2 handling systems.


Research Methodology Framework and Report Scope
Market Definition and Coverage
For this report, the Indonesia oil and gas market is sized as the value generated from upstream, midstream, and downstream oil and gas activity within Indonesia, captured through a consistent set of operational and project indicators.
Scope exclusions: We do not count broader power utilities, general mining, or pure petrochemicals that are not directly tied to oil and gas production, transport, storage, refining, or fuel distribution.
Segmentation Overview
- By Sector
- Upstream
- Midstream
- Downstream
- By Location
- Onshore
- Offshore
- By Service
- Construction
- Maintenance and Turn-around
- Decommissioning
Data Sources, Market Sizing, and Validation
Desk Research
Desk research started with public production and activity signals that can be checked year by year, and then these were mapped to Indonesia specific assets and policy announcements. We relied on sources such as Ministry of Energy and Mineral Resources releases, SKK Migas updates, and Statistics Indonesia (BPS) series for energy and industry output.
To keep assumptions grounded, we also reviewed materials such as international energy agencies, OPEC style statistical tables, customs and trade statistics where relevant, and peer reviewed papers that discuss Indonesian basins and recovery methods. Company filings, investor presentations, and reputable press coverage were used to cross check timelines for large LNG and upstream developments. For a few hard to pin items like corporate financial context, patents, and shipment signals, paid subscriptions for company intelligence and an import or export shipment level database were used as supporting checks. The sources listed here are illustrative only, and many additional public documents and articles were used for data collection, validation, and clarification.
Primary Interviews and Surveys
Primary work was used to test what the desk research could not confirm cleanly, especially project timing, utilization, and how quickly cost and pricing assumptions were changing. We spoke with a mix of upstream operators and contractors, midstream infrastructure participants, and downstream stakeholders, then balanced the feedback across Indonesia and the main operating basins and demand centers to reduce any single view of activity.
Distribution of primary research fieldwork respondents
| Company type | Respondent position |
|---|---|
| Top tier: 33% | CXOs: 12% |
| Mid tier: 49% | Functional/Unit leaders: 36% |
| Smaller Players: 18% | Managers: 52% |
Market-Sizing & Forecasting
Sizing was built using a top-down approach that reconstructs the Indonesia demand pool from sector activity, then ties it to spend and value realization across upstream, midstream, and downstream. After shaping the country level totals, we corroborated them with selective bottom-up checks such as sampled project spend, a few supplier and contractor roll ups, and simple ASP x volume tests where public volumes exist.
Key inputs in the model included crude oil and natural gas production trends, LNG project and terminal build timelines, onshore versus offshore activity mix, refining and fuel distribution throughput indicators, and a project pipeline view for construction, maintenance and turn-around, and decommissioning work. Where bottom-up inputs were incomplete, gaps were handled through ratio based benchmarks anchored to comparable project types in Indonesia, followed by re-checks in interviews so the assumptions stayed realistic.
For forecasting, scenario analysis was used with a base case that reflects policy direction and project schedules discussed by experts, then stress tested using sensitivities on commodity price ranges, development delays, and utilization changes. Final outputs were kept in USD using consistent currency timing across the historical and forecast years so the trend is not distorted by conversion noise.
Data Validation & Update Cycle
Outputs were validated through triangulation across independent signals, and then each large variance was traced back to one or two drivers so it could be explained and fixed. When results did not line up with known production, throughput, or project milestone patterns, assumptions were revisited, and targeted re-contacts were triggered with relevant participants.
Before sign-off, the model and write-up go through multi-step analyst reviews, including reasonableness checks across sector splits, location splits, and services coverage. Reports are refreshed annually, and interim updates are made when material events occur, such as major project sanctions, policy changes, or sharp shifts in activity. Right before delivery, a final pass is completed so clients receive the latest updated view.
Mordor Intelligence's Indonesia Oil and Gas Market Size Compared Against Other Published Estimates
It is normal to see different published market sizes for Indonesia oil and gas, even when studies focus on the same country. Most gaps come from how each study sets its scope across upstream, midstream, and downstream, and then how it converts activity into USD over the chosen base year.
Some external figures only capture a narrow slice of oil and gas spending, or they apply pricing progressions that are not anchored to production, throughput, and project milestone checks. In the split that keeps totals consistent, Mordor Intelligence counts upstream, midstream, and downstream together and excludes stand-alone petrochemicals and broader power activity, which can result in a lower number versus other sources.
Benchmark comparison
| Source | Market Size | Gaps in Research Methodology |
|---|---|---|
| Mordor Intelligence | USD 13.88 B (2025) | |
| Industry Publisher A | USD 0.76 B (2025) | This estimate appears to capture a much narrower spend pool, which can happen when only selected oil and gas activities or specific regional pockets are counted, and when price translation to USD is applied more conservatively. |
| Sector Research House B | USD 14.80 B (2026) | This figure focuses on upstream only, and it is stated for 2026 rather than the 2025 base year, so differences can be driven by sector coverage and by the year chosen for currency and activity assumptions. |
The table shows that scope choices and the year used for USD conversion explain most of the spread, more than any single data point. By tying totals back to production, throughput, and the project pipeline, the final number stays traceable and can be repeated when assumptions are updated.


Key Questions Answered in the Report
How large is the Indonesia oil and gas market in 2026?
The Indonesia oil and gas market size is valued at USD 14.6 billion in 2026 and is projected to grow 5.18% CAGR to 2031.
Which segment leads sector-wise revenue?
Upstream activities dominate with 72.10% share in 2025, supported by new field developments and enhanced recovery projects.
What is driving offshore investment in Indonesia?
Deep-water discoveries, favorable gross-split PSC terms, and FPSO adoption push offshore growth at a 5.92% CAGR through 2031.
Why is Pertamina central to Indonesia’s energy sector?
Pertamina holds about 60% of national oil and gas output, operates refineries, and spearheads digital and CCUS initiatives to extend field life.
How is Indonesia balancing LNG exports with domestic demand?
While legacy plants feed North-East Asia, small-scale LNG infrastructure backed by USD 1.5 billion in funding is diverting gas to remote domestic markets.
What role does CCUS play in Indonesia’s future production?
Projects like BP’s Tangguh UCC integrate 2.5 million t/y CO₂ storage, enhancing mature-field economics and aligning with net-zero commitments.
Page last updated on:


 Your data is secure and never sold or shared.


