Indium Market Size and Share
Market Overview
| Study Period | 2021 - 2031 |
|---|---|
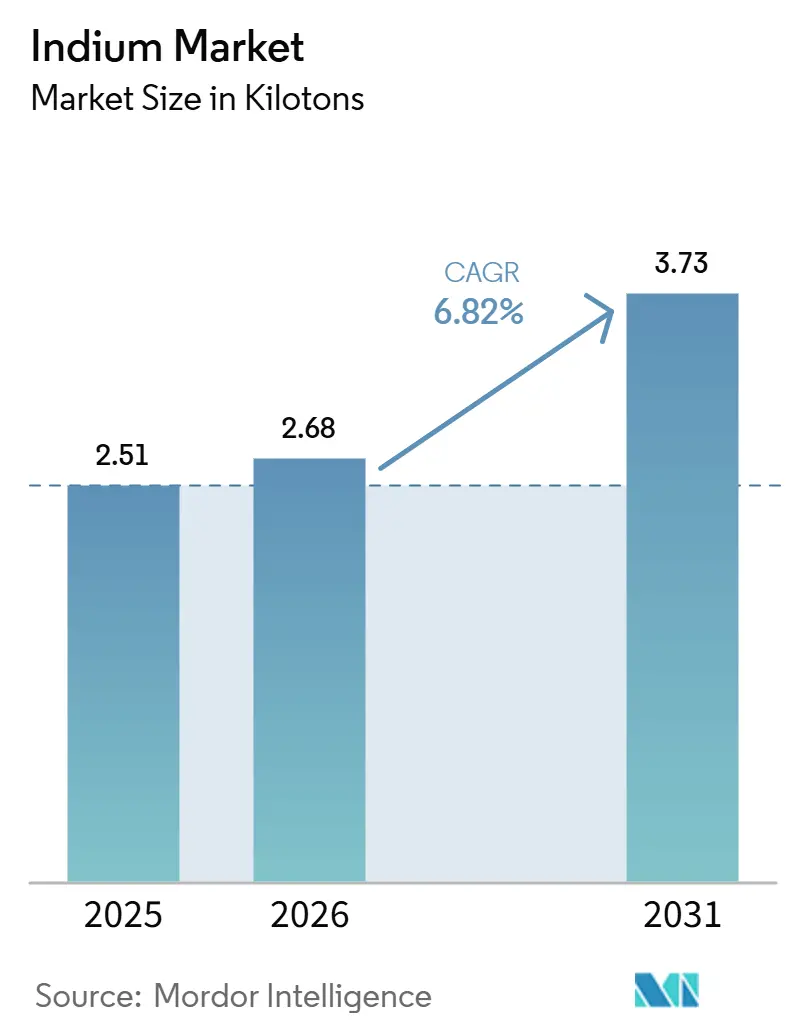
| Market Volume (2026) | 2.68 kilotons |
| Market Volume (2031) | 3.73 kilotons |
| Growth Rate (2026 - 2031) | 6.82% CAGR |
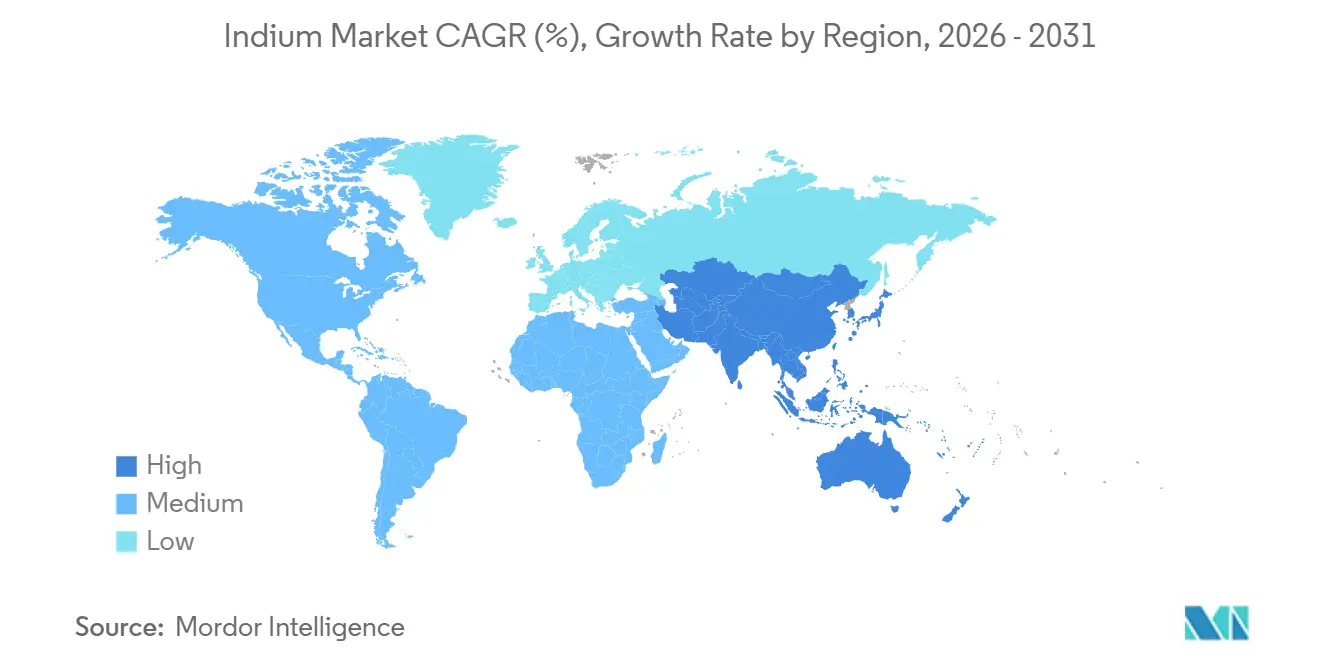
| Fastest Growing Market | Asia Pacific |
| Largest Market | Asia Pacific |
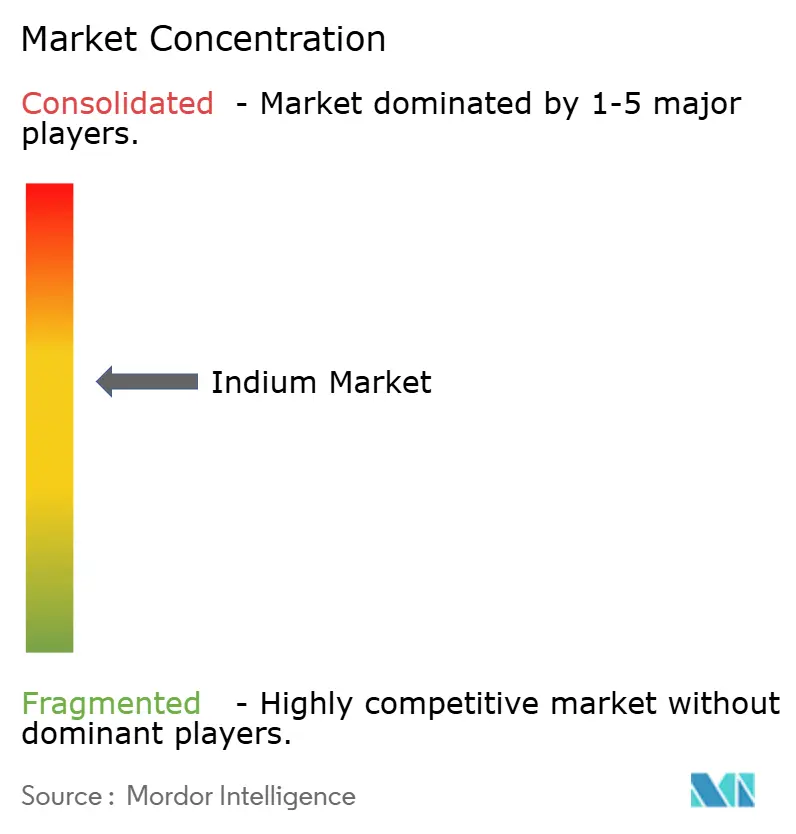
| Market Concentration | Medium |
Major Players *Disclaimer: Major Players sorted in no particular order Image © Mordor Intelligence. Reuse requires attribution under CC BY 4.0. | |
Indium Market Analysis by Mordor Intelligence
The Indium Market size is projected to be 2.51 kilotons in 2025, 2.68 kilotons in 2026, and reach 3.73 kilotons by 2031, growing at a CAGR of 6.82% from 2026 to 2031. Intensifying demand for next-generation flexible displays, high-efficiency CIGS and tandem solar cells, and low-temperature indium alloys in advanced semiconductor packaging is fueling this expansion. Policy-driven strategic stockpiling in Europe and North America provides a demand floor, while Chinese export licensing instituted in February 2025 tightened spot availability and widened the Rotterdam-to-Shanghai price gap. Supply remains largely tethered to zinc-smelting by-products, creating a structural reliance on a handful of vertically integrated refiners. Secondary-recovery investments and novel extraction chemistries are emerging as pivotal enablers that may relieve primary-supply constraints by the end of the decade.
Key Report Takeaways
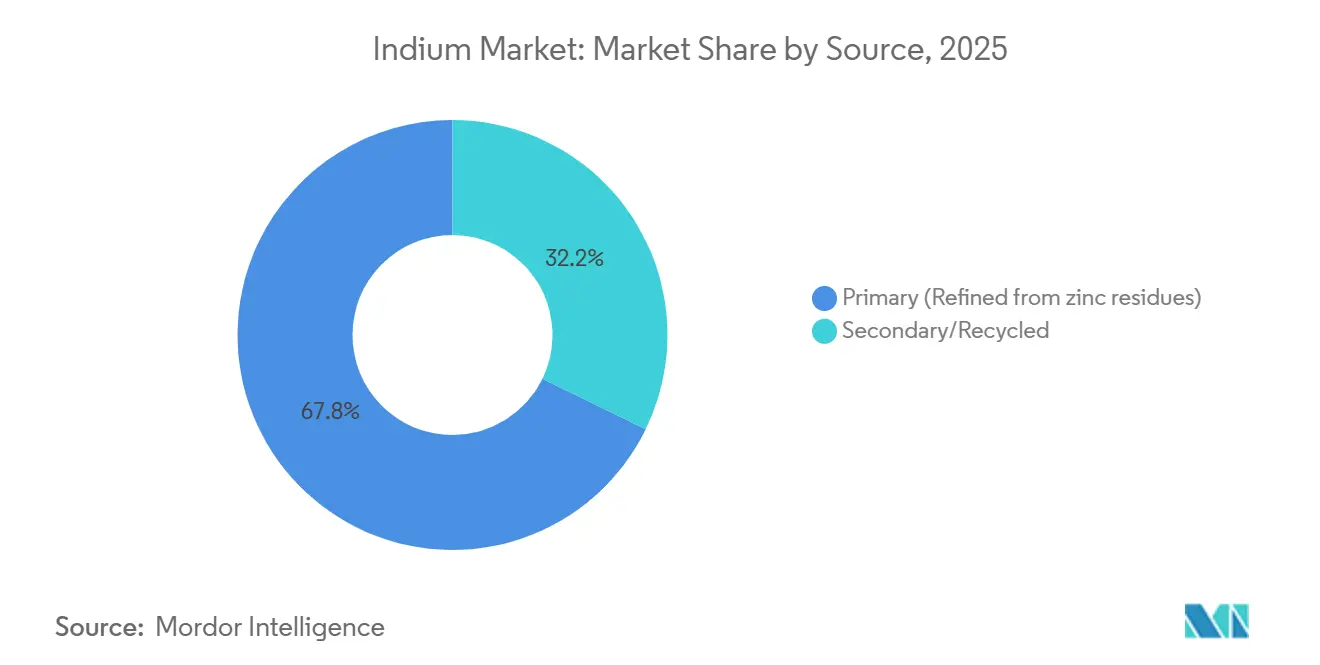
- By source, primary (refined from zinc residues) captured 67.78% of the indium market share in 2025, while secondary/recycled is forecast to expand at a 7.22% CAGR through 2031.
- By form, high-purity indium compounds (InP, InSb, and InAs) led with 45.22% revenue share in 2025; the same category is projected to grow at a 7.03% CAGR to 2031.
- By application, flat-panel and flexible displays accounted for 58.89% of the indium market size in 2025, whereas Photovoltaics (CIGS and Perovskite) is advancing at a 7.22% CAGR over 2026-2031.
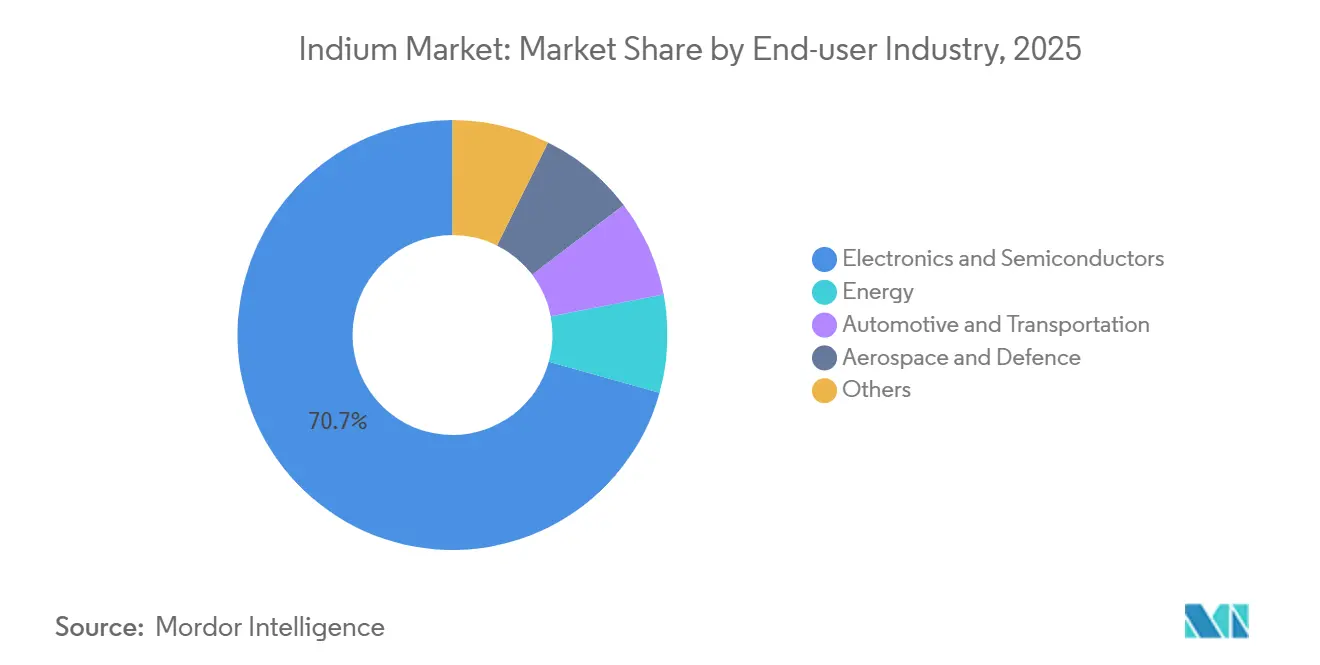
- By end-user industry, electronics and semiconductors dominated with 70.67% share in 2025, while the energy segment posts the fastest 7.11% CAGR to 2031.
- By geography, the Asia Pacific region represented 48.66% of the indium market in 2025 and also exhibits the highest 7.43% CAGR during the forecast period (2026-2031).
Note: Market size and forecast figures in this report are generated using Mordor Intelligence’s proprietary estimation framework, updated with the latest available data and insights as of January 2026.
Global Indium Market Trends and Insights
Drivers Impact Analysis*
| Driver | (~) % Impact on CAGR Forecast | Geographic Relevance | Impact Timeline |
|---|---|---|---|
| Growing usage of ITO in next-gen flexible and foldable displays | +1.2% | Global, with concentration in Asia Pacific (Korea, China display fabs) and spillover to North America | Medium term (2-4 years) |
| Expansion of low-temperature indium alloys in advanced packaging and heterogeneous integration | +0.9% | Global, led by Asia Pacific (Taiwan, Korea foundries), North America (AI data-center builds) | Medium term (2-4 years) |
| Critical-raw-material resilience policies boosting European strategic stockpiles | +0.8% | Europe (Italy, France, Germany leading), North America (U.S. Defense Logistics Agency) | Long term (≥ 4 years) |
| Increasing production of high-efficiency solar panels globally | +1.1% | Global, with Asia Pacific (China CIGS lines), North America (First Solar Ohio/Alabama), Europe (tandem-cell pilots) | Medium term (2-4 years) |
| Demand surge for InGaN micro-LEDs in AR/VR headsets | +1.0% | Global, concentrated in Asia Pacific (epitaxy fabs: Ennostar, HC SemiTek, Sanan), North America (Lumentum, Porotech partnerships) | Long term (≥ 4 years) |
| Source: Mordor Intelligence | |||
Growing Usage of ITO in Next-Gen Flexible and Foldable Displays
Flexible OLED (Organic Light Emitting Diode) and foldable smartphone panels continue to favor ITO (Indium Tin Oxide) for its unmatched transparency and conductivity. Low-temperature sputtering and post-annealing now hold sheet resistance below 15 Ω/sq at bend radii under 5 mm, raising indium intensity per panel as multilayer stacks proliferate[1]IEEE Transactions on Electron Devices, “Low-Temperature Sputtered ITO Films for Flexible Electronics,” IEEE, ieee.org. Samsung Display and BOE (Beijing Oriental Electronics) each ramped Gen-6 AMOLED (Active-Matrix Organic Light-Emitting Diode) lines in 2025 that consume about 20-30% more ITO target material than rigid equivalents. Adoption of ITZO (Indium-Tin-Zinc Oxide) and ITO-silver mesh architectures in premium tablets and automotive center-information displays drives an additional 5-8% indium uptake to suppress crystallization at low process temperatures. Foldable-device shipments are expected to triple between 2025 and 2028, implying 80-100 tons of incremental annual indium demand if current utilization rates persist.
Expansion of Low-Temperature Indium Alloys in Advanced Packaging and Heterogeneous Integration
Flip-chip ball-grid arrays and large-body AI accelerator packages adopt indium and indium-silver thermal interface materials that reach thermal conductivities of 71-86 W/m·K while surviving 1,000 thermal cycles[2]Amkor Technology, “Indium Alloy TIM Reliability Study,” Amkor, amkor.com. SAC-In solders lower reflow temperatures by 15-20°C, mitigating warpage in complex chiplet assemblies. Foundries expect indium-based micro-bump bonding to reach 40-50 tons of annual demand by 2028 as 2.5D and 3D stacks proliferate. Intel and TSMC roadmaps highlight low-temperature bonding as a yield enabler, indirectly validating this consumption outlook.
Critical-Raw-Material Resilience Policies Boosting European Strategic Stockpiles
The European Union (EU) Critical Raw Materials Act mandates 10% domestic extraction, 40% processing, 25% recycling, and 65% diversified sourcing for indium by 2030. Italy allocated EUR 450 million (USD 508.7 million) in 2025 to create a 200-ton strategic reserve, while the U.S. Defense Logistics Agency issued a USD 125 million RFP for stockpile replenishment. These policies lock in structural demand that is decoupled from consumer cycles, setting a price floor and encouraging Western refiners to restart mothballed capacity.
Increasing Production of High-Efficiency Solar Panels Globally
CIGS and perovskite-CIGS tandem cells reached 30.71% laboratory efficiency in 2025, well ahead of crystalline silicon limits. First Solar is scaling thin-film capacity toward 14 GW in 2026, and China’s Hanergy and CNBM together operate about 2 GW of CIGS nameplate lines. Each gigawatt of CIGS capacity consumes 8-10 tons of indium, depending on absorber thickness, and tandem architectures are unlikely to curb total metal consumption before 2031.
Restraints Impact Analysis*
| Restraint | (~) % Impact on CAGR Forecast | Geographic Relevance | Impact Timeline |
|---|---|---|---|
| Availability of alternative transparent conductors (graphene, Ag-NW, CNT, and IGZO) | -0.6% | Global, with early adoption in North America and Europe (flexible electronics, wearables) | Medium term (2-4 years) |
| Chronic occupational-health concerns driving stricter exposure limits | -0.4% | Global, led by Japan (0.0003 mg/m³ respirable limit), EU (REACH candidate list), North America (NIOSH recommendations) | Long term (≥ 4 years) |
| ESG-driven decarbonization pressure on indium recovery smelters | -0.3% | Global, concentrated in Asia Pacific (China, India zinc smelters), Europe (Nyrstar, Umicore operations) | Long term (≥ 4 years) |
| Source: Mordor Intelligence | |||
Availability of Alternative Transparent Conductors (Graphene, Ag-NW, CNT, IGZO)
U.S. tariffs on Chinese indium compounds, in place since 2025, boosted the adoption of graphene and silver-nanowire films in North America and Europe. Cambrios and C3Nano products now reach sub-10 Ω/sq resistances at over 90% transmittance on flexible substrates. Graphene oxide reduced by laser annealing offers superior mechanical compliance, though costs remain three to five times higher than sputtered ITO. IGZO (Indium Gallium Zinc Oxide) backplanes eliminate a separate transparent-conductor layer, cutting indium usage per panel by up to 20%. Market share of these alternatives is likely to plateau near 15 % by 2031 because display fabs rely on entrenched ITO process flows.
Chronic Occupational-Health Concerns Driving Stricter Exposure Limits
Japan reduced its respirable indium limit to 0.0003 mg/m³ in 2025, 300-fold stricter than the U.S. OSHA (Occupational Safety and Health Administration) threshold, after documented pulmonary-alveolar-proteinosis cases. European Chemicals Agency added indium phosphide to the REACH (Registration, Evaluation, Authorisation and Restriction of Chemicals) Candidate List in 2024, triggering authorization for imports. Compliance costs for mid-sized target manufacturers run USD 50,000-200,000 per line each year, which discourages new market entrants and slows capacity additions.
*Our forecasts treat driver/restraint impacts as directional, not additive. The impact forecasts reflect baseline growth, mix effects, and variable interactions.
Segment Analysis
By Source: Recycled Flows Gain Share Amid Primary-Supply Constraints
Primary output supplied 67.78% of the Indium market size in 2025, but growth is capped by plateauing zinc-mine grades and fresh Chinese export licensing. Korea Zinc’s USD 7.4 billion Tennessee complex will be the first large-scale Western Hemisphere addition in two decades, yet commissioning will not start before 2029. Secondary supply is accelerating with 268% year-on-year gains reported in China, and global recovery yields approaching 15%. Indium Corporation, DOWA, and Mitsui Kinzoku now guarantee 90% reclaim rates on spent sputtering targets, signaling that circular-economy premiums are becoming mainstream.
Secondary/Recycled volumes are forecast to expand at a 7.22% CAGR during the forecast period (2026-2031), a rate twice that of primary material, and could touch 50-60% recovery efficiency by 2031. Basel Convention controls on e-waste exports and extended-producer-responsibility schemes in the EU and California funnel more scrap to licensed refiners. If Sverdrup’s modeled 200-300 tons potential is realized, recycled flows would meet roughly one-fifth of forecast demand, easing pressure on the Indium market size while lowering life-cycle emissions.


By Form: High-Purity Compounds Lead on Optoelectronics Momentum
High-purity indium compounds held 45.22% of the indium market share in 2025 and are tracking a 7.03% CAGR through 2031, buoyed by surging demand for InP lasers, InGaAs photodetectors, and InSb infrared arrays. Lumentum’s 240,000 sq ft Greensboro fab begins ramping six-inch InP wafers in 2028, creating a steady pull for 6N-7N feedstock. Imec’s Smart Cut wafer-reclaim platform expects to reduce substrate losses by a factor of ten, moderating long-run metal intensity.
Ingot, stick, and alloy segments remain tied to zinc economics and trade closely with LME zinc, whereas compound prices reflect semiconductor clean-room purity premiums of 30-50%. Indium-silver alloys that deliver up to 86 W/m·K are gaining share in AI accelerator thermal management. The bifurcated pricing landscape underscores how specialized optoelectronics keep the Indium market insulated from purely cyclical metals swings.
By Application: Photovoltaics Outpace Displays Despite Smaller Base
Flat-panel and flexible displays still account for 58.89% of the Indium market size, yet photovoltaics (CIGS and Perovskite) are expected to register the fastest adoption curve at a 7.22% CAGR for the forecast period (2026-2031). Each new gigawatt of CIGS capacity triggers 8-10 tons of incremental indium needs, and Chinese lines already total approximately 2 GW. While perovskite-on-CIGS architectures aim to cut absorber thickness, rapid module-volume growth will keep net metal demand rising through 2031.
Semiconductor and optoelectronic devices form the next-largest bucket, driven by photonics for data-center links and LiDAR. Solders and thermal interface materials follow, thanks to chiplet and 3D package builds that require low-temperature alloys. Niche uses, quantum dots, cryogenic seals, and quantum-computing nanowires command high unit values, helping stabilize overall Indium market revenues during electronics slowdowns.
By End-user Industry: Energy Sector Closes Gap on Electronics Dominance
Electronics and semiconductors absorbed 70.67% of the indium market in 2025, but the energy sector is growing faster at 7.11% CAGR to 2031. Utility-scale solar procurements totaling 180 GW in 2025 include an 8% share for CIGS and tandem projects, and that slice may double by 2028. The automotive sector is layering in indium through advanced driver-assistance LiDAR (light detection and ranging) modules and OLED cockpit displays, and aerospace relies on InSb focal-plane arrays for thermal imaging.
Defense clients value indium for high-reliability seals and specialty solders, often paying five-to-ten-fold premiums per kilogram. Medical imaging, quantum research, and other small niches deepen the customer base and reduce the risk that any one segment will dictate pricing.

Geography Analysis
Asia Pacific controlled 48.66% of Indium market size in 2025 and will maintain the fastest regional expansion at 7.43% CAGR to 2031. China accounts for the majority of refined output, while Korea Zinc’s domestic smelting and Yunnan Tin’s breakthroughs in ITO targets solidify supply leadership. Japan’s DOWA and Mitsui Kinzoku focus on high-purity and recycled streams, which shield them from zinc-price volatility.
North America is shifting from a pure importer to a partial producer. Korea Zinc’s Clarksville complex, operational from 2029, and Lumentum’s InP laser fab will together anchor a secure regional supply chain. Section 301 duties on Chinese indium compounds, effective net rates near 54%, further encourage domestic sourcing.
Europe’s Critical Raw Materials Act compels 10% extraction and 40% processing within the bloc, leading Italy to budget EUR 450 million (USD 508.7 million) for a 200-ton national reserve. Imec’s NanoIC pilot line, opened in February 2026, adds downstream pull for 7N indium compounds. South America and the Middle East-Africa together remain below 10% of volume, but idle zinc assets in Brazil and South Africa represent a callable swing capacity should prices stay above USD 500 kg.

Competitive Landscape
The Indium market is moderately consolidated. Regulation indirectly shapes rivalry. REACH candidate-list status for indium phosphide elevates compliance costs, favoring incumbents with audited chain-of-custody systems. Section 301 tariffs in the United States safeguard domestic producers by lifting the landed costs from China. Over the medium term, the balance of power will edge toward vertically integrated recyclers and alloy formulators that can offer assured, low-carbon, traceable supply.
Indium Industry Leaders
DOWA HOLDINGS CO., LTD.
KOREAZINC
Nyrstar
Guangxi Debang Technology Co., Ltd.
Umicore
- *Disclaimer: Major Players sorted in no particular order

Recent Industry Developments
- March 2026: Metallium Limited's U.S. subsidiary, Flash Metals USA Inc., signed a long-term offtake agreement with Indium Corporation. Under this deal, Flash Metals USA will supply recovered metals, including gallium, germanium, copper, tin, gold, and indium, from Metallium's U.S. recycling operations.
- March 2025: Indium Corporation showcased advanced materials driving AI technology innovation at Productronica China. The highlights included Solder Thermal Interface Materials and Heat-Spring solutions, both utilizing indium's beneficial properties, significantly contributing to the growth of the indium market.


Global Indium Market Report Scope
Indium (atomic number 49) is a soft, malleable, silvery-white post-transition metal renowned for its use in electronics, particularly as Indium Tin Oxide (ITO) for touchscreens and Liquid-crystal displays (LCDs).
The indium market is segmented by source, form, application, end-user industry, and geography. By source, the market is segmented into primary (refined from zinc residues) and secondary/recycled. By form, the market is segmented into indium ingot and stick, indium alloy (In-Sn, In-Ag, In-Ga), indium oxide/ITO sputtering target, and high-purity indium compounds (InP, InSb, and InAs). By application, the market is segmented into flat-panel and flexible displays, photovoltaics (CIGS and perovskite), semiconductor and optoelectronic devices, solders and thermal interface materials, and others (nanotechnology, research). By end-user industry, the market is segmented into electronics and semiconductors, energy, automotive and transportation, aerospace and defence, and others. The report also covers the market size and forecasts for indium in 17 countries across major regions. The market sizes and forecasts are provided in terms of volume (tons).
| Primary (Refined from zinc residues) |
| Secondary/Recycled |
| Indium Ingot and Stick |
| Indium Alloy (In-Sn, In-Ag, In-Ga) |
| Indium Oxide/ITO Sputtering Target |
| High-purity Indium Compounds (InP, InSb, and InAs) |
| Flat-Panel and Flexible Displays |
| Photovoltaics (CIGS and Perovskite) |
| Semiconductor and Optoelectronic Devices |
| Solders and Thermal Interface Materials |
| Others (Nanotechnology, Research) |
| Electronics and Semiconductors |
| Energy |
| Automotive and Transportation |
| Aerospace and Defence |
| Others |
| Asia Pacific | China |
| Japan | |
| South Korea | |
| India | |
| Rest of Asia Pacific | |
| North America | United States |
| Canada | |
| Mexico | |
| Europe | Germany |
| United Kingdom | |
| France | |
| Italy | |
| Spain | |
| Russia | |
| Rest of Europe | |
| South America | Brazil |
| Argentina | |
| Rest of South America | |
| Middle-East and Africa | Saudi Arabia |
| South Africa | |
| Rest of Middle-East and Africa |
| By Source | Primary (Refined from zinc residues) | |
| Secondary/Recycled | ||
| By Form | Indium Ingot and Stick | |
| Indium Alloy (In-Sn, In-Ag, In-Ga) | ||
| Indium Oxide/ITO Sputtering Target | ||
| High-purity Indium Compounds (InP, InSb, and InAs) | ||
| By Application | Flat-Panel and Flexible Displays | |
| Photovoltaics (CIGS and Perovskite) | ||
| Semiconductor and Optoelectronic Devices | ||
| Solders and Thermal Interface Materials | ||
| Others (Nanotechnology, Research) | ||
| By End-user Industry | Electronics and Semiconductors | |
| Energy | ||
| Automotive and Transportation | ||
| Aerospace and Defence | ||
| Others | ||
| By Geography | Asia Pacific | China |
| Japan | ||
| South Korea | ||
| India | ||
| Rest of Asia Pacific | ||
| North America | United States | |
| Canada | ||
| Mexico | ||
| Europe | Germany | |
| United Kingdom | ||
| France | ||
| Italy | ||
| Spain | ||
| Russia | ||
| Rest of Europe | ||
| South America | Brazil | |
| Argentina | ||
| Rest of South America | ||
| Middle-East and Africa | Saudi Arabia | |
| South Africa | ||
| Rest of Middle-East and Africa | ||


Key Questions Answered in the Report
How large is the Indium market today and where will it be in 2031?
The Indium market size is 2.68 kilotons in 2026 and is projected to reach 3.73 kilotons by 2031, reflecting a 6.82% CAGR.
Which segment leads Indium demand?
Electronics and semiconductors hold 70.67% of demand, driven by ITO displays and InP photonics.
Which region dominates Indium supply?
Asia Pacific supplies nearly half of global volume, with China alone refining about 70% of the total.
Will recycling meaningfully offset primary Indium shortages?
Yes, improved reclaim technologies could lift recovery rates toward 50-60% by 2031, adding up to 300 tons of annual supply.
Page last updated on:


