
Chromium Market Size and Share
Market Overview
| Study Period | 2020 - 2031 |
|---|---|
| Market Volume (2026) | 46.61 kilotons |
| Market Volume (2031) | 56.33 kilotons |
| Growth Rate (2026 - 2031) | 3.86 % |
| Fastest Growing Market | Asia-Pacific |
| Largest Market | Asia-Pacific |
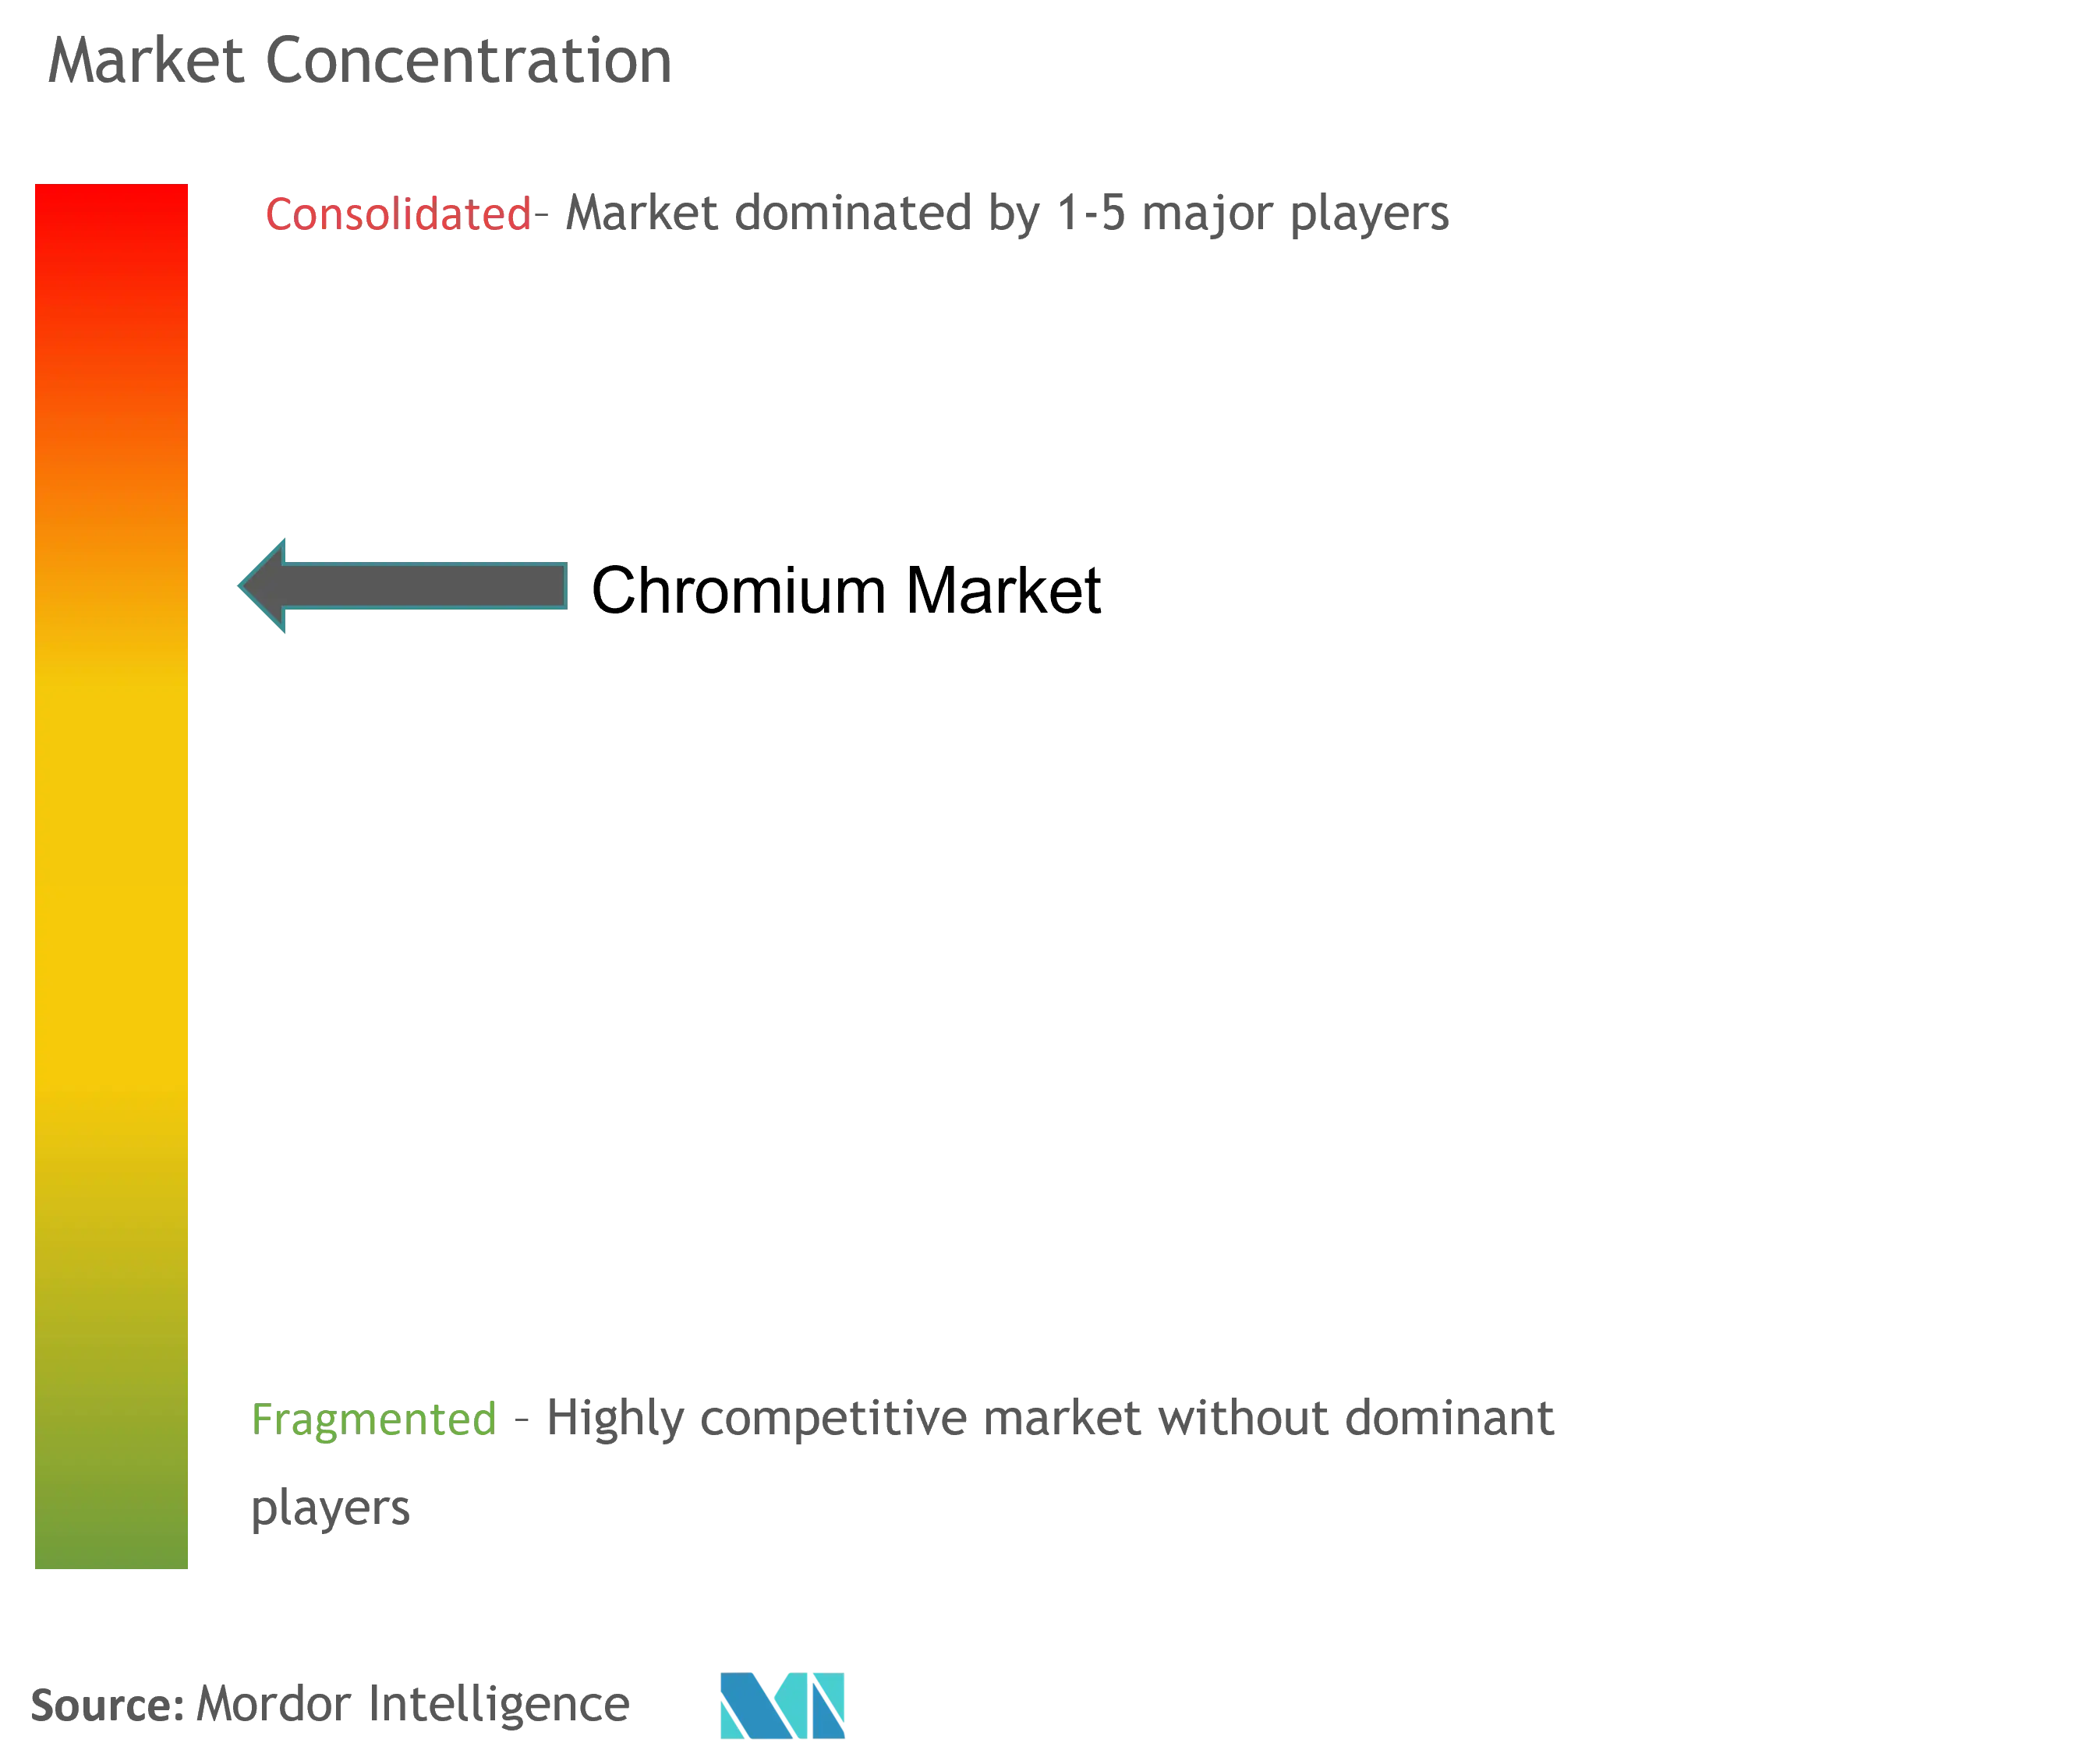
| Market Concentration | Medium |
Major Players *Disclaimer: Major Players sorted in no particular order Image © Mordor Intelligence. Reuse requires attribution under CC BY 4.0. | |
Chromium Market Analysis by Mordor Intelligence
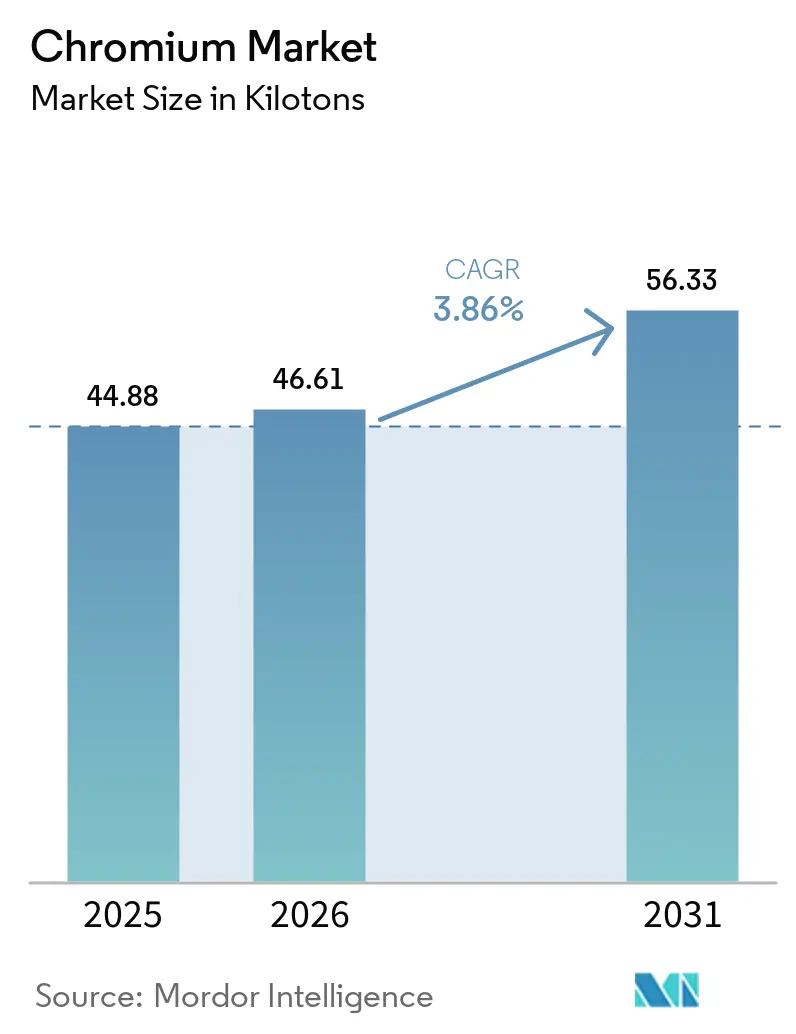
The Chromium Market size was valued at 44.88 kilotons in 2025 and estimated to grow from 46.61 kilotons in 2026 to reach 56.33 kilotons by 2031, at a CAGR of 3.86% during the forecast period (2026-2031).
The COVID-19 pandemic had a big effect on the chromium market because of the global restrictions on the auto, building, and construction industries. However, since 2021, industries have grown, and the market is expected to do the same during the forecast period.
- Over the medium term, the growing demand for metallurgical uses and increasing refractory applications in industries are expected to drive market growth.
- However, exposure to chromium can cause health and environmental effects, which are expected to hinder market growth.
- In the coming years, the development of the trivalent chromium hard chrome plating process is likely to lead to market growth.
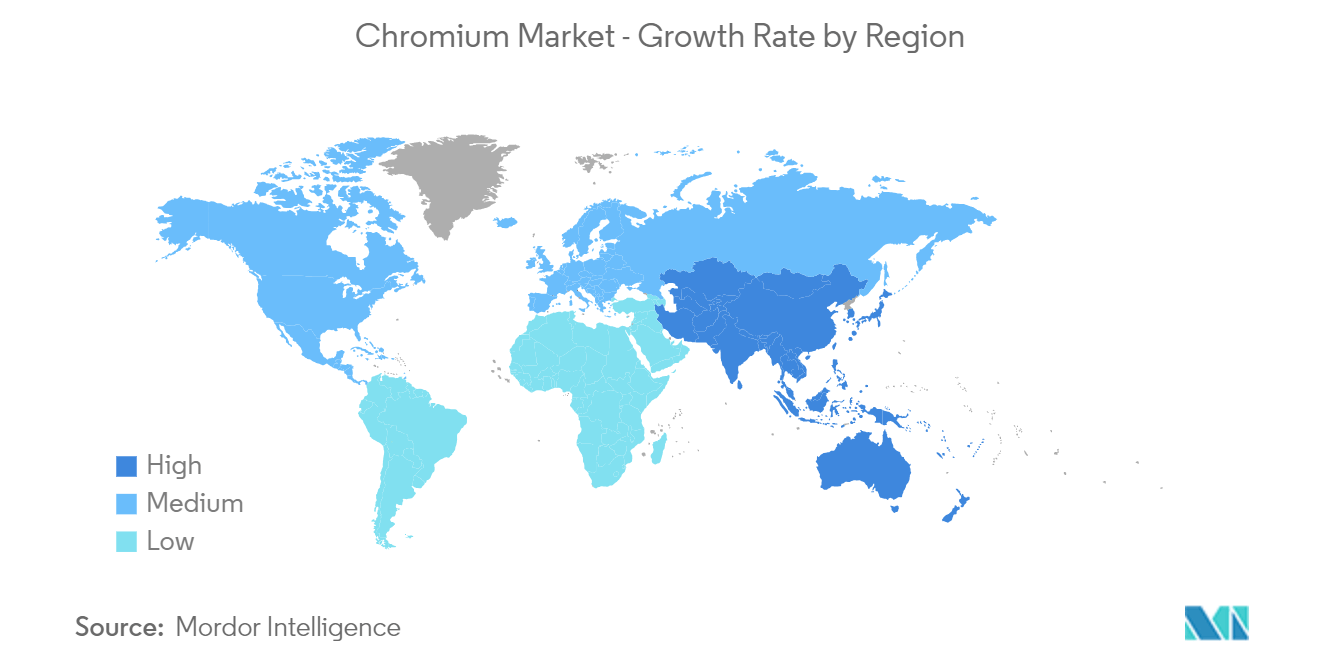
- Asia-Pacific has led the market for the past few years, and it is also expected to register the highest CAGR during the forecast period.
Note: Market size and forecast figures in this report are generated using Mordor Intelligence’s proprietary estimation framework, updated with the latest available data and insights as of 2026.
Global Chromium Market Trends and Insights
Metallurgical Applications to Witness Growth in Future
- Chromium is being utilized in metallurgical processes to improve its hardenability, impact strengths, resistance to corrosion, oxidation to other metals, and many other properties for use in heavy machinery, the construction sector, and other applications.
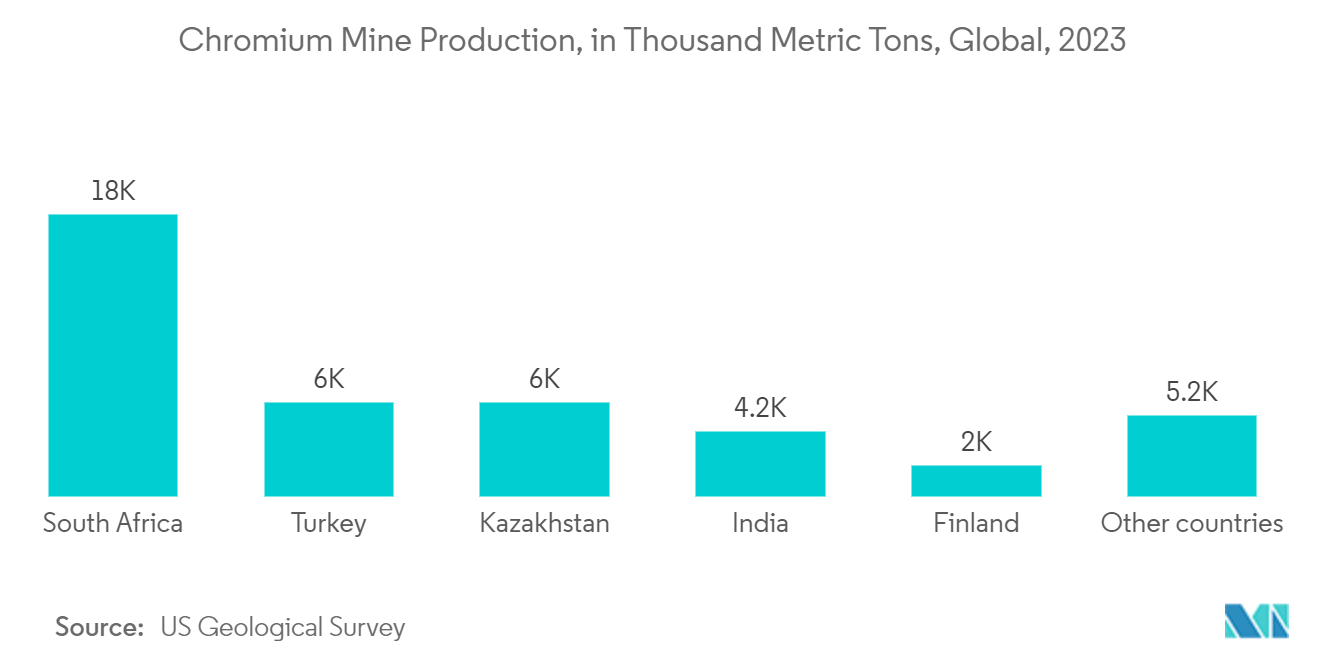
- According to the US Geological Survey, roughly 41 million metric tons of chromium were produced globally from mines in 2023. With around 45% of the total production, South Africa accounted for the majority share (18 million metric tons).
- It is an important part of making stainless steel because, even when heated to very high temperatures, it keeps its hardening and corrosion-resistant properties. In the same way, chromium is used to make aluminum stronger and more durable and to keep its shape when heated at high temperatures.
- According to the World Steel Association, global crude steel production in 2023 reached 1,849.7 million tons, registering a growth of about 1% compared to 1,831.5 million tons in 2022. It is further expected to increase during the forecast period.
- The most significant quantity of steel globally is produced in Asia-Pacific, particularly in countries like China, Japan, and India. China is also projected to remain the largest consumer of iron and steel. The country's production of crude steel is likely to increase during the forecast period, owing to the recovery in consumption.
- Crude steel production in North America was 109.6 million tons in 2023, increasing by 5.3% compared to 2022. The United States produced 80.7 million tons in 2022, increasing by 7.6% from 2022.
- In metallurgical processes, mixing chromium with other metals can help make important parts for commercial and military aircraft engines, such as stainless steel tankers, acids, and bulk hopper trailers used to move fertilizers and other materials that absorb water.
- In the auto industry, chromium is mostly used for automotive chromium finishing, electroplating, and conversion coatings on the outside and inside of car parts. According to the International Organization of Motor Vehicle Manufacturers (OICA), in 2022, around 85.01 million vehicles were produced across the globe, witnessing a growth rate of 5.99% compared to 80.20 million vehicles in 2021.
- In North America, according to the OICA, automotive production in 2022 accounted for 14,798,146 units, an increase of 9.88% compared to that in 2021, which was reportedly 13,467,065 units. Additionally, in North America, the sales of electric vehicles in 2022 accounted for 1,108 thousand units, compared to 748 thousand unit sales in 2021.
- Therefore, a rise in the number of vehicles manufactured, along with demand in the steel manufacturing industry, is expected to fuel the market demand for chromium.


Asia-Pacific Region to Dominate the Market
- Asia-Pacific is likely to be the biggest market in the world. This is because China, India, and other parts of the region have very well-developed manufacturing sectors, and the metallurgical industry is increasing its demand.
- Asia-Pacific uses more chromium to make stainless steel than any other region. This is because stainless steel is becoming more important in every manufacturing sector around the world.
- According to the World Steel Association, Asia produced 1,367.2 million tons of crude steel in 2023, an increase of 0.7% compared to 2022.
- China's crude steel production in 2023 reached 1,019.1 million tons, an increase of about 0.6% compared to 2022. India's crude steel production in 2023 reached 140.2 million tons, which increased by 11.8% compared to 2022.
- Chromium is also important in the auto industry. Since China makes the most cars, the market for chromium in that country is expected to grow at a very fast rate.
- The production and sales in Asia-Pacific are primarily dominated by countries like China, India, and Japan, which consist of large automotive manufacturers and a vast number of production bases within the countries.
- According to the China Association of Automobile Manufacturers (CAAM), with a total vehicle production of 27 million units in 2022, China has the most significant automotive production base in the world, registering an increase of 3.4 % compared to 2021.
- In China, the main focus is to increase production and sales of electric vehicles. To this end, the country has set a target to produce 7 million electric vehicles per year by 2025. By 2025, the goal is to bring electric vehicles into 20 % of total new vehicle production in China.
- India has become the second-largest automotive vehicle manufacturer in the region. According to the Society of Indian Automobile Manufacturers (SIAM), during FY 2022-2023, the total number of automobiles manufactured in the country grew by about 12.55% compared to FY 2021-2022 and reached 2,59,31,867 units.
- According to the Japan Automobile Manufacturers Association (JAMA), motor vehicle production in the country in 2023 grew by 14.84% and was valued at 8,998,538 units.
- In Asia-Pacific, the chemical industry is rapidly expanding. Chromium is employed as a catalyst in oxidation processes, ethylene polymerization, and oligomerization catalysts used in the industrial manufacture of polyethylene and 1-hexene, and these qualities are projected to boost the chromium market in the coming years.
- Therefore, the aforementioned factors are expected to significantly impact the market in the coming years.

Value Chain Analysis
The chromium value chain starts with chromite ore mining and beneficiation, followed by transport (often bulk seaborne) to ferrochromium smelters, and then consumption primarily in stainless steel and other metallurgical applications, with additional demand from chemical and refractory end users. Upstream supply is concentrated, with reserves heavily located in Kazakhstan and southern Africa, while downstream processing is increasingly centered in Asia, where China is a major ferrochromium and stainless-steel producer and a key importer of chrome ore.
Midstream processing economics are shaped by energy availability and cost, given the power-intensive nature of ferrochrome smelting. This recurring bottleneck can drive shifts in regional capacity utilization. In parallel, chrome metal production and distribution form a smaller but strategically important chain for superalloys and specialty applications, where localized capacity changes can affect import dependence and purchasing patterns for industrial buyers.
Competitive Landscape
The chromium market is partially consolidated in nature, with a few major players dominating a significant portion of the market. Some of the major companies are (not in any particular order) Kermas Investment Group, Assmang Proprietary Limited, CVK Madencilik, Odisha Mining Corporation Ltd, and Glencore.
Chromium Industry Leaders
Kermas Investment Group
Assmang Proprietary Limited
CVK Madencilik
Odisha Mining Corporation Ltd.
Glencore
- *Disclaimer: Major Players sorted in no particular order

Market Opportunities and Future Outlook
Near-term opportunities are most visible in (i) supply security for chrome metal in regions that have relied on imports and (ii) upstream-to-midstream investments that reduce energy and logistics friction in ferrochrome production. In June 2026, AMG Critical Materials opened a chrome metal facility in New Castle, Pennsylvania (6,500 tons per year), which is one example of efforts focused on improving domestic availability for high-performance alloy users while reducing reliance on external supply chains.
On the ferrochrome side, capacity additions and debottlenecking in India are underway, supported by new furnaces and new unit plans at IMFA’s Kalinganagar operations (reported as initiated/targeted in 2026) and longer-cycle project development such as FACOR’s 330 KTPA ferrochrome plant construction announced in September 2025. Process improvement opportunities also center on lowering ferrochrome carbon intensity, with recent published research pointing to hydrogen-based pre-reduction and alternative smelting routes as pathways that can be scaled by producers when aligned with power and reductant availability.
Recent Industry Developments
- June 2026: Glencore Merafe Chrome Venture announced the restart of its Boshoek and Wonderkop ferrochrome smelters after finalizing a 62 c/kWh electricity tariff agreement with Eskom. The restart highlights how negotiated power terms can restore utilization at energy-intensive South African ferrochrome assets and can rebalance export availability from the country.
- May 2026: South Africa’s National Energy Regulator (Nersa) approved an amended electricity pricing framework for Glencore Merafe Chrome Venture and Samancor Chrome. The regulatory decision formalized power-cost structures that influence ferrochrome operating decisions, including curtailments, restarts, and contracting behavior.
- July 2025: Assmang permanently closed its Cato Ridge Works ferrochrome smelter in KwaZulu-Natal, citing financial losses, high electricity costs, and weak market conditions. The shutdown reflected continued rationalization of higher-cost capacity in South Africa and tightened the set of viable domestic smelting assets competing into global ferrochrome supply.


Research Methodology Framework and Report Scope
Market Definition and Coverage
For this methodology, the chromium market is measured as the volume of chromium consumed across key industrial uses, captured in kilotons. We follow chromium demand from supply into end-use applications such as metallurgical use, chemicals, and refractory consumption across major regions.
Scope exclusions: this sizing excludes value-added downstream finished goods that only contain chromium (such as stainless steel products) and it excludes unrelated surface-finishing service markets.
Segmentation Overview
- By Application
- Chemical
- Metallurgical
- Refractory
- Other Applications (Glass Polishing, Industrial Catalysts, and Pigments )
- By Geography
- Asia-Pacific
- China
- India
- Japan
- South Korea
- Malaysia
- Thailand
- Indonesia
- Vietnam
- Rest of Asia-Pacific
- North America
- United States
- Canada
- Mexico
- Europe
- Germany
- United Kingdom
- Italy
- France
- Spain
- NORDIC
- Turkey
- Russia
- Rest of Europe
- South America
- Brazil
- Argentina
- Colombia
- Rest of South America
- Middle East and Africa
- Saudi Arabia
- South Africa
- Nigeria
- Qatar
- Egypt
- United Arab Emirates
- Rest of Middle East and Africa
- Asia-Pacific
Data Sources, Market Sizing, and Validation
Desk Research
Desk work starts with building a clean fact base on chromium production, trade, and end-use linkages, since these are the signals that can be checked year after year. We rely on public sources such as USGS Mineral Commodity Summaries, UN Comtrade trade flows, World Steel Association indicators, and government mining and geology agencies that publish chromite and ferroalloy updates.
To convert these facts into a usable market model, we reviewed company annual reports, investor presentations, and exchange filings to understand capacity changes and operating conditions. We also used reputable press, association websites, and a paid subscription for shipment-level import and export tracking, plus company financials and news context. This helped validate inflection points when public data lagged. The desk sources listed here are illustrative only, and many other sources were used to collect, validate, and clarify data during the research process.
Primary Interviews and Surveys
Primary work was used to pressure-test the desk assumptions on how much chromite goes into ferrochrome, how demand shifts across metallurgical versus chemical uses, and how pricing and availability influence substitution. We spoke with a mix of producers, traders, processors, and large buyers across APAC, EMEA, and the Americas, so the final assumptions reflect procurement behavior and operating realities in different regions.
Distribution of primary research fieldwork respondents
| Company type | Respondent position | Region |
|---|---|---|
| Top tier: 28% | CXOs: 13% | APAC: 44% |
| Mid tier: 51% | Functional/Unit leaders: 35% | EMEA: 37% |
| Smaller Players: 21% | Managers: 52% | Americas: 19% |
Market-Sizing & Forecasting
The core sizing logic uses a top-down rebuild of chromium demand from visible supply and use signals, then it is adjusted to match application splits validated in interviews. In practice, production and trade data are mapped into where chromium is consumed, then allocated into metallurgical, chemical, refractory, and other uses based on observed process norms.
Key inputs include chromite ore output and trade direction, ferrochrome production and utilization changes, stainless steel activity as the largest demand pull for ferroalloys, apparent consumption trends by region, and price movements that can shift stocking behavior for a quarter or two. Where these inputs were incomplete for a country, we used proxy ratios from similar economies and then corrected them using regional expert feedback. We also ran a selective bottom-up check using sampled supplier capacities, typical operating rates, and implied output volumes, to keep totals realistic.
For forecasting, we used scenario analysis because chromium demand is sensitive to steel cycles and supply disruptions. Those scenarios were anchored to expert views on capacity additions and trade policy direction. The final forecast is the scenario-weighted path that best fits the verified signals and the most consistent assumptions on utilization and demand mix.
Data Validation & Update Cycle
Outputs are cross-checked against independent markers such as production totals, import dependence signals, and downstream steel indicators, before any numbers are finalized. When a country result looks unusual, we trace it back to the drivers, re-check the source series, and re-contact relevant interviewees if the change is material.
A multi-step review is followed where assumptions, unit conversions, and application mapping are checked by another analyst before sign-off. Reports are refreshed annually, and interim updates are made when major events occur, including large capacity closures, trade restrictions, or sudden price shifts. Before delivery, we do a final pass to ensure the latest public releases are reflected in the model.
Mordor Intelligence's Chromium Market Size Compared Against Other Published Estimates
Published market sizes for chromium often do not match, mainly because some sources treat the market as ore and concentrate value, while others treat it as chromium materials. Others also focus on volume rather than dollars. Differences also come from how recycled chromium units are handled and whether the analysis is tied to end-use consumption or to traded material flows.
For chromium specifically, the biggest gaps usually come from scope choices between ore-only versus total chromium-bearing inputs, and from whether the number is reported as value at current prices or as physical volume. Another driver is timing, since spot prices can swing the USD value sharply even if tonnage is steady, and some publishers update those price assumptions less frequently.
Benchmark comparison
| Source | Market Size | Gaps in Research Methodology |
|---|---|---|
| Mordor Intelligence | USD 44.88 M (2025) | |
| Trade Analytics Publisher A | USD 15.90 B (2024) | This estimate prices only chromium ore and concentrate consumption value, so it is not comparable to a volume-defined chromium demand number and it can move mainly with ore pricing and trade terms. |
| Government Statistics Digest B | USD 0.72 B (2025) | This figure is a country-level proxy based on net imports of chromium-containing materials and it is value-based, which excludes domestic production effects and can understate global demand movements. |
The table shows that the spread is mostly explained by what is being counted and in what unit, not by a simple disagreement on growth direction. Once chromium is kept as a physical demand pool that is allocated to applications and re-checked against trade and capacity signals, the 2025 volume total stays traceable to clear variables, a modeling choice applied by Mordor Intelligence.


Key Questions Answered in the Report
How big is the Chromium Market?
The Chromium Market size is expected to reach 46.61 kilotons in 2026 and grow at a CAGR of 3.86% to reach 56.33 kilotons by 2031.
What is the current Chromium Market size?
In 2026, the Chromium Market size is expected to reach 46.61 kilotons.
Who are the key players in Chromium Market?
Kermas Investment Group, Assmang Proprietary Limited, CVK Madencilik, Odisha Mining Corporation Ltd. and Glencore are the major companies operating in the Chromium Market.
Which is the fastest growing region in Chromium Market?
Asia-Pacific is estimated to grow at the highest CAGR over the forecast period (2026-2031).
Which region has the biggest share in Chromium Market?
In 2025, the Asia-Pacific accounts for the largest market share in Chromium Market.
What years does this Chromium Market cover, and what was the market size in 2025?
In 2025, the Chromium Market size was estimated at 46.61 kilotons. The report covers the Chromium Market historical market size for years: 2019, 2020, 2021, 2022, 2023 and 2024. The report also forecasts the Chromium Market size for years: 2026, 2027, 2028, 2029, 2030 and 2031.
Page last updated on:


 Your data is secure and never sold or shared.


