India Wire And Cable Market Size and Share
Market Overview
| Study Period | 2020 - 2031 |
|---|---|
| Forecast Data Period | 2026 - 2031 |
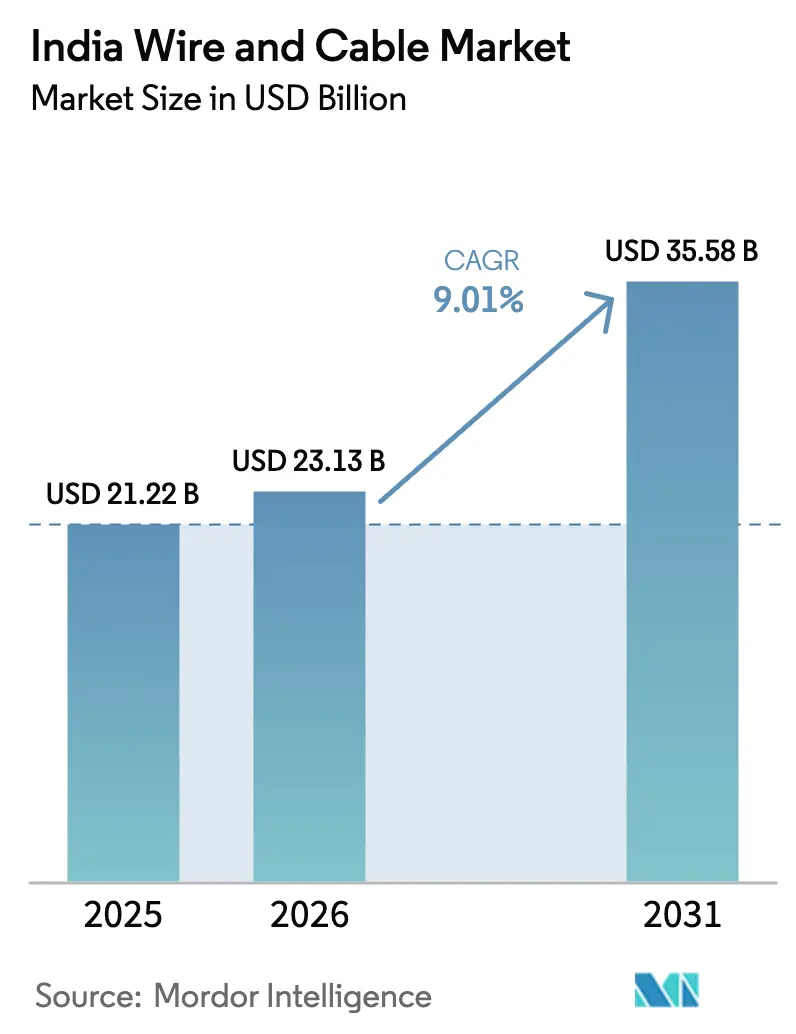
| Base Year Market Size (2025) | USD 21.22 Billion |
| Market Size (2026) | USD 23.13 Billion |
| Market Size (2031) | USD 35.58 Billion |
| Growth Rate (2026 - 2031) | 9.01% CAGR |
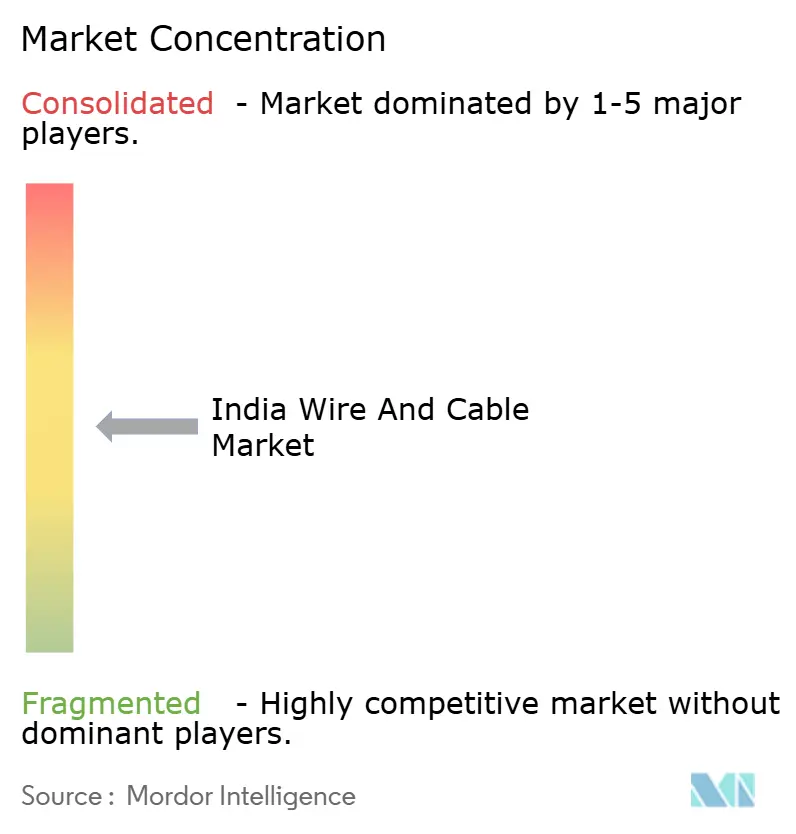
| Market Concentration | Medium |
Major Players *Disclaimer: Major Players sorted in no particular order Image © Mordor Intelligence. Reuse requires attribution under CC BY 4.0. | |
India Wire And Cable Market Analysis by Mordor Intelligence
The India Wire And Cable Market size is expected to grow from USD 21.22 billion in 2025 to USD 23.13 billion in 2026 and is forecast to reach USD 35.58 billion by 2031 at 9.01% CAGR over 2026-2031.
Housing demand, renewable-energy targets, and rapid telecom upgrades are converging to keep large-volume orders flowing to cable makers, while mandatory BIS certification is nudging buyers toward organized suppliers. Utility projects linked to the government’s pledge of 500 GW of non-fossil capacity by 2030 are creating multi-year procurement pipelines for extra-high-voltage (EHV) products. At the same time, 5G fiberisation and data-center corridors are expanding the addressable market for low-loss optical-fiber cables. Competitive intensity is rising as new copper smelters and backward-integration moves lower raw-material risk for large entrants, prompting incumbents to accelerate capacity and brand investments.
Key Report Takeaways
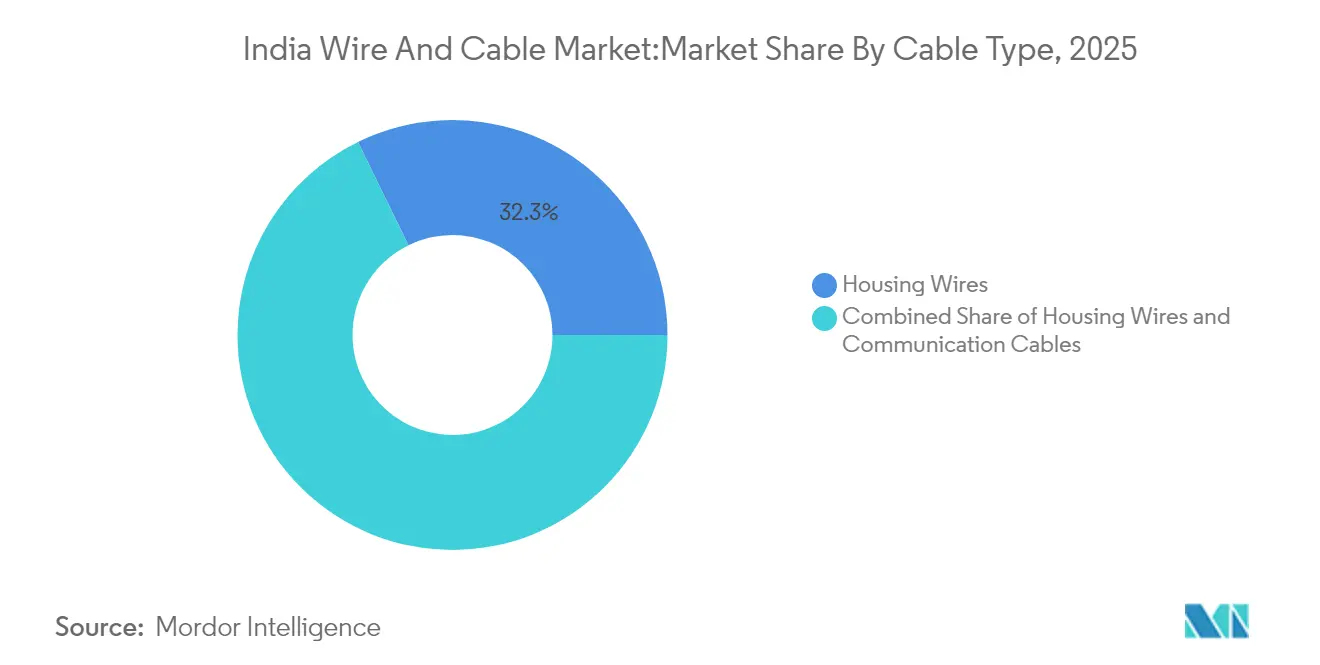
- By cable type, housing wires led with 32.25% of the India wire and cable market share in 2025, while fiber-optic cables are projected to expand at a 12.38% CAGR through 2031.
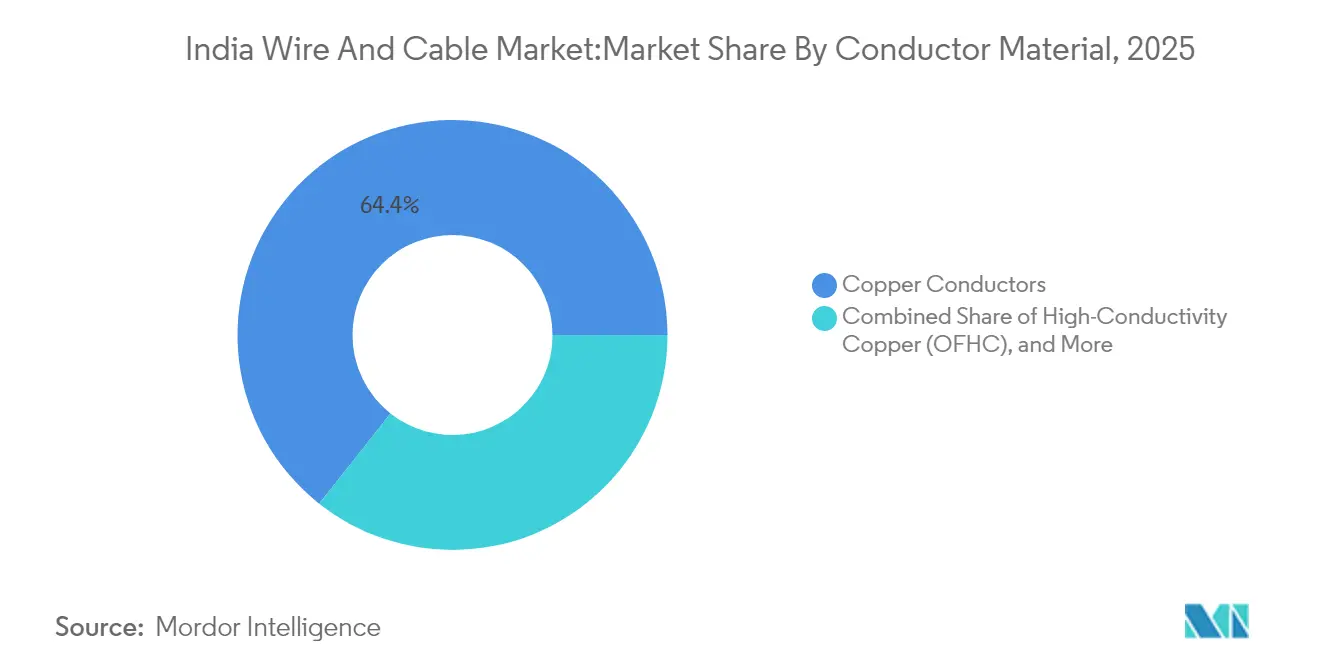
- By conductor material, copper accounted for 64.35% of the India wire and cable market size in 2025; high-conductivity copper variants are advancing at a 9.11% CAGR.
- By end-user, consumer applications held 69.40% of 2025 revenue, whereas IT & telecom demand is rising fastest at a 9.92% CAGR to 2031.
Note: Market size and forecast figures in this report are generated using Mordor Intelligence’s proprietary estimation framework, updated with the latest available data and insights as of 2026.
India contributes to a system defined not by any single country or region but by the interaction of many. The global wire and cable market data by Mordor Intelligence represents that combined structure.
India Wire And Cable Market Trends and Insights
Drivers Impact Analysis*
| Driver | (~) % Impact on CAGR Forecast | Geographic Relevance | Impact Timeline |
|---|---|---|---|
| Surging residential and commercial real estate completions | +2.10% | Mumbai, Delhi NCR, Bangalore | Medium term (2-4 years) |
| Utility-scale renewable-energy build-out acceleration | +1.80% | Gujarat, Rajasthan, Tamil Nadu | Long term (≥ 4 years) |
| Nation-wide 5G fiberisation and tower back-haul upgrades | +1.50% | Urban centers nationwide | Short term (≤ 2 years) |
| Government push for rural household electrification (Saubhagya 2.0) | +1.20% | Uttar Pradesh, Bihar, Odisha | Medium term (2-4 years) |
| Source: Mordor Intelligence | |||
Surging Residential and Commercial Real-Estate Completions
Rising urban incomes and favorable mortgage terms are fuelling a wave of premium apartment and office projects that specify flame-retardant, low-smoke housing wires. About 600,000 new urban homes were finished in 2023, and developers continue to report strong booking velocity in Tier-1 and Tier-2 cities. Higher-end projects increasingly demand 180-meter and 200-meter rolls to minimize joints, giving organized brands a pricing edge. A shift away from sub-25 lakh rupee units toward premium categories also lifts average cable value per dwelling. Developers expanding to Bangalore and Pune underline the west-south axis as a core consumption corridor. In parallel, commercial real-estate completions are embedding smart-building protocols that require additional data and control cabling. Together, these dynamics keep residential wiring the single largest contributor to the India wire and cable market.
Utility-Scale Renewable-Energy Build-Out Acceleration
Installed renewable capacity reached 217.62 GW by January 2025, and the grid needs thousands of circuit-kilometers of EHV and flexible DC cables to transmit output from desert and coastal clusters to load centers[2]Ministry of New and Renewable Energy, “Installed Renewable Capacity Dashboard,” mnre.gov.in. Ultra-high-voltage AC corridors and green-hydrogen clusters are being mapped for rollout through 2034, each backed by dedicated budget lines. Solar rooftop incentives under PM Surya Ghar have already passed 1 million installations, pushing up orders for UV-resistant DC strings. Additions of 34 GW in FY25, 87% of which came from renewables, illustrate the volume scale that cable suppliers must support. Developers increasingly favor low-loss OFHC conductors to meet grid-efficiency norms, propelling double-digit growth for high-purity copper variants. Manufacturers able to certify products for 1,500 V DC arrays are capturing premium margins in this fast-moving segment of the India wire and cable market.
Nation-Wide 5G Fiberisation and Tower Back-Haul Upgrades
India has rolled out 4.69 lakh 5G base stations since October 2022, yet only 35% of towers are fiberised, leaving massive headroom for optical-fiber deployment[1]Ministry of Communications, “5G Roll-Out Update February 2025,” dot.gov.in. Telecom operators are targeting near-100% fiber backhaul and a 1 Gbps pipe to 120 million households, translating to multi-year demand for armored and ribbon cables. Domestic fiber output exceeded 100 million fiber-kilometers in FY24, positioning India as a net exporter even as internal consumption accelerates. Data-center operators budget roughly USD 2 billion for fiber in the current decade, and Deloitte projects fiber deployment to grow 12-15% annually. Suppliers that invested in glass-preform capability, such as Finolex and West Coast Optilinks, now enjoy shorter cycle times and better cost control. The upshot is a sustained structural uplift in optical-fiber revenue within the India wire and cable market.
Government Push for Rural Household Electrification (Saubhagya 2.0)
The next phase of Saubhagya aims to connect the final 12 million unelectrified rural homes, focusing on states with historically low electrification ratios. Distribution utilities are issuing bundled tenders covering poles, meters, and aluminum conductors, favoring manufacturers with turnkey capabilities. Rural schemes also encourage frugal designs, increasing demand for aluminum-alloy solutions that balance conductivity with lower weight. Quality-assurance audits funded by REC and PFC are raising compliance thresholds, indirectly steering orders to certified brands. As last-mile electrification progresses, secondary demand emerges for household wiring upgrades, boosting retail volumes in small towns. This policy tailwind ensures that even price-sensitive geographies remain on the radar of organized players in the India wire and cable market.
Restraints Impact Analysis*
| Restraint | (~) % Impact on CAGR Forecast | Geographic Relevance | Impact Timeline |
|---|---|---|---|
| Volatile copper and aluminium prices compressing margins | -1.40% | Manufacturing hubs nationwide | Short term (≤ 2 years) |
| Proliferation of counterfeit low-grade wires in tier-3 markets | -0.80% | Smaller cities and rural areas | Medium term (2-4 years) |
| Source: Mordor Intelligence | |||
Volatile Copper and Aluminium Prices Compressing Margins
London Metal Exchange copper flirted with USD 10,000 per tonne in 2024, lifting raw-material cost to 70–75% of ex-factory price for copper-heavy SKUs. Domestic output remains capped because only 9.9% of identified ore is economically mineable. Plants resorted to shorter procurement cycles, hedging on MCX, and increasing scrap-based inputs after the import duty on scrap was trimmed. Aluminum faced parallel stress as smelter disruptions and energy costs pushed premiums higher. While organized players partly passed on the spike, smaller firms with limited working-capital lines saw margins erode below 4%. Elevated volatility encourages forward-integration into smelting and forces greater emphasis on copper-to-aluminum substitution in segments tolerant of slightly lower conductivity.
Proliferation of Counterfeit Low-Grade Wires in Tier-3 Markets
Price gaps of 7–10% between branded Class-2 copper conductors and non-standard Class-5 products entice low-income buyers, especially where regulatory checks are sporadic. Fake labeling often masks undersized conductors that overheat under-rated current, raising fire risk. BIS has mandated IS-694 and IS-7098 compliance for all low- and medium-voltage cables, yet enforcement teams remain understaffed in far-flung districts. Organized brands invest in holographic packaging, QR-coded spools, and rural awareness campaigns but still lose shelf space to unorganized rivals. Over time, stepped-up raids and electricity-safety drives are expected to narrow this gray market, although a complete purge remains unlikely before 2028.
*Our forecasts treat driver/restraint impacts as directional, not additive. The impact forecasts reflect baseline growth, mix effects, and variable interactions.
Segment Analysis
By Cable Type: Housing Wires Lead Amid Fiber Surge
Housing wires commanded a 32.25% share of the India wire and cable market in 2025, underpinned by the nationwide push to build 100 million new homes during the decade. These volumes translated into USD 6.84 billion of 2025 revenue, making the category the anchor of distributor cash flows. Growth remains steady because apartment completions correlate closely with wiring installation, and rising per-capita income drives adoption of FR-LSH and energy-efficient variants. At the premium end, builders specify 180-meter rolls to reduce jointing losses, lifting value per unit. Compliance audits by state electricity boards tip demand toward IS-marked spools, tightening shelf space for counterfeit offerings. In parallel, public-sector housing agencies are inserting sustainability clauses that favor halogen-free compounds, nudging local vendors up the technology curve.
Communication cables are set to outpace all other categories with a forecast 12.38% CAGR to 2031, propelled by India’s 120 million-home fiber target and hyperscale data-center clustering. The India wire and cable market size for fiber-optic products is projected to cross USD 5.64 billion by 2031 as low-loss specifications become mainstream. Suppliers with internal glass-preform capability benefit from higher margins because imported preforms attract a 6.5% basic duty. Flexible industrial cables and instrumentation lines enjoy mid-single-digit expansion as factory automation deepens under the PLI schemes. Coaxial and twisted-pair cables hold a niche for legacy CCTV and broadcast links but face volume leakage to Ethernet over fiber. Overall, cable-type diversification remains a hedge for manufacturers against cyclicality in any one end-market.


By Conductor Material: Copper Dominance Faces Efficiency Challenge
Copper retained 64.35% revenue control within the India wire and cable market in 2025, thanks to superior conductivity and entrenched supply chains. High-conductivity (OFHC) grades are winning share in power-transmission projects because a 1% efficiency gain can shave millions off lifetime energy losses. These variants are on a 9.11% CAGR path through 2031, and suppliers with vertical integration into smelting and rod-making gain cost advantages. Aluminum remains the preferred metal for price-sensitive rural lines and certain overhead conductors, keeping its share stable near 32%. Hybrid conductors that wrap aluminum cores with copper cladding are emerging as a compromise between weight and conductivity, especially for feeder lines in smart-grid deployments. Adani’s Kutch Copper smelter, scalable to 1 million tpa, promises to cut India’s USD 3.3 billion import bill and stabilize local premiums. Reduced duty on copper scrap opens the door for cost-effective secondary-metal blends, a relief for small and mid-size players. Yet price instability clouds margin planning, compelling CFOs to pursue dynamic hedging and inventory segmentation. As material science advances, the competitive narrative is shifting from metal choice alone to total-lifecycle performance, reinforcing the premium end of the India wire and cable market.
By End-User Type: Consumer Dominance Amid B2B Acceleration
Consumer applications generated 69.40% of 2025 revenue, a function of India’s unparalleled housing stock addition and mass electrification drives. Project execution cycles in residential complexes are short, so cable makers enjoy rapid cash rotation. Growing middle-income adoption of smart appliances is pushing amperage loads higher, prompting upgrades to higher-gauge wiring even in retrofit work. Retail channels, particularly multi-brand outlets in Tier-2 cities, remain the battleground for brand recall and POS merchandising.
Business-to-business verticals are scaling faster: IT & telecom is tracking a 9.92% CAGR as data-center corridors in Mumbai, Chennai, and Hyderabad line up dedicated dark-fiber networks. Power utilities require EHV and submarine-cable varieties for upcoming offshore wind projects. Process industries, including new green-hydrogen electrolyzers, are budgeting for heat- and chemical-resistant instrumentation cables. Oil and gas are migrating to cross-linked polyethylene (XLPE) designs for safety reasons, supporting specialty volumes. These shifts gradually rebalance the India wire and cable market away from a pure consumer story toward a more diversified industrial demand mix.
Geography Analysis
Gujarat anchors production, hosting integrated plants from Adani, Finolex, and ABB within port-adjacent industrial estates. Proximity to copper concentrate imports and a proactive single-window clearance regime reinforce its edge. The India wire and cable market size attributable to Gujarat plants is estimated at USD 6 billion in 2025. Maharashtra, meanwhile, is the largest consumption state, driven by Mumbai’s data-center corridor and dense urban redevelopment pipelines. Tamil Nadu’s electronics cluster around Sriperumbudur and the emerging semiconductor ecosystem in Chennai create a sustained pull for high-specification industrial and communication cables. New entrants such as VCI Global have set up India’s first semiconductor-wire facility here, aiming at USD 50 million revenue in the first year.
Northern states, notably Rajasthan and Uttar Pradesh, combine renewable-energy capacity additions with Saubhagya electrification targets, translating into steady aluminum-alloy conductor orders. Eastern states still trail in per-capita consumption but offer the fastest growth off a small base. Odisha and Bihar benefit from rural electrification grants and emerging steel-and-mining expansions that need reliable power links. Tier-2 cities like Pune, Kochi, and Bhubaneswar are also courting edge data centers, adding incremental optical-fiber demand. Overall, the India wire and cable market shows geographic duality: coastal states lead in absolute value, while hinterland regions deliver the highest percentage growth.
The wire and cable market is analyzed by Mordor Intelligence across multiple other geographies, with in-depth regional assessments available for North America, Europe, and South America. This is complemented by country-specific insights for Mexico, reflecting various localized market behavior and policy environments' coverage.
Competitive Landscape
The organized segment controls about 74% of the India wire and cable market, yet no single player tops one-fifth share, keeping rivalry intense. Polycab stays ahead at 18% by leveraging a 4,000-strong distributor network and brand campaigns that highlight BIS compliance. KEI Industries holds 9% share through project verticals in EHV turnkey contracts, and RR Kabel’s 7% slice rests on premium housing-wire positioning. New entrants such as Adani and Birla are banking on backward integration to reset cost curves and challenge incumbent pricing assumptions.
Strategic moves lean toward capacity expansion and technology differentiation. HFCL’s Poland plant embeds geographic hedging, while Finolex’s preform unit cuts import content and shrinks lead times for FTTH orders. Patent filings across fiber design, insulation compounds, and smart cables are tracking higher, signaling an R&D arms race. Brands also invest in digital marketing and influencer campaigns to win the retail counter, a vital node in a country with 80,000-plus electrical outlets.
Export ambition is another frontier. HFCL sets a target of 70% overseas revenue by 2029, and RR Kabel is adding UL-listed SKUs for the North American market. Still, domestic opportunity remains vast; organized players expect branded share to climb to 80% before decade-end as BIS enforcement tightens. In sum, competitive success now hinges on cost-effective backward integration, spec-driven product depth, and a distribution footprint that extends beyond metros into semi-urban clusters, the engine room of the India wire and cable market.
India Wire And Cable Industry Leaders
Finolex Cables Limited
V-Guard Industries Ltd.
Havells India Ltd.
Polycab India Limited
KEI Industries Ltd
- *Disclaimer: Major Players sorted in no particular order

Recent Industry Developments
- February 2025: Ram Ratna Wires cleared investment for a new Bhiwadi plant and Silvassa expansion.
- February 2025: Dynamic Cables sanctioned capacity expansion at its Reengus, Rajasthan unit.
- November 2024: Apar Industries tripled planned CTC conductor capacity to 20,490 MT by Q3 FY26.
- February 2024: Finolex Cables committed INR 500 crore to double fiber drawing to 8 million FKM per year.


Research Methodology Framework and Report Scope
Market Definitions and Key Coverage
Our study defines the Indian wire and cable market as all newly manufactured insulated copper, aluminum, and optical-fiber conductors that move power or data across low, medium, and high-voltage networks for residential, commercial, industrial, telecom, and utility use. We capture sales booked at the factory gate in United States dollars, covering power cables, housing wires, coaxial, data, fiber-optic, and instrumentation lines that flow through both OEM and distributor channels.
Scope exclusion: repair services, bare overhead conductors, finished harness sets, and accessories stand outside this valuation.
Segmentation Overview
- By Cable Type
- Power Cable
- Low Voltage (LV)
- Medium Voltage (MV)
- High and Ultra-High Voltage (HV/UHV)
- Housing Wires
- 90 m Housing Wire
- 180 m and 200 m Housing Wires
- Communication Cables
- Coaxial
- Fiber Optic
- Data and Ethernet
- Twisted Pair
- Instrumentation and Control Cable
- Flexible and Specialty Industrial Cables
- Power Cable
- By Conductor Material
- Copper Conductors
- High-Conductivity Copper (OFHC)
- Aluminium Conductors
- Aluminium Alloy Conductors
- By End-user Type
- Consumers (B2C)
- Businesses (B2B)
- Construction - Residential
- Construction - Commercial
- IT and Telecommunication
- Energy and Power TandD
- Oil and Gas
- Other Verticals (AandD, Manufacturing etc.)
Detailed Research Methodology and Data Validation
Primary Research
Telephone interviews and online surveys with cable manufacturers, bulk buyers, EPC contractors, and regional distributors across North, West, South, and East India let us vet demand drivers, typical price bands, and technology shifts. The exchanges also surface fresh policy changes and tariff updates, which we incorporate before locking the forecast.
Desk Research
We begin by compiling public macro and industry data from authorities such as the Ministry of Power, Central Electricity Authority, Telecom Regulatory Authority of India, and the Directorate General of Commercial Intelligence & Statistics; these reveal grid additions, fiber route kilometers, and import-export swings. Our analysts, using Census of India housing completions and Reserve Bank price indices, translate physical growth into demand signals. Company filings, investor decks, and construction ministry dashboards then refine average selling prices and segment splits. Paid databases, including D&B Hoovers for company financials and Dow Jones Factiva for press flows, supply further context. This list is illustrative, and many additional sources are tapped during validation.
A second pass screens the data for consistency across time, currency, and unit definitions, thereby flagging anomalies before the model build begins.
Market-Sizing & Forecasting
We frame the market top-down by rebuilding domestic consumption from production volumes, net trade, and channel mark-ups. Then we check the outcome through selective bottom-up roll-ups of sampled factory output and average selling prices. Key variables like kilometers of new transmission lines, housing starts, fiber-to-the-home connections, copper LME prices, and renewable capacity additions feed the calculators. A multivariate regression projects each driver to 2030, while scenario analysis adjusts for commodity cost swings. Where bottom-up samples fall short, interpolation guided by primary insights closes the gaps.
Data Validation & Update Cycle
Results pass a three-layer review: automated variance checks, peer analyst scrutiny, and final sign-off by a senior reviewer. We refresh every twelve months and trigger interim updates when policy shocks or major capacity announcements arise; a fresh sense-check precedes each client delivery.
Why Mordor's India Wire And Cable Market Baseline Rings True
Published estimates often vary, and buyers wonder why.
Differences emerge from scope choices, currency bases, price assumptions, and refresh speeds.
Benchmark comparison
| Market Size | Anonymized source | Primary gap driver |
|---|---|---|
| USD 21.22 bn (2025) | Mordor Intelligence | - |
| USD 9.32 bn (2024) | Regional Consultancy A | Omits communication and building wires; focuses on organized players only |
| USD 17.27 bn (2023) | Trade Journal B | Uses shipment tonnage without ASP normalization; older currency base |
| USD 6.60 bn (2024) | Industry Analytics C | Relies solely on customs data; excludes domestic output |
Taken together, the comparison shows that when scope is narrow or prices are not updated, values fall short; when shipments are over-extrapolated, they drift high. Mordor Intelligence, by balancing volume, price, and timely policy inputs, provides a dependable midpoint that decision-makers can trace and replicate.


Key Questions Answered in the Report
What is the current size of the India wire and cable market?
The India wire and cable market size is valued at USD 23.13 billion in 2026.
How fast is the market expected to grow?
Revenue is forecast to expand at a 9.01% CAGR, reaching USD 35.58 billion by 2031.
Which cable type is growing the fastest?
Fiber-optic cables lead growth with a projected 12.38% CAGR through 2031, driven by 5G and data-center deployment.
Who are the top three players in the market?
Polycab holds roughly 18% share, followed by KEI Industries at 9% and RR Kabel at 7%.
What policy initiatives are supporting demand?
Key catalysts include the 500 GW non-fossil capacity target, PM Surya Ghar rooftop solar scheme, BIS cable certification and Saubhagya 2.0 rural electrification.
How is copper price volatility affecting manufacturers?
Copper near USD 10,000 per tonne has compressed margins; firms are hedging, using more scrap and, in some segments, shifting to aluminum conductors.
Page last updated on:


