India Recycling Market Size and Share
Market Overview
| Study Period | 2020 - 2031 |
|---|---|
| Forecast Data Period | 2026 - 2031 |
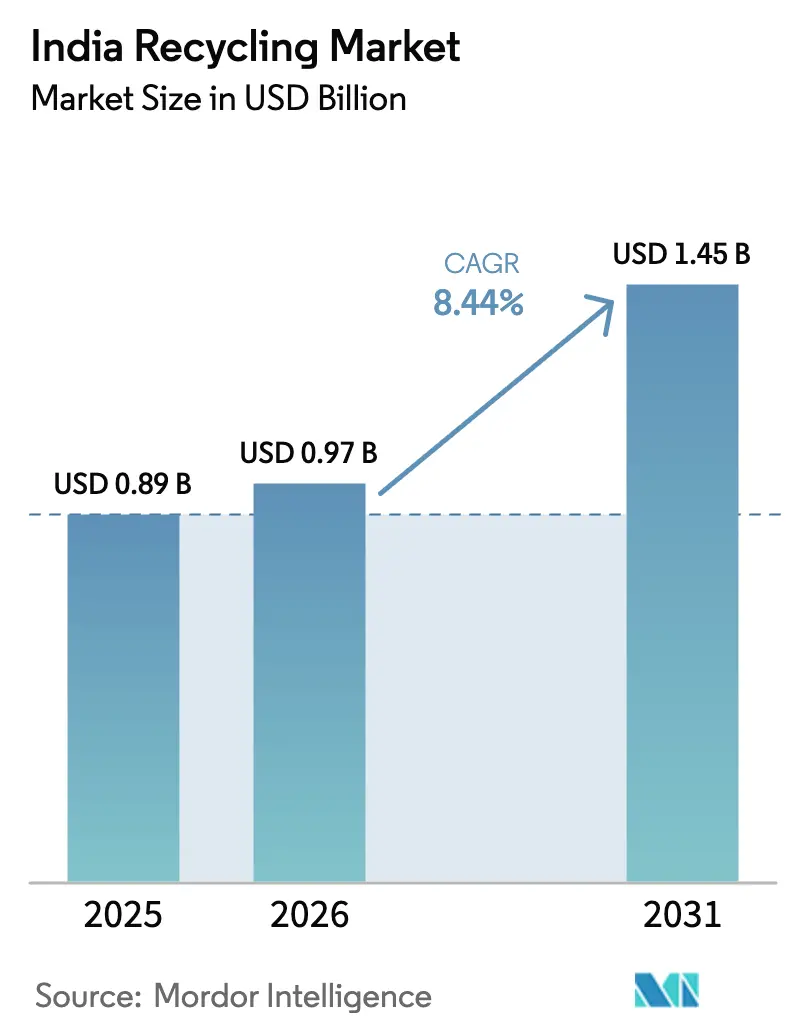
| Base Year Market Size (2025) | USD 0.89 Billion |
| Market Size (2026) | USD 0.97 Billion |
| Market Size (2031) | USD 1.45 Billion |
| Growth Rate (2026 - 2031) | 8.44% CAGR |
| Market Concentration | Medium |
Major Players *Disclaimer: Major Players sorted in no particular order Image © Mordor Intelligence. Reuse requires attribution under CC BY 4.0. | |
India Recycling Market Analysis by Mordor Intelligence
The India Recycling Market size was valued at USD 0.89 billion in 2025 and is estimated to grow from USD 0.97 billion in 2026 to reach USD 1.45 billion by 2031, at a CAGR of 8.44% during the forecast period (2026-2031). This growth rests on tighter extended producer responsibility (EPR) mandates, municipal landfill shortages that improve feedstock availability, and rising demand for recycled content from fast-moving consumer goods (FMCG) and battery manufacturers. EPR registration now covers 44,659 plastic intermediaries, 7,050 e-waste entities, and 2,933 battery handlers, creating a traceable compliance ecosystem that favors organized recyclers. Mechanical recycling still dominates, yet chemical routes are scaling up as brand owners, such as Hindustan Unilever and Coca-Cola India, seek food-grade polymers that command premium pricing. Metals are the fastest-growing material group, thanks to an impending wave of lithium-ion battery end-of-life, forecasted to reach 600,000 tons by 2030. Investor confidence is evident in Attero Recycling’s USD 76 million raise to expand battery capacity, while ultra-large cement kilns integrate alternative fuel and raw material (AFR) co-processing to hedge feedstock volatility.
Key Report Takeaways
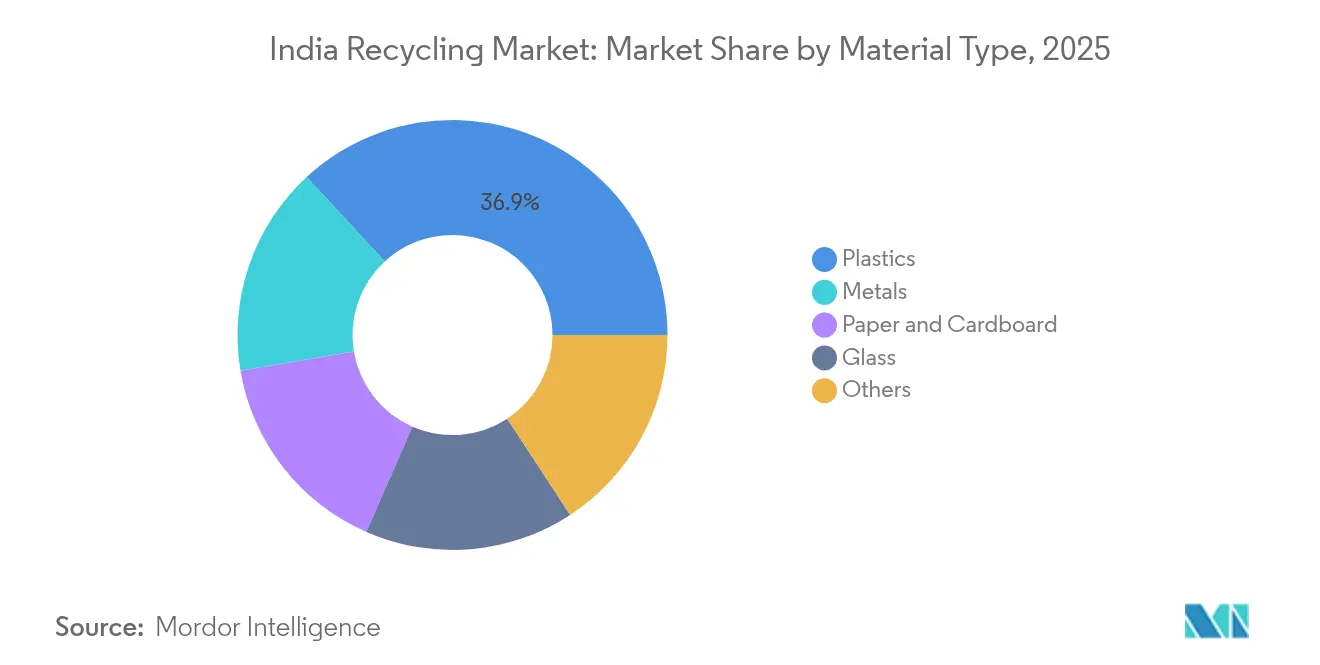
- By material type, plastics led with 36.86% of India recycling market share in 2025; metals are forecast to expand at a 8.94% CAGR through 2031.
- By source, municipal streams accounted for 48.74% of the India recycling market size in 2025, while medical waste is projected to advance at a 9.18% CAGR through 2031.
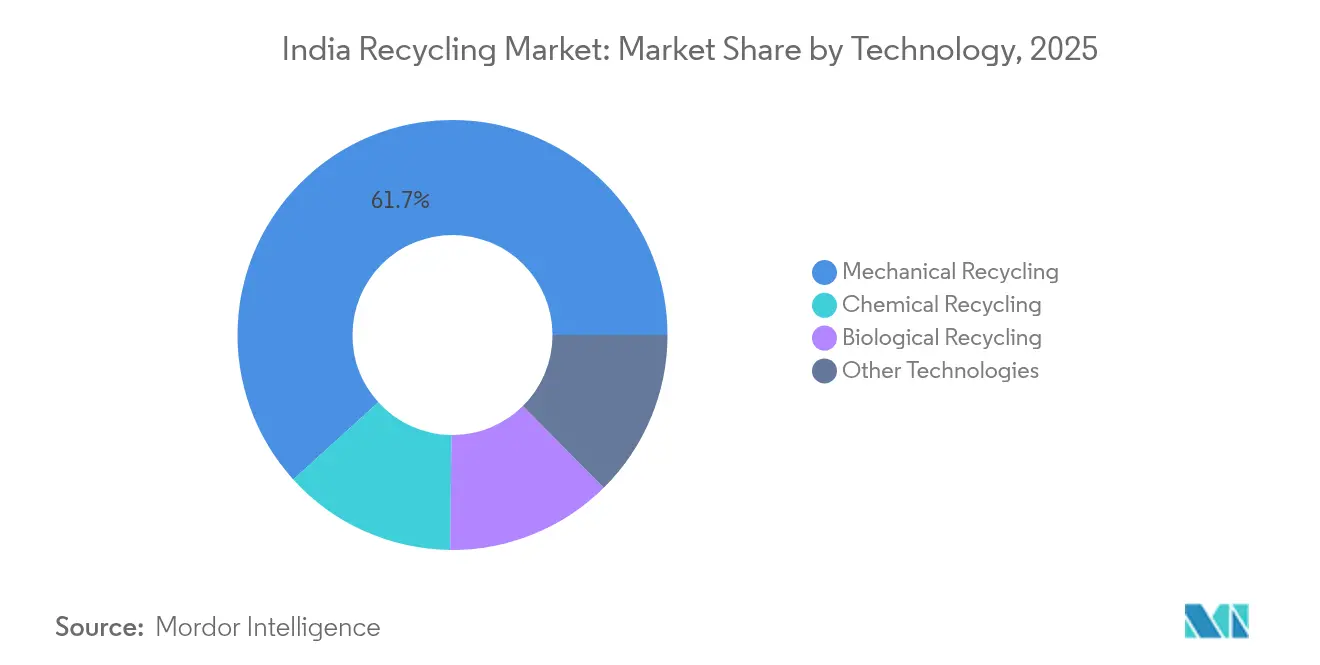
- By technology, mechanical recycling held 61.72% of India recycling market share in 2025 and chemical routes are projected to grow at a 9.45% CAGR to 2031.
Note: Market size and forecast figures in this report are generated using Mordor Intelligence’s proprietary estimation framework, updated with the latest available data and insights as of 2026.
India Recycling Market Trends and Insights
Drivers Impact Analysis*
| Driver | (~) % Impact on CAGR Forecast | Geographic Relevance | Impact Timeline |
|---|---|---|---|
| Extended EPR mandates across plastics and electronics | +1.80% | National, with early enforcement in Maharashtra, Tamil Nadu, Gujarat, Karnataka | Medium term (2-4 years) |
| Rising urban MSW volumes and landfill shortages | +1.50% | National, concentrated in Delhi-NCR, Mumbai, Bengaluru, Chennai, Hyderabad metro regions | Short term (≤ 2 years) |
| Surge in recycled-content demand from FMCG and packaging majors | +1.70% | National, with brand-owner hubs in Mumbai, Delhi-NCR, Bengaluru, Chennai | Medium term (2-4 years) |
| Fiscal incentives (GST concessions, PLI) for recycling plants | +1.30% | National, with higher subsidy adoption in Gujarat, Tamil Nadu, Karnataka, Maharashtra | Medium term (2-4 years) |
| Lithium-ion battery end-of-life wave from Electric Vehicle adoption | +1.40% | National, with battery recycling clusters in Gujarat, Tamil Nadu, Karnataka, Haryana | Long term (≥ 4 years) |
| Source: Mordor Intelligence | |||
Extended EPR Mandates Across Plastics and Electronics
Plastic Waste Management Rules 2022 and E-Waste Management Rules 2022 impose 60% e-waste collection for 2025–2026, rising to 80% by 2027–2028, and 70% lithium-ion battery recovery by 2027–2028[1]Ministry of Environment, Forest and Climate Change, “Plastic Waste Management Rules 2022,” moef.gov.in. Environmental compensation levies range from Rs 5,000 to Rs 20,000 per ton, turning non-compliance into a costly option. Credit prices fluctuate between Rs 8 and Rs 25 per kilogram, depending on the polymer grade and regional supply and demand. Maharashtra and Tamil Nadu conduct quarterly audits that encourage organized recyclers to transition toward ISO 14001-certified recovery facilities. Battery rules compel electric-vehicle OEMs to establish closed-loop networks, accelerating reverse-logistics partnerships with Attero and Gravita.
Rising Urban MSW Volumes and Landfill Shortages
India produces 160,000–170,000 tons of municipal solid waste (MSW) daily, yet only 474 of the 2,421 legacy landfills have been remediated under the Swachh Bharat Mission 2.0. Tipping fees in land-scarce metros exceed Rs 800–Rs 1,200 per ton, making recycling more economical than dumping. Central allocations of Rs 1,41,600 crore (USD 17 billion) through 2026 fund material recovery and waste-to-energy plants. However, source segregation remains below 30% in tier-2 cities, resulting in polymer recovery yields of 40–50% compared to 70–80% for segregated streams[2]NITI Aayog, “Informal Waste Collection in Indian Cities,” niti.gov.in. Decentralized processors such as Saahas Zero Waste deploy micro-composters that bypass municipal bottlenecks.
Surge in Recycled-Content Demand from FMCG and Packaging Majors
Hindustan Unilever targets a 25% recycled plastic content by 2025, while Coca-Cola India aims for 50% by 2030, collectively requiring 150,000–200,000 tons of food-grade rPET annually. ITC achieved plastic neutrality in 2024, and Nestlé India’s 2025 packaging pledge further tightens demand. Mechanical recyclers sell non-food polymers at Rs 40–Rs 60 per kilogram, whereas chemical recyclers command Rs 80–Rs 120 for virgin-quality resin that meets Food Safety and Standards Authority limits. PepsiCo India and Parle Products have locked in multi-year off-take deals, underwriting new pyrolysis plants. Mono-material packaging innovations simplify sortation and lift yield economics.
Fiscal Incentives and Lithium-Ion Battery End-of-Life Wave
The Production Linked Incentive scheme earmarks Rs 6,940 crore (approximately USD 833 million) and offers sales incentives of 6–12% for recycling-linked advanced materials. The volume of battery scrap is expected to reach 600,000 tons by 2030 as electric vehicle penetration reaches 30%. Attero’s Gujarat plant processes 300,000 packs per year, extracting metals with a purity of 95%. State subsidies vary: Gujarat pays 50% of capital expenditure (capex), Tamil Nadu offers 25% plus electricity duty waivers, and Karnataka fast-tracks clearances, forcing recyclers to optimize sites around subsidy arbitrage.
Restraints Impact Analysis*
| Restraint | (~) % Impact on CAGR Forecast | Geographic Relevance | Impact Timeline |
|---|---|---|---|
| Fragmented, informal collection ecosystem | -1.20% | National, acute in tier-2 and tier-3 cities across Uttar Pradesh, Bihar, Madhya Pradesh, Rajasthan | Short term (≤ 2 years) |
| Limited domestic end-markets for lower-grade recycled polymers | -0.80% | National, with export dependencies in Gujarat, Maharashtra port clusters | Medium term (2-4 years) |
| Volatility in scrap prices linked to global commodity cycles | -0.90% | National, with higher exposure for metal recyclers in Gujarat, Maharashtra, Tamil Nadu | Medium term (2-4 years) |
| Source: Mordor Intelligence | |||
Fragmented, Informal Collection Ecosystem
Informal picker networks handle 60–70% of first-mile collection in smaller cities, operating outside tax and labor frameworks. This curtails traceability, undermining ISO 14021 self-declarations sought by brand owners. Formal recyclers pay 15–25% more for feedstock because informal agents circumvent compliance costs. Municipal pilot programs offering IDs, insurance, and fixed prices cover under 20% of workers due to bureaucratic delays. Contamination rates of 20–30% force extra washing and raise processing costs.
Limited Domestic End-Markets for Lower-Grade Recyclate & Scrap Price Volatility
Domestic demand for non-food-grade recyclate remains limited, prompting exporters to offload 30–40% of their output to Southeast Asia and the Middle East at a 10–15% margin discount. Mixed-plastic scrap prices oscillate between Rs 12 and Rs 35 per kilogram, in line with crude oil swings, pressuring 8–12% EBITDA operators. Metals show similar volatility: aluminum trades at Rs 140–Rs 180, copper at Rs 550–Rs 650, and steel at Rs 28–Rs 38 per kilogram, with 20–30% swings driven by LME benchmarks. Without a domestic recyclate exchange, small firms face unhedged price risk.
*Our forecasts treat driver/restraint impacts as directional, not additive. The impact forecasts reflect baseline growth, mix effects, and variable interactions.
Segment Analysis
By Material Type: Battery Metals Outpace Packaging Polymers
Plastics currently account for 36.86% of India's recycling market share, yet slower packaging growth and mono-material design are limiting volumes. Attero’s USD 76 million raise underscores confidence in battery-metal loops, while premium rPET from chemical recyclers satisfies Coca-Cola India’s multi-year off-takes. Paper recycling leverages e-commerce corrugate demand, and tire pyrolysis expands the niche for “other materials.” Metals are expected to grow at a 8.94% CAGR to 2031, driven by soaring end-of-life battery flows that are projected to reach 600,000 tons.
The Indian recycling market size for metals is poised to grow as integrated producers such as Hindustan Zinc and Gravita India integrate scrap operations into primary smelting. Plastics retain scale advantages but face pressure from the value chain to deliver food-contact compliance. Premium chemical-route polymers command a double margin over mechanically recycled grades, incentivizing capacity additions in Gujarat and Tamil Nadu. Glass and composites remain small due to high logistics costs and low cullet demand.


By Source: Medical Waste Compliance Drives Fastest Expansion
Municipal waste contributed 48.74% of India recycling market size in 2025, yet medical waste rises at a 9.18% CAGR through 2031 on stricter Biomedical Waste Management Rules. Industrial scrap offers higher purity and a consistent flow, appealing to organized plants despite its lower volume. Construction debris underperforms, although cement kilns co-process material for AFR substitution.
Hospital-chain outsourcing to Ramky Enviro Engineers and NEPRA boosts on-site autoclave installations, securing long-term contracts. Decentralized processors extract the organic fraction from municipal streams, reducing landfill burden and shifting volume to neighborhood microfacilities. Industrial players set up captive loops to reduce virgin material costs and meet EPR audits, while agricultural plastic uptake lags outside drip-irrigation belts.
By Technology: Chemical Routes Capture Premium Polymer Demand
Mechanical processes hold 61.72% India recycling market share, thanks to low capex and simple feedstock; chemical routes grow 9.45% CAGR on virgin-grade polymer demand. Pyrolysis and depolymerization sidestep contamination and guarantee Food Safety Authority thresholds, which big beverage brands require. Biological options, mainly composting and anaerobic digestion, remain niche.
Volume-driven mechanical players compete on throughput, while chemical entrants chase high-margin food-grade applications. Cement kiln co-processors form a hybrid archetype, absorbing mixed waste to reach 15–20% thermal substitution across plant networks. Mechanical dominance erodes as brands seek traceable, certified feedstock that chemical routes provide.
Geography Analysis
Maharashtra and Gujarat together held a major portion of the national organized capacity in 2024, driven by industrial clusters in Mumbai, Pune, Ahmedabad, and Surat. Tamil Nadu and Karnataka lead in technology adoption, with battery and chemical pilot plants located in Chennai and Bengaluru. Delhi-NCR produces the most MSW per capita at 0.6–0.7 kg daily, yet remediates only 3 of 22 landfills, ensuring abundant feedstock for material recovery.
The eastern states—West Bengal, Odisha, and Jharkhand—lag, despite their heavy reliance on steel and mining waste. Northern states like Uttar Pradesh and Punjab experience brisk agricultural plastic flows but lack formal collection systems. Battery rules have clustered recycling in Gujarat, Tamil Nadu, and Karnataka due to the presence of EV assembly hubs and export ports. Maharashtra enforces quarterly EPR audits, achieving 80% compliance among producer-responsibility organizations versus 50–60% in low-inspection states.
Coastal states dominate exports, with Gujarat and Maharashtra shipping 70% of recycled plastic and metal abroad, although freight premiums shave 10–15% off their margins. Inland operators face higher freight costs, prompting decentralized processing models, such as micro-composters, in Bengaluru, Pune, and Hyderabad. Per-capita recycling in Maharashtra and Tamil Nadu sits at 12–15 kg annually, quadruple that of Uttar Pradesh and Bihar.
Competitive Landscape
The India Recycling market is moderately fragmented. Informal networks control up to 70% of first-mile collection, while the top 10 organized firms manage only 25–30% of total throughput. Vertically integrated metal recyclers, such as Gravita India and Hindustan Zinc, leverage their smelting infrastructure for battery scrap. Specialized contractors, such as Antony Waste and Ramky Enviro, run long-term municipal concessions. Technology disruptors Attero Recycling and Greenko ZeroC focus on chemical routes and battery metals.
India Recycling Industry Leaders
Re Sustainability
Attero
NEST
Gravita India Ltd.
Antony Waste Handling Cell Limited
- *Disclaimer: Major Players sorted in no particular order

Recent Industry Developments
- October 2024: Nupur Recyclers Ltd. (NRL) is set to broaden its horizons by venturing into aluminum extrusion manufacturing, spearheaded by its new subsidiary, Nupur Extrusion. With an eye on the surging demand for recycled materials in the solar energy and construction sectors, the company is poised to invest approximately USD 2.1 million to establish its new plant.
- September 2024: Gravita India Limited, a prominent global recycling company with a footprint in 12 countries, announced the acquisition of a rubber recycling plant in Romania. This strategic move is set to bolster Gravita's presence, expand its customer base, and fortify its competitive stance in the European market.


India Recycling Market Report Scope
Recycling transforms waste materials into new products, often incorporating energy recovery from these materials. A material's recyclability hinges on its capacity to regain its original properties. This process serves as a sustainable alternative to traditional waste disposal methods, conserving materials and curbing greenhouse gas emissions.
The India Recycling Market is Segmented by Material Type (Plastics, Metals, Paper and Cardboard, Glass, Others), Source (Municipal (Residential and Commercial), Industrial, Medical Waste, Construction Waste, and Other Sources), Technology Used (Mechanical Recycling, Chemical Recycling, Biological Recycling, and Other Technologies). The Report Offers India Recycling Market Sizes and Forecasts in Value (USD) for all the Above Segments.
| Plastics |
| Metals |
| Paper and Cardboard |
| Glass |
| Others |
| Municipal (Residential and Commercial) |
| Industrial |
| Medical Waste |
| Construction Waste |
| Other Sources |
| Mechanical Recycling |
| Chemical Recycling |
| Biological Recycling |
| Other Technologies |
| By Material Type | Plastics |
| Metals | |
| Paper and Cardboard | |
| Glass | |
| Others | |
| By Source | Municipal (Residential and Commercial) |
| Industrial | |
| Medical Waste | |
| Construction Waste | |
| Other Sources | |
| By Technology | Mechanical Recycling |
| Chemical Recycling | |
| Biological Recycling | |
| Other Technologies |


Key Questions Answered in the Report
How large is the India recycling market in 2026?
The India Recycling Market size was valued at USD 0.89 billion in 2025 and is estimated to grow from USD 0.97 billion in 2026 to reach USD 1.45 billion by 2031, at a CAGR of 8.44% during the forecast period (2026-2031).
Which material category is expanding the fastest through 2031?
Metals, driven by end-of-life lithium-ion batteries, are forecast to grow at a 8.94% CAGR, outpacing plastics and paper.
What role do EPR mandates play in growth?
Mandatory EPR targets for plastics, electronics, and batteries add 2.1 percentage points to forecast CAGR by compelling brand owners to source certified recyclate.
Which technology is gaining share over traditional mechanical recycling?
Chemical routes such as pyrolysis and depolymerization are growing at 9.45% CAGR because they meet food-grade polymer specifications that brands require.
Which states offer the most attractive incentives for new recycling plants?
Gujarat provides a 50% capex subsidy, Tamil Nadu offers a 25% subsidy plus electricity duty waiver, and Karnataka expedites environmental clearances, prompting location optimization around subsidies.
Page last updated on:


