
Market Overview
| Study Period | 2020 - 2031 |
|---|---|
| Forecast Data Period | 2026 - 2031 |
| Base Year Market Size (2025) | 37.08 Billion units |
| Market Volume (2026) | 41.27 Billion units |
| Market Volume (2031) | 70.39 Billion units |
| Growth Rate (2026 - 2031) | 11.30 % |
| Market Concentration | Medium |
Major Players *Disclaimer: Major Players sorted in no particular order Image © Mordor Intelligence. Reuse requires attribution under CC BY 4.0. | |
India POS Terminals Market Analysis by Mordor Intelligence
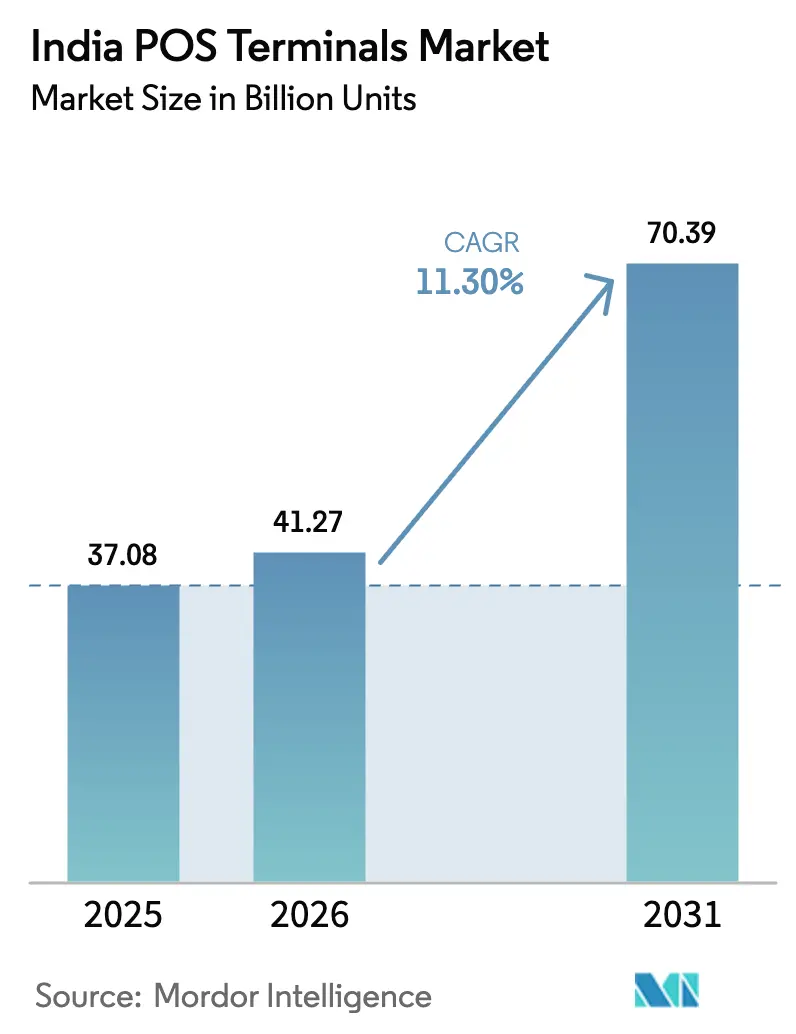
The India POS Terminals market size is expected to grow from 37.08 Billion units in 2025 to 41.27 Billion units in 2026 and is forecast to reach 70.39 Billion units by 2031 at 11.30% CAGR over 2026-2031. The growth pace reflected simultaneous tailwinds from government digitization mandates, a deepening credit infrastructure, and merchant demand for unified acceptance of cards, UPI, and emerging buy-now-pay-later options. Policy instruments such as Production Linked Incentive and Payments Infrastructure Development Fund subsidies cut onboarding costs for acquirers expanding into smaller cities, while GST e-invoice rules forced businesses above the INR 5 crore (USD 0.56 million) threshold to link real-time tax reporting with payment capture. At the same time the surging base of more than 100 million credit cards raised ticket sizes, improving the business case for card-capable terminals. Merchant economics nevertheless tightened once zero-MDR rules on UPI transactions came into force, pushing providers to roll out Android devices that process cards and UPI on the same hardware, and that allow instant app-based upgrades instead of forklift replacements. Competition therefore intensified between fintech specialists such as Pine Labs and Paytm and bank-led acquirers like HDFC, ICICI, and SBI that leverage existing branch footprints for distribution.
Key Report Takeaways
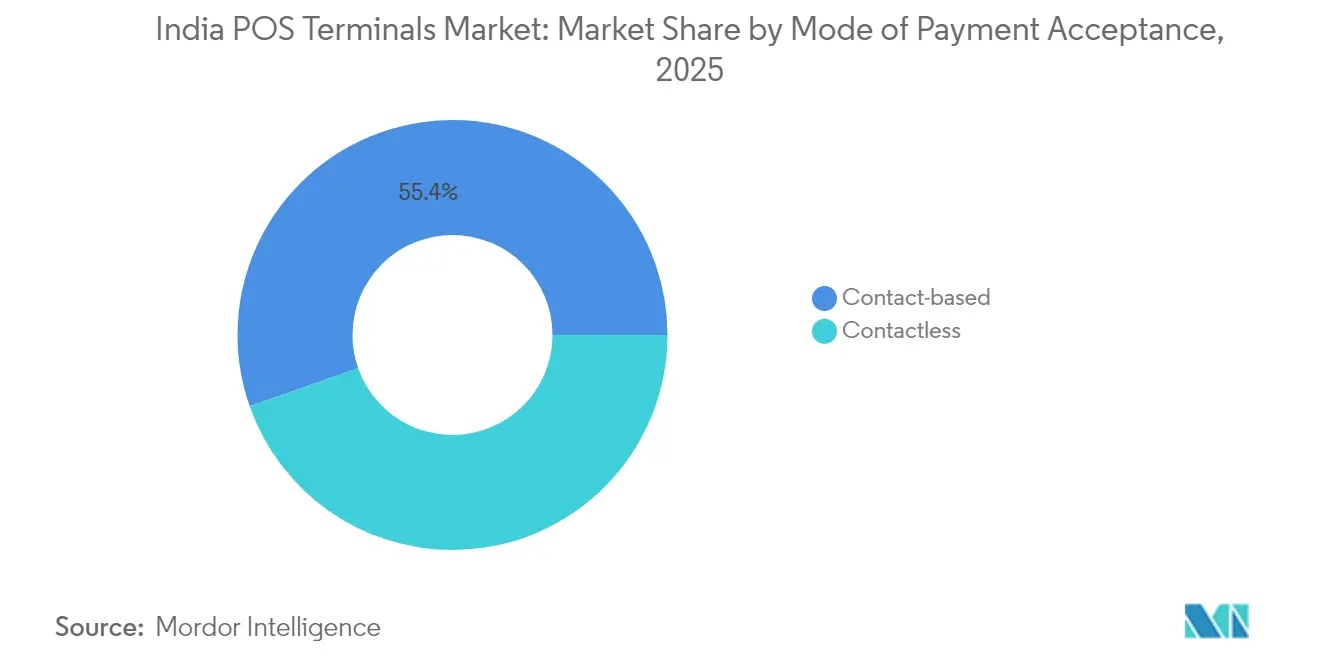
- By mode of payment acceptance, contact-based systems led with 55.38% of the India POS Terminals market share in 2025, while contactless solutions are forecast to post a 12.38% CAGR to 2031.
- By POS type, mobile and portable units accounted for 62.15% of the India POS Terminals market size in 2025 and are on track to expand at a 12.63% CAGR through 2031.
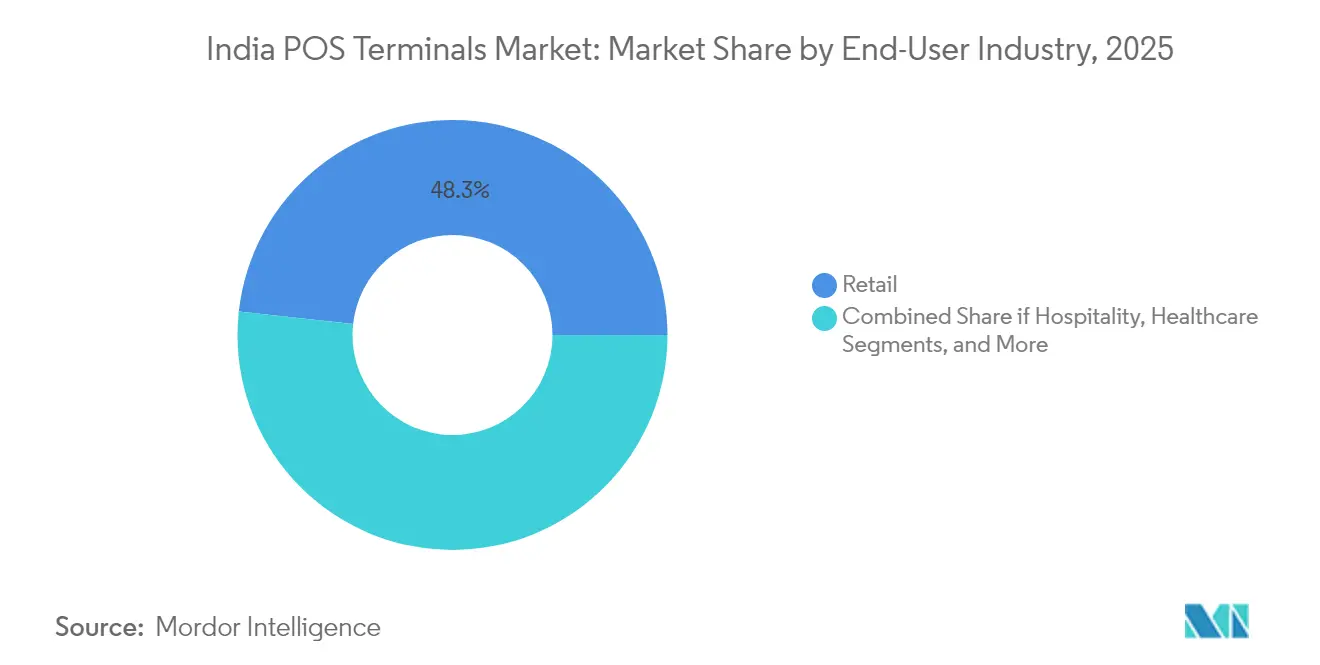
- By end-user industry, retail held 48.25% revenue share in 2025, whereas healthcare is advancing at a 13.02% CAGR through 2031.
Note: Market size and forecast figures in this report are generated using Mordor Intelligence’s proprietary estimation framework, updated with the latest available data and insights as of 2026.
India POS Terminals Market Trends and Insights
Drivers Impact Analysis*
| Driver | (~) % Impact on CAGR Forecast | Geographic Relevance | Impact Timeline |
|---|---|---|---|
| PIDF subsidies accelerating Tier-3-Tier-6 roll-outs | +1.8% | Tier-3 to Tier-6 cities, rural and semi-urban markets | Medium term (2-4 years) |
| Surging credit-card base (>100 mn) lifts card-swipe volumes | +1.2% | National, with concentration in metros and tier-1 cities | Short term (≤ 2 years) |
| Omni-payment Android POS (cards + UPI + BNPL in one device) | +1.6% | National, early adoption in urban retail and hospitality | Medium term (2-4 years) |
| GST e-invoice compliance driving real-time POS upgrades | +2.1% | National, businesses >Rs 5 crore turnover | Short term (≤ 2 years) |
| Smart-mall boom in Tier-2/3 cities raises fixed-POS demand | + 0.8% | Tier-2 and Tier-3 cities, retail expansion corridors | Long term (≥ 4 years) |
| Advanced analytics/AI add-ons boosting retailer ROI | +0.5% | Urban retail chains, organized retail sector | Long term (≥ 4 years) |
| Source: Mordor Intelligence | |||
PIDF subsidies accelerating Tier-3 – Tier-6 roll-outs
Government incentive pools such as the Payments Infrastructure Development Fund earmarked Rs 1,500 crore for terminals that process low-value UPI transactions. These incentives reduced acquirer risk and allowed providers to seed devices in towns where POS density had remained low. The subsidy design required adherence to RBI security standards, so deployments in smaller cities arrived with certified encryption and remote key injection, ensuring long-term operability.
Surging credit-card base lifts card-swipe volumes
India had issued 86 million credit cards by early 2025, and average monthly spend reached Rs 15,388, a 15% year-over-year climb.[1] Business Standard, “Credit Card Spending Crosses Rs 15,000 per Month,” business-standard.com Merchants noticed that card shoppers posted larger basket sizes than UPI users, so they upgraded to chip-and-PIN terminals that support contactless tap-to-pay. Banks and NBFCs widened card distribution, creating a virtuous loop for POS adoption even as UPI remained fee-free for small tickets.
Omni-payment Android POS adoption
Providers introduced Android-based smart terminals that accept EMV, NFC, UPI QR, and BNPL on a single screen. Pine Labs’ Hub device integrated more than 100 payment modes and offered inventory and analytics apps through over-the-air updates.[2]Pine Labs, “POS Hub: All-in-One Terminal,” pinelabs.com Merchants liked the reduced counter clutter and the ability to add new payment schemes without replacing hardware, which shortened upgrade cycles and raised lifetime value for acquirers.
GST e-invoice compliance driving real-time POS upgrades
Mandatory electronic invoicing for businesses crossing Rs 5 crore turnover forced about 2.1 million companies to generate invoices through a government portal at the moment of sale. Non-compliant legacy terminals could not push data in real time, so acquirers and software vendors bundled GST-ready POS packages with cloud connectivity, tax engine, and audit trail storage. This compliance push created a wave of refresh demand in both retail and B2B channels.
Restraints Impact Analysis*
| Restraint | (~) % Impact on CAGR Forecast | Geographic Relevance | Impact Timeline |
|---|---|---|---|
| Zero-MDR UPI erodes small-merchant economics | -1.5% | National, particularly affecting micro and small merchants | Short term (≤ 2 years) |
| QR-code ubiquity dampens new POS demand | -1.0% | National, urban and semi-urban markets | Medium term (2-4 years) |
| High total-cost-of-ownership for micro-merchants | -0.8% | Tier-3 to Tier-6 cities, micro retail segment | Long term (≥ 4 years) |
| Draft RBI PA-Offline rules raise compliance cost | -0.3% | National, affecting payment aggregators and POS providers | Medium term (2-4 years) |
| Source: Mordor Intelligence | |||
Zero-MDR UPI erodes small-merchant economics
The government removed merchant discount rates on UPI. Acquirers lost subsidy revenue that once offset device rentals, so many paused deployments to very small merchants. While policy makers later proposed a 0.2% fee for large chains, the near-term absence of interchange kept micro-merchant POS penetration low.
QR-code ubiquity dampens new POS demand
By February 2025 merchants had installed 352 million UPI QR codes compared with only 8.9 million POS terminals.[3]Economic Times, “QR Code Deployment Outpaces POS,” economictimes.indiatimes.com QR stickers cost little and carry no rental charges, so price-sensitive kirana stores favored them over dedicated hardware. Providers responded by embedding dynamic QR in Android POS screens, but the cost gap still slowed first-time terminal adoption.
*Our forecasts treat driver/restraint impacts as directional, not additive. The impact forecasts reflect baseline growth, mix effects, and variable interactions.
Segment Analysis
By Mode of Payment Acceptance: Contactless adoption rises on NFC enablement
Contact-based methods retained 55.38% of the India POS Terminals market share in 2025 on durable chip-and-PIN infrastructure. Yet contactless payments posted a 12.38% CAGR, fueled by NFC upgrades in bank-issued cards and consumer comfort with tap-to-pay hygiene. Contactless also gained visibility through public transit pilots where fare gates promoted faster flows. The segment’s expansion indicates that, although cards remain important, the underlying interface continues to shift toward touch-free experiences.
Merchants looked beyond retail. State transport firms layered contactless validators onto buses and metros, and municipal utilities accepted tap cards for bill payment. Device makers explored biometric authentication to secure higher value taps without PIN entry. These innovations are expected to keep contactless momentum intact even once pandemic safety fades from public memory.



By POS Type: Mobile models dominate on flexibility
Portable and mobile devices controlled 62.15% of the India POS Terminals market size in 2025 and grew the fastest at 12.63% CAGR. Small retailers valued the ability to accept payments at the aisle, on delivery runs, or during pop-up events. Battery-backed mini POS units connected over 4G and paired with smartphones for receipt printing, which cut upfront costs. Fixed countertop stations retained relevance in hypermarkets and multiplex cinemas where conveyor belts and integrated scales mattered.
The mobile wave overlapped with Android deployments. Providers embedded inventory, loyalty, and billing apps, transforming the terminal into a miniature point-of-sale and back-office console. That app layer unlocked subscription income and deepened the moat against low-margin QR competitors.
By End-User Industry: Healthcare races ahead
Retail still commanded 48.25% revenue share in 2025 due to large store counts and high ticket churn. Healthcare, however, displayed the top CAGR at 13.02% as hospitals digitalized billing and insurance claims. Clinics implemented terminals that merge patient scheduling, e-prescriptions, and payment in one workflow. Diagnostics chains also outfitted technicians with portable units for at-home sample collection, thus broadening use cases for the segment.
Hospitality remained another growth pocket. Hotels integrated POS with property management software to centralize room charges and food-and-beverage bills. Restaurants upgraded to terminals that interface with kitchen display systems so that chefs receive tickets the moment servers close the order, which improved table turns.
Geography Analysis
Western and southern metros formed the first wave of POS adoption due to higher consumption and early digital payment penetration. Mumbai, Bengaluru, and Hyderabad together housed a major share of banked consumers and enterprise retailers. Northern states nevertheless recorded the largest pipeline of new organized retail projects, with 44% of mall supply scheduled in Delhi NCR, Punjab, and Uttar Pradesh. Those developments created multi-lane checkout counters that specified EMV and NFC hardware at the fit-out stage.
Tier-2 and tier-3 cities such as Jaipur, Lucknow, Indore, and Patna accelerated, benefiting from retail franchises and food chains seeking growth outside saturated metros. From 2024 to 2025, floor space across these cities increased by 25 million square feet, and food and beverage outlets rose nearly 26%, each store now embedding at least one POS to manage table orders and digital wallets. Such expansion provided a launchpad for acquirers to seed full-service Android devices coupled with financing bundles.
Rural and semi-urban clusters remained the frontier. POS deployment relied on 4G connectivity rather than fiber, hence mobile terminals with integrated SIM cards found more traction than desktop devices. Banks leveraged Jan Dhan account holder data to target micro-entrepreneurs for merchant loans paired with POS bundles. Despite these incentives, adoption timelines stretched into the outer years of the forecast because many small retailers still saw QR as enough.
Regulatory Landscape
The Reserve Bank of India (RBI) sets core compliance guardrails for POS acquiring through the Payment and Settlement Systems (PSS) Act, 2007, and related directions covering authentication, security, and auditability for digital payment transactions. The RBI issued the Authentication Mechanisms for Digital Payment Transactions Directions, 2025, with compliance required by April 1, 2026, which increases the baseline for terminal-side authentication flows and back-end controls that acquirers and terminal fleets must support.
On market structure, the RBI Payment Aggregator (PA) licensing framework and its net-worth and governance requirements shape which firms can offer online and offline acceptance at scale. This favors capitalized incumbents and often pushes smaller players toward tie-ups where they cannot meet thresholds. On the scheme side, the National Payments Corporation of India (NPCI) governs UPI rails and terminal certification requirements, including work under development for enabling offline UPI capabilities at POS, which adds certification and implementation steps for manufacturers and solution providers.
Competitive Landscape
Competition in the India POS Terminals market involved fintechs, hardware vendors, and banks. No single firm held a commanding lead, keeping the field moderately fragmented and innovation driven. Pine Labs focused on mid-market retail with app-rich Android hardware, while Paytm leveraged its wallet user base to cross-sell terminals that present wallet cashbacks at checkout. Banks such as HDFC, ICICI, and SBI exploited branch reach to sign merchants in smaller towns, bundling current accounts, terminals, and working capital loans in one kit.
Product strategy converged on all-in-one acceptance. HDFC’s SmartHub Vyapar device packaged QR, card slot, NFC, and a talking soundbox speaker. Paytm and RBL Bank rolled out NFC soundboxes that announce successful card taps alongside QR transactions. Partnerships and acquisitions intensified. Zaggle bought 51% of Effiasoft to merge prepaid processing with POS software and address enterprise billing, signaling that software capability now matters as much as hardware reach. Worldline joined with Forthcode to create in-flight Android POS for airlines, highlighting niche vertical plays.
Regulation shaped the field. RBI Payment Aggregator rules increased net-worth thresholds and required security audits, which favored capitalized incumbents and nudged smaller aggregators into tie-ups. At the same time the proposed re-introduction of MDR on big-ticket UPI sales promised to rebalance profit pools and could reopen momentum for premium POS models in modern retail.
India POS Terminals Industry Leaders
Pine Labs Private Limited
One 97 Communications Limited (Paytm)
Worldline India Private Limited
Mswipe Technologies Private Limited
Innoviti Technologies Private Limited
- *Disclaimer: Major Players sorted in no particular order


Market Opportunities and Future Outlook
A clear gap remains in moving from QR-only acceptance to device-led experiences that combine merchant workflows, including billing, inventory, reconciliation, and compliance, with payments. Alongside this, NPCI's work to develop offline UPI payments at POS terminals using NFC widens the use case from always-on connectivity to intermittent-connectivity environments, which is especially relevant for mobility-heavy acceptance and geographies where network reliability limits real-time UPI usage.
Operational bottlenecks also create room for players that can secure supply, refurbish fleets, or shift demand toward software-defined upgrades on Android POS. This is relevant given the estimated deployment backlog of 200,000 POS units linked to supply chain constraints. With UPI forming a large share of POS transaction processing (around 70% per the evidence pack), providers can bundle value-added services on top of UPI-led acceptance, including fraud safeguards aligned with the RBI Payments Vision 2028 direction of travel on infrastructure consolidation and strengthened protections.
Recent Industry Developments
- June 2026: Pine Labs Private Limited launched Pine Labs Payment Protocol (P3P) enabling AI agents to complete UPI payments without human authentication. The launch expands automated payment execution across merchant networks and improves acceptance via AI enabled checkout. The initiative supports scaled merchant onboarding and faster transaction processing.
- May 2026: Pine Labs Private Limited reported first full year of profitability with annual profit of 1.13 billion rupees for the fiscal year ended March 31, 2026. The profitability signals resilience in its merchant acquisition model and aligns with its push into merchant financing and terminal deployment. The result strengthens Pine Labs competitive positioning in the India POS terminals market.
- May 2026: Pine Labs reported quarterly profit for 2026 Q4, underscoring robust merchant network expansion. The earnings indicate strong traction and merchant adoption. This supports continued scale-up of terminal rollout and allied services.


Research Methodology Framework and Report Scope
Market Definition and Coverage
For this study, the India POS terminals market refers to physical payment acceptance terminals installed at merchant locations that capture card or contactless transactions, including fixed countertop units and portable or mobile terminals, and counted as units deployed or sold in India.
Scope exclusions: We exclude pure software-only POS applications, QR code stickers without a terminal device, and payment gateway services that do not require a POS terminal.
Segmentation Overview
- By Mode of Payment Acceptance
- Contact-based
- Contactless
- By POS Type
- Fixed Point-of-Sale Systems
- Mobile / Portable Point-of-Sale Systems
- By End-User Industry
- Retail
- Hospitality
- Healthcare
- Transportation and Logistics
- Other End-user Industries
Data Sources, Market Sizing, and Validation
Desk Research
Desk research started with public payment and card-acceptance indicators, because POS demand in India is closely tied to transaction growth and merchant onboarding. We referenced sources such as Reserve Bank of India payment statistics, NPCI releases on digital transaction trends, Ministry of Electronics and Information Technology updates, and relevant government notifications on payment acceptance and security requirements.
We also used supporting context from industry association publications, customs trade statistics for electronic terminals where applicable, and peer-reviewed or standards documents related to EMV and contactless adoption. Company annual reports, investor presentations, and earnings commentary were used to translate adoption themes into realistic shipment and replacement expectations. These inputs were then cross-checked with paid subscriptions that provide company financials and intelligence, along with news and financials. The sources listed here are illustrative, and many other public and proprietary references were also used to collect, verify, and clarify inputs.
Primary Interviews and Surveys
Primary work was used to validate what desk sources cannot fully show, especially the split between fresh installations versus replacements, and the pace of contactless upgrades across merchant sizes. We spoke with stakeholders across the ecosystem, including payment acceptance providers, terminal distributors and service partners, and merchant-side users across key end markets, and then reconciled their inputs across major Indian metro and non-metro demand pockets.
Distribution of primary research fieldwork respondents
| Company type | Respondent position |
|---|---|
| Top tier: 37% | CXOs: 15% |
| Mid tier: 45% | Functional/Unit leaders: 36% |
| Smaller Players: 18% | Managers: 49% |
Market-Sizing & Forecasting
Sizing was built using a top-down and bottom-up blend, with the core logic anchored in India payment acceptance expansion. In practice, we reconstructed a demand pool from merchant digital-payment penetration signals, expected terminal density by merchant type, and replacement cycles, which were then translated into annual unit additions and installed-base churn.
To keep the model practical, we used a short list of repeatable inputs such as growth in card present and contactless transaction behavior, new merchant onboarding pace, the mix shift from fixed to portable terminals, average terminal replacement timing driven by compliance and wear, and the serviceability constraints that affect active deployments in smaller towns. Select bottom-up approximations were used as checks, including sampled distributor shipment ranges, channel feedback on stock turns, and supplier-side unit volume sanity checks. Where gaps remained, we applied conservative ranges to underreported micro-merchant demand.
For forecasting, scenario analysis was used, because policy signals, pricing and subsidy structures, and merchant acceptance economics can change adoption quickly. The forward path was finalized after primary feedback was used to pick realistic ranges for penetration improvement and replacement intensity, and then the scenario outputs were aligned to the stated CAGR trajectory.
Data Validation & Update Cycle
Validation is done in layers, so the final output is not dependent on any single dataset. Model totals are compared against independent signals such as changes in merchant acceptance infrastructure, category-level adoption trends, and observed shifts in contactless usage, and any sharp jumps are reworked until the driver logic matches field feedback.
Before sign-off, the work is reviewed by another analyst who checks arithmetic consistency, assumption continuity across years, and whether the narrative matches the modeled drivers. The report is refreshed annually, and interim updates are triggered when a material event changes terminal demand assumptions. After that trigger, key interviewees are re-contacted to confirm the direction and magnitude. Right before delivery, a final pass is done so clients receive the latest updated view.
Mordor Intelligence's India Pos Terminals Market Size Measured Against Other Published Estimates
Published market sizes for India POS terminals can differ more than buyers expect, mainly because some studies count value and others count units, and the boundary around what qualifies as a terminal is not always consistent. Timing also matters, since India payment acceptance can shift quickly with policy moves and merchant pricing changes.
Transaction growth signals, merchant acquisition momentum, and observed replacement and upgrade patterns are the checks that keep the Mordor Intelligence estimate anchored to a device-based terminal count in India, instead of mixing in software-only POS or QR-only acceptance. When these evidence points are not used, the totals can drift due to different upgrade-rate assumptions, different treatment of refurbished devices, and different year cutoffs for counting active terminals.
Benchmark comparison
| Source | Market Size | Gaps in Research Methodology |
|---|---|---|
| Mordor Intelligence | USD 37.08 B (2025) | |
| Industry Association A | USD 34.60 B (2025) | Uses a narrower definition of active terminals by excluding a portion of portable deployments in small merchants, and applies a longer replacement cycle that reduces annual unit additions. |
| Trade Journal B | USD 44.10 B (2026) | Counts a broader pool that likely includes QR-led acceptance kits and multi-device bundles, and assumes faster terminal rollout without consistently separating new installs from upgrades. |
Overall, the spread is explained by definitional boundaries and year alignment more than by math. By sticking to a device-only unit view, checking adoption against acceptance and replacement signals, and keeping assumptions visible, the estimate stays easier to reproduce and update when new evidence comes in.


Key Questions Answered in the Report
How big is the India POS Terminals Market?
The India POS Terminals Market size is expected to grow at a CAGR of 11.30% to reach 70.39 billion units by 2031.
What is the current India POS Terminals Market size?
In 2026, the India POS Terminals Market size is expected to reach 41.27 billion units.
Who are the key players in India POS Terminals Market?
VeriFone, Inc., Worldline, Ezetap (Razorpay), MobiSwipe Technologies Private Limited and Mswipe Technologies Pvt Ltd. are the major companies operating in the India POS Terminals Market.
What years does this India POS Terminals Market cover, and what was the market size in 2025?
In 2025, the India POS Terminals Market size was estimated at 41.27 billion units. The report covers the India POS Terminals Market historical market size for years: 2019, 2020, 2021, 2022, 2023 and 2024. The report also forecasts the India POS Terminals Market size for years: 2026, 2027, 2028, 2029, 2030 and 2031.
Page last updated on:


 Your data is secure and never sold or shared.


