
Market Overview
| Study Period | 2020 - 2031 |
|---|---|
| Forecast Data Period | 2026 - 2031 |
| Base Year Market Size (2025) | USD 9.94 Billion |
| Market Size (2026) | USD 10.33 Billion |
| Market Size (2031) | USD 12.52 Billion |
| Growth Rate (2026 - 2031) | 3.92 % |
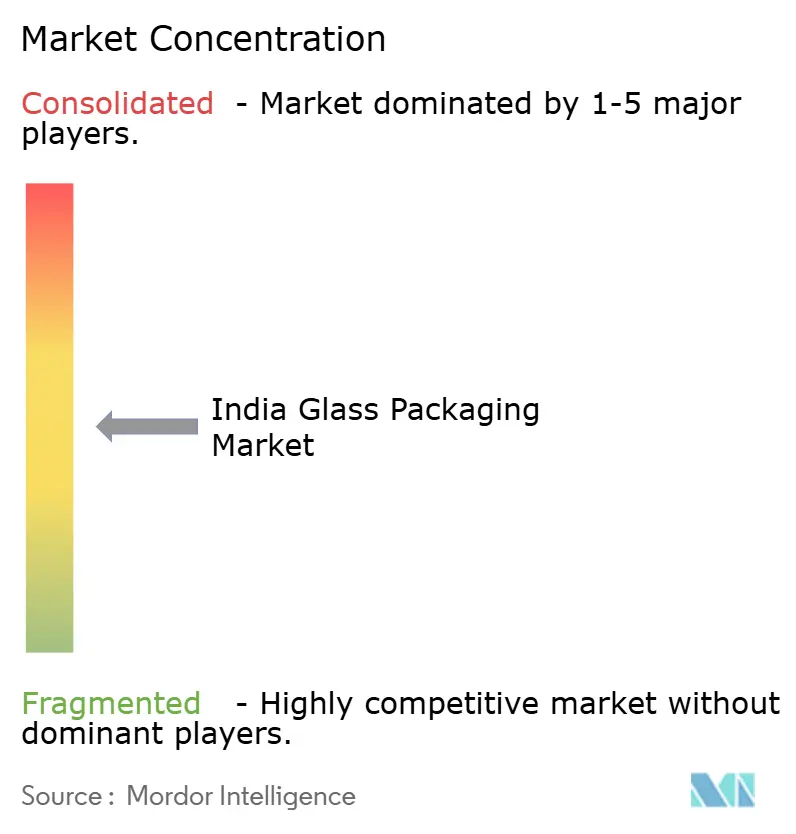
| Market Concentration | Medium |
Major Players
*Disclaimer: Major Players sorted in no particular order Image © Mordor Intelligence. Reuse requires attribution under CC BY 4.0. |
|
India Glass Packaging Market Analysis by Mordor Intelligence
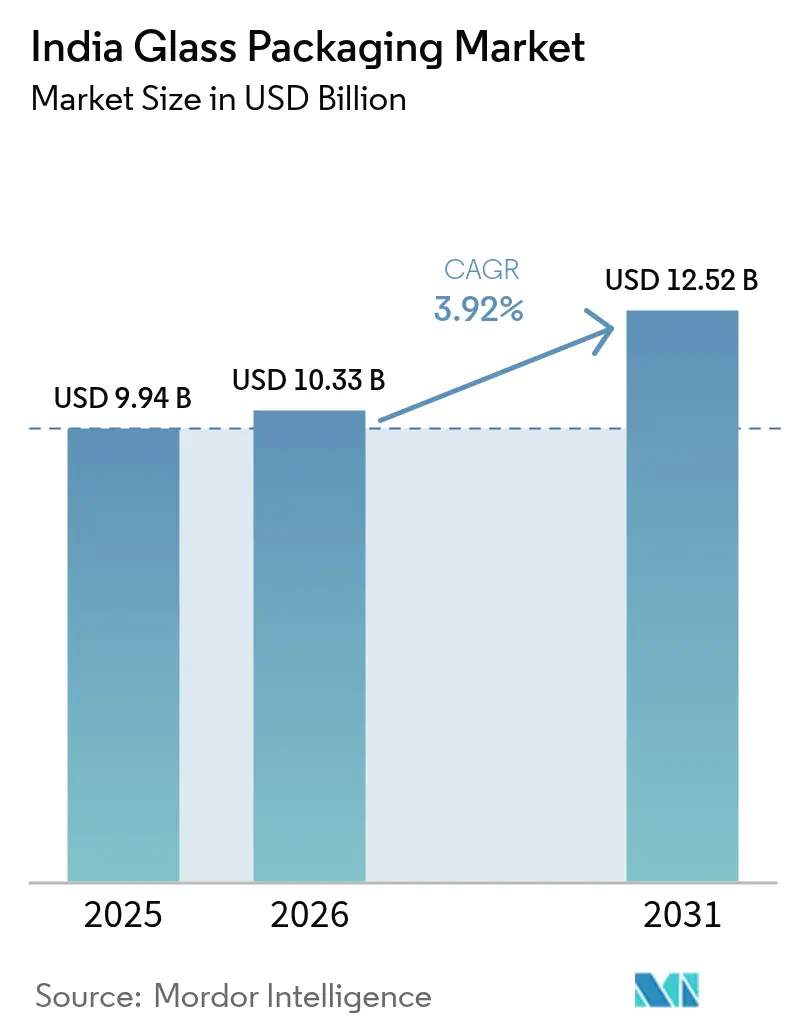
The India glass packaging market size was valued at USD 9.94 billion in 2025 and estimated to grow from USD 10.33 billion in 2026 to reach USD 12.52 billion by 2031, at a CAGR of 3.92% during the forecast period (2026-2031). Mature demand from mainstream beverages anchors current volumes, while momentum shifts toward pharmaceutical vials, premium craft spirits, and sustainability-driven substitution from plastic underpin fresh growth pockets. Central and state bans on single-use plastics, coupled with traceability mandates effective July 2025, accelerate the adoption of returnable or recycled glass formats. Production-Linked Incentive (PLI) investments worth INR 1.61 lakh crore across 14 sectors upgrade domestic furnace, cullet, and logistics networks, trimming input costs and raising output reliability. [1]Press Information Bureau, “Compulsory ban on polythene bags,” pib.gov.in Pharmaceutical export ambitions, crystallized by the US Biosecure Act and 27 new greenfield bulk-drug projects, pivot demand toward Type I borosilicate vials that command higher margins. Meanwhile, craft distilleries and microbreweries increasingly specify bespoke flint bottles that elevate visual branding and justify premium shelf prices.
Key Report Takeaways
- By product, Bottles/Containers led with 67.25% of the India glass packaging market share in 2025, while Vials recorded the fastest 4.18% CAGR between 2026-2031.
- By glass type, Type III soda-lime accounted for 57.80% market share, whereas Type I borosilicate is forecast to grow at a 4.12% CAGR between 2026-2031.
- By end-user vertical, Alcoholic Beverages held 51.10% market share in 2025; Pharmaceutical applications are advancing at a 4.22% CAGR between 2026-2031.
- By capacity range, 100-500 ml formats captured 36.95% market share, yet <30 ml containers are set to expand at a 3.98% CAGR between 2026-2031.
- By geography, North India contributed a 30.65% market share in 2025, while South India is projected to post the quickest 3.02% CAGR between 2026-2031.
Note: Market size and forecast figures in this report are generated using Mordor Intelligence’s proprietary estimation framework, updated with the latest available data and insights as of 2026.
India Glass Packaging Market Trends and Insights
Drivers Impact Analysis*
| Driver | (~) % Impact on CAGR Forecast | Geographic Relevance | Impact Timeline |
|---|---|---|---|
| Craft spirits and RTDs lift premium flint-bottle demand | +0.8% | Mumbai, Bangalore, Delhi; national spread | Medium term (2-4 years) |
| Vaccine exports and biologics capacity drive Type I vial uptake | +0.9% | South India core; West India spill-over | Long term (≥ 4 years) |
| D2C beauty brands shift to glass jars for sustainability | +0.5% | Metro and Tier-1 cities | Short term (≤ 2 years) |
| Micro-breweries and craft distilleries want bespoke formats | +0.6% | Maharashtra, Karnataka, Goa, Haryana | Medium term (2-4 years) |
| State single-use-plastic bans boost returnable glass | +0.7% | Progressive states nationwide | Short term (≤ 2 years) |
| PLI-backed cullet plants cut costs, spur recycled glass demand | +0.4% | Maharashtra, Telangana, Gujarat | Long term (≥ 4 years) |
| Source: Mordor Intelligence | |||
Craft Spirits Revolution Drives Premium Glass Demand
Consumer migration from standard beer to craft spirits and ready-to-drink cocktails widens opportunities for bespoke bottles in the India glass packaging market. Exports of alcoholic beverages rose to USD 375.09 million in FY 2024, signaling premiumization that spills into domestic shelves.[2]Agricultural and Processed Food Products Export Development Authority, “Alcoholic and Non-Alcoholic Beverages,” apeda.gov.in Micro-breweries in Maharashtra and Karnataka commission proprietary molds in flint and amber variants that bolster brand storytelling. Streamlined state licensing and tourism-centric policies sustain this trajectory, although compliance with Bureau of Indian Standards food-grade norms remains compulsory. Glass makers able to deliver small-batch run flexibility and intricate embossing gain a pricing edge over mass-production peers. The result is a diversified revenue stream less exposed to volume swings in mainstream beer.
Pharmaceutical Export Ambitions Fuel Type I Vial Growth
The India glass packaging market benefits directly from the US Biosecure Act, which channels contract manufacturing away from Chinese suppliers toward Indian CDMOs. SGD Pharma’s joint venture with Corning in Telangana establishes Velocity Vials capacity aligned with global biologic fill-finish standards. Borosilicate compositions withstand thermal shock and chemical reactivity posed by complex drugs, justifying premium selling prices. India’s CDMO revenue is projected to climb from USD 15.63 billion in 2023 to USD 26.73 billion by 2028, ensuring sturdy downstream demand. Government PLI incentives covering 27 bulk-drug parks lower capex hurdles, while dedicated pharma freight corridors shorten export lead times. Collectively, these factors lock in a robust demand pipeline for high-purity vials.
Sustainability Mandates Accelerate Glass Substitution
Plastic Waste Management Amendment Rules, effective July 2025, demand QR-code traceability that inflates compliance costs for multilayer plastic, thereby nudging brands toward infinitely recyclable glass. D2C beauty labels in metro cities embrace glass jars to signal eco-consciousness, with PGP Glass already incorporating 33% cullet and targeting 80% renewable energy by 2030. State-level bans on single-use plastics add further impetus. Although reverse-logistics gaps persist outside metros, policy-backed recycling networks and consumer take-back programs steadily expand. Brands gain reputational capital and shelf differentiation, reinforcing the virtuous cycle for the India glass packaging market.
PLI-Backed Cullet Processing Reduces Cost Base
PLI allocations worth INR 1.61 lakh crore unlock funding for new cullet-processing units in Maharashtra and Telangana, trimming raw-material costs and cutting furnace energy consumption. Container glass recycling rates hover near 32% globally, leaving ample upside for India to narrow the gap. Advanced optical sorters and color-separation systems enhance cullet purity, allowing higher feed ratios without compromising clarity. Over the long term, greater cullet use positions domestic producers to meet multinational buyers’ recycled-content targets, reinforcing export competitiveness.
Restraints Impact Analysis*
| Restraint | (~) % Impact on CAGR Forecast | Geographic Relevance | Impact Timeline |
|---|---|---|---|
| PET bottles outcompete glass in edible oil and soft drinks | -0.9% | National price-sensitive segments | Short term (≤ 2 years) |
| Volatile LNG and power prices compress container margins | -0.6% | Major manufacturing hubs | Medium term (2-4 years) |
| Weak reverse-logistics for returnable glass | -0.4% | Rural and semi-urban markets | Long term (≥ 4 years) |
| Lenders cautious on long-payback furnace rebuilds | -0.3% | Nationwide expansion plans | Medium term (2-4 years) |
| Source: Mordor Intelligence | |||
PET Competition Intensifies in Price-Sensitive Segments
Government mandates for 30% recycled PET content in beverage bottles by April 2025, climbing to 60% by FY 2029, spur rapid scale-up of rPET capacity that sustains PET’s cost advantage. Ganesha Ecopet alone plans to recycle 42,000 tonnes annually by 2026, capturing roughly one-quarter of national bottle waste. Beverage giants deploy lightweight PET and crystallizable hot-fill grades to replace glass in edible oils and carbonated drinks, where freight and breakage costs weigh heavily. Unless glass makers unlock cost-effective returnable models, PET will continue capturing incremental share in mass-market beverages.
Energy Cost Volatility Pressures Manufacturing Economics
Continuous-furnace glass production relies on natural gas and electricity, exposing margins to fuel swings. Industrial gas demand is set to triple by 2050, ensuring structurally elevated prices.[3]U.S. Energy Information Administration, “Industry to drive tripling of natural gas consumption in India by 2050,” eia.gov While India targets 500 GW of renewables by 2030, intermittent supply and grid charges inject uncertainty over the transition window. Furnace rebuilds costing USD 40-60 million require 15-20 year paybacks, making lenders cautious. Smaller players may delay upgrades, risking capacity constraints or quality lapses that could erode the competitiveness of the India glass packaging market.
*Our forecasts treat driver/restraint impacts as directional, not additive. The impact forecasts reflect baseline growth, mix effects, and variable interactions.
Segment Analysis
By Product: Vials Outpace Legacy Containers
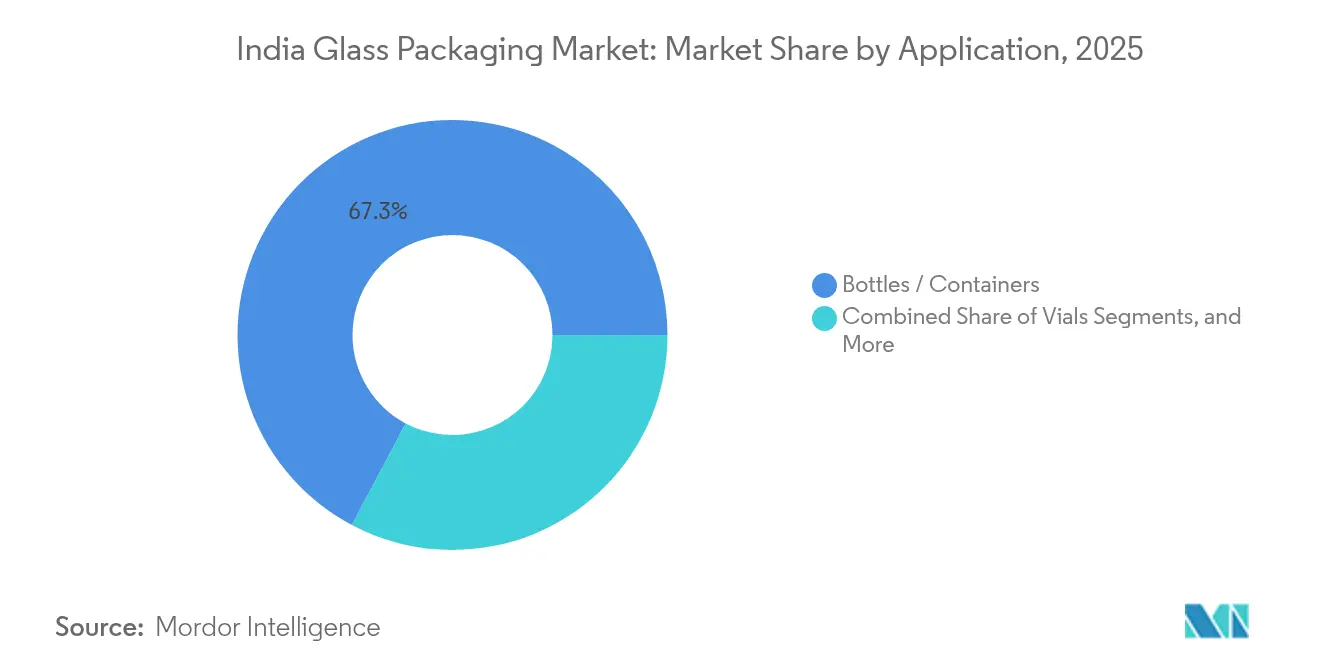
Bottles and jars retained the largest 2025 share at 67.25% of the India glass packaging market size, anchored by mainstream food and beverage usage. However, vials are advancing at a 4.18% CAGR as pharmaceutical exports pivot toward biologics that require Type I borosilicate formats. The India glass packaging market share held by vials could therefore climb meaningfully by 2031 as CDMOs scale capacity. Ampoules and syringes deliver steady baseline demand, yet premium vial specifications capture value-added margins for specialized converters.
The shift compels container glass majors to diversify into smaller formats or risk over-concentration in legacy beverage lines. Early movers are installing modular forming machines capable of rapid changeovers from 500 ml bottles to 10 ml vials, reducing downtime and broadening customer reach. Pharmaceutical compliance audits drive investments in on-line camera inspection and ISO 15378 cleanroom environments, lifting barriers to entry for new firms but consolidating revenues for integrated players.



By Glass Type: Borosilicate Extends Premium Edge
Type III soda-lime constituted 57.80% of 2025 revenue thanks to its cost-effectiveness in edible oils and sauces. Yet Type I borosilicate is on a 4.12% CAGR trajectory, propelled by stringent pharmacopeia norms and export-oriented biologics demand. The India glass packaging market size for borosilicate vials is forecast to expand steadily as Telangana and Gujarat commission new melting tanks with low-alkali formulations.
Soda-lime volumes remain essential for scale economics, but margin uplift increasingly hinges on borosilicate. Producers integrating oxy-fuel burners and batch pre-heaters curb energy intensity, narrowing cost gaps. Treated soda-lime (Type II) and UV-shielding amber variants continue to serve vaccines and craft beverages, respectively, underpinning a diversified product stack that insulates revenue streams.
By End-User Vertical: Pharma Inches Closer to Beverage Dominance
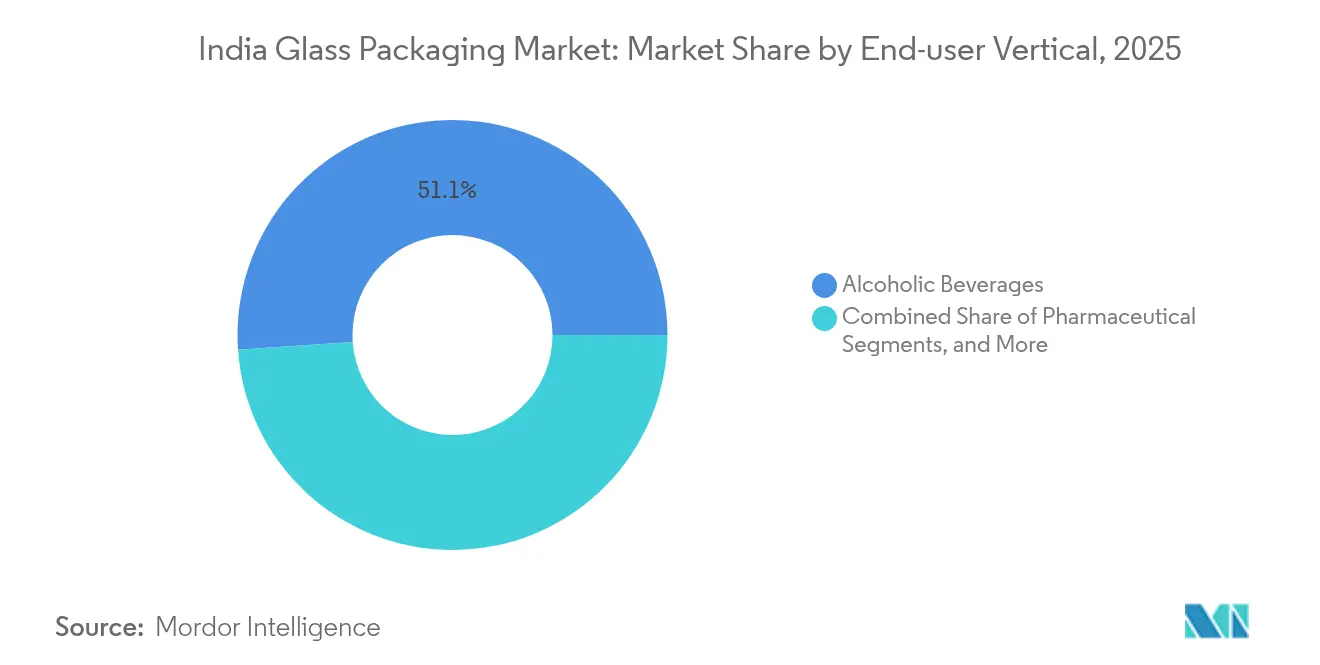
Alcoholic beverages represented 51.10% of 2025 demand, anchored in spirits, beer, and wine. Yet pharmaceutical demand is forecast to post a faster 4.22% CAGR, reflecting CDMO expansion and regulatory diversification away from China. Food and soft-drink uses face PET encroachment, prompting glass producers to reposition toward premium sauces, condiments, and craft sodas where glass conveys purity cues.
Personal care and cosmetics emerge as niche engines as D2C brands tout glass’ sustainability credentials. Diageo India’s pledge to cut packaging weight by 10% by 2030 will gradually temper spirits volume growth, but create parallel opportunities in lightweighting technology.
By Capacity Range: Small Formats Command Premiums
Containers sized 100-500 ml captured 36.95% of 2025 shipments, yet <30 ml units are on course for 3.98% CAGR as pharma and high-proof miniatures proliferate. Integrating narrow-neck press-and-blow lines enables efficient runs of sub-30 ml vials while maintaining wall-thickness precision. The India glass packaging market size for mini formats is poised for durable gains as health-care sampling, travel retail and craft spirits adopt smaller SKUs for operational flexibility.
Larger 500-1,000 ml formats lose ground to PET in mass beverages, driving glass players to pursue lightweight redesign and higher recycled-content ratios. Those unable to optimize logistics may cede share, underscoring the importance of SKU rationalization strategies across capacity brackets.
Geography Analysis
Northern states commanded a 30.65% share in 2025, underpinned by dense consumption across Delhi NCR and Punjab’s agri-processing clusters. Proximity to Rajasthan silica mines keeps raw-glass costs competitive, while six-lane highway grids ensure quick dispatch to bottlers. Regional container plants leverage integrated cullet yards and multi-feeder furnaces that align with high-volume beverage contracts.
Western India combines Maharashtra’s wine corridor with 46 registered wineries and Gujarat’s chemical belt supporting pharma and food ingredients. Although precise India glass packaging market share numbers remain undisclosed at the firm level, steady spirits and wine bottling sustain baseline throughput. Contract glass decorators around Nashik add value via hot stamping and screen printing, feeding premiumization in alcoholic beverages.
South India posts the steepest 3.02% CAGR thanks to Hyderabad’s pharma corridor and Bangalore’s craft-beer boom. SGD Pharma-Corning’s Velocity Vials plant in Telangana exemplifies investments primed for export accreditation. Government fast-tracks environmental clearances and offers power subsidies to lure glass furnaces into industrial estates. Eastern states lag due to limited pharma output and weaker reverse-logistics infrastructure, but F&B players in Kolkata sustain modest soda-lime demand.
Regulatory Landscape
Food-contact glass packaging in India is governed by Food Safety and Standards Authority of India (FSSAI) requirements, which set out expectations for hygienic, clean, and defect-free containers suitable for the intended use, including durability and cleanability for reusable bottles. FSSAI updates to the packaging compendium in April 2025 reinforced compliance expectations for food-contact packaging materials used across beverages, sauces, and other FMCG categories.
Standardization and conformity for specific glass-packaging formats are anchored by the Bureau of Indian Standards (BIS), including product specifications such as IS 1662 for glass liquor bottles, IS 1984 (Part 2) for glass injection vials, and IS 3423 for transfusion fluid containers. In parallel, the Plastic Waste Management (Amendment) Rules, 2024 (effective 14 March 2024) expanded Extended Producer Responsibility (EPR) coverage for mixed-material packaging, which affects glass packagers and brand owners where closures, labels, or secondary components create multi-material compliance and reporting obligations.
Value Chain Analysis
The India glass packaging value chain begins with raw-material sourcing (silica and soda ash) and cullet procurement, followed by batch preparation, furnace-based melting, forming (including narrow-neck and wide-mouth lines), annealing, and quality inspection. Downstream value addition includes decoration (ceramic labeling, hot foiling, lacquering, and printing) and secondary packaging, after which products move through distributors and direct supply contracts to end users in alcoholic beverages, food, cosmetics, and pharmaceuticals, where higher-purity vial production brings additional process controls and audit readiness.
On the supply side, major domestic and in-country operators such as AGI Greenpac, Hindustan National Glass and Industries Limited (HNGIL), PGP Glass, Haldyn Glass, Borosil, and Sunrise Glass Industries contribute capacity across mainstream containers and specialty formats. Energy and logistics remain critical linkages across the chain, and sustainability-driven inputs are increasingly visible in operations. For instance, Sunrise Glass Industries highlights rooftop solar generation and longer-term renewable capacity additions to support manufacturing continuity and emissions reduction objectives.
Competitive Landscape
The India glass packaging market gravitates toward an oligopoly in mainstream containers but fragments in specialty segments. Hindustan National Glass’s insolvency proceeding, now leaning toward an INSCO-led revival, may release stranded capacity or trigger asset sales that redistribute volume shares. PGP Glass differentiates through 33% cullet usage and an EcoVadis Platinum score, positioning itself as a sustainability reference customer for global beauty and spirits brands.
Gerresheimer leverages proprietary RTF (Ready-to-Fill) vial technology, reporting 2.6% organic growth in Q3 2024 despite destocking. Borosil Glass Works commits INR 250 crore toward Gujarat and Jaipur upgrades to double revenue in four years. Smaller craft-focused converters explore partnerships with tubes and closure suppliers, offering turnkey solutions that speed time-to-market for new beverage SKUs. Reverse-logistics start-ups test refill-and-return models in Bengaluru and Delhi, hinting at emerging service niches.
India Glass Packaging Industry Leaders
-
AGI Greenpac Limited
-
Gerresheimer AG
-
Hindustan National Glass and Industries Limited
-
Piramal Glass Private Limited
-
Haldyn Glass Limited
- *Disclaimer: Major Players sorted in no particular order

Market Opportunities and Future Outlook
Pharmaceutical-grade and specialty glass remains a key whitespace area, supported by the market shift toward Type I borosilicate vials and tighter quality expectations linked to export-oriented drug manufacturing. Capacity and capability moves cited in the ecosystem, including Borosil board-approved capex in March 2026 for a new glassware facility in Bharuch, Gujarat and an expansion of borosilicate furnace capacity at its Jaipur plant, reflect investment into higher-value glass segments that are adjacent to, and can reinforce, pharma and specialty packaging demand.
A second opportunity is cost and sustainability differentiation through energy efficiency, higher cullet usage, and improved recycling logistics that lower melt energy intensity while meeting brand sustainability targets. HNGIL's furnace re-commissioning and additional furnace commissioning reported in February 2026, along with ongoing renewable-energy positioning by domestic manufacturers, indicate that operational reliability and decarbonization-linked upgrades are becoming part of competitive positioning. Portfolio diversification by packaging groups that already operate in glass, for example AGI Greenpac moving into aluminum beverage cans, also creates scope for cross-substrate solutions to beverage customers and can shift negotiating dynamics for brand owners using mixed packaging formats.
Recent Industry Developments
- May 2026: AGI Greenpac commenced construction of an aluminum beverage can manufacturing facility in Hathras, Uttar Pradesh, following a May 5, 2026 groundbreaking. The project has been positioned at around INR 1,000 crore with an initial rated capacity of 1.6 billion cans per year, expanding the company's ability to supply beverage packaging beyond glass and PET and increasing competitive intensity for rigid packaging spends.
- September 2025: Hindusthan National Glass and Industries Limited (HNGIL) equity shares were delisted effective September 22, 2025 after completion of an NCLT-approved resolution plan under which Independent Sugar Corporation Limited (INSCO) acquired the company. The ownership change supports restoration and redeployment of capacity, influencing supply reliability and pricing dynamics for mainstream container glass customers.
- December 2024: Borosil Group outlined a capex plan of about USD 30 million to increase capacity across Gujarat and Rajasthan. The investment focus signaled continued build-out around higher-value glass categories, strengthening domestic supply capability for premium and specialty applications that use glass packaging.


Research Methodology Framework and Report Scope
Market Definition and Coverage
For this study, the India glass packaging market is counted as the value of glass packs sold for packaging uses in India, across key end users such as beverages, food, pharma, and personal care.
Scope exclusions: We exclude glass products meant mainly for building, automotive glazing, tableware, and lab equipment that are not used as packaging.
Segmentation Overview
-
By Product
- Bottles / Containers
- Vials
- Ampoules
- Syringes / Cartridges
-
By Glass Type
- Type I (Borosilicate)
- Type II (Treated Soda-lime)
- Type III (Soda-lime)
-
By End-user Vertical
- Food
- Soft-drink Beverages
- Alcoholic Beverages
- Cosmetics and Personal Care
- Pharmaceutical
-
By Capacity Range
- <30 ml
- 30 - 100 ml
- 100 - 500 ml
- 500 - 1 000 ml
-
By Region
- North India
- West India
- South India
- East India
Data Sources, Market Sizing, and Validation
Desk Research
Desk research was used to set the industry context and to build the first set of inputs needed for a clean model. We referred to public sources such as Ministry of Commerce and Industry trade statistics, Central Pollution Control Board updates and state pollution control board releases, Bureau of Indian Standards references where relevant, and data releases from the Ministry of Statistics and Programme Implementation.
To connect demand to packaging consumption, we also reviewed non-paywalled sources such as trade association publications, peer-reviewed articles on glass recycling and furnace efficiency, annual reports and investor presentations, and reputed business press. In parallel, we used paid subscriptions for company financials and intelligence, patent searching, and shipment-level import and export signals to cross-check the direction of key assumptions. These desk sources are not exhaustive, and many other documents were also consulted to validate data points and clarify open questions.
Primary Interviews and Surveys
Primary work focused on interviews and structured surveys with glass packaging manufacturers, converters, distributors, and large end users in beverages and pharmaceuticals. This input helped us pin down utilization patterns, pack mix shifts, and the way pricing is negotiated by pack format, rather than relying only on desk assumptions. Coverage was balanced across India, so regional supply clusters and demand centers could be compared before finalizing assumptions.
Distribution of primary research fieldwork respondents
| Company type | Respondent position |
|---|---|
| Top tier: 30% | CXOs: 17% |
| Mid tier: 51% | Functional/Unit leaders: 24% |
| Smaller Players: 19% | Managers: 59% |
Market-Sizing & Forecasting
Sizing started with a top-down build where production, trade flows, and end-use demand signals were used to reconstruct the addressable glass packaging consumption pool in India, followed by checks across major consuming industries. Once that envelope was formed, we corroborated it using selective bottom-up approximations, including sampling average selling prices by pack type and multiplying by estimated shipment volumes, and then comparing the total against supplier revenue footprints.
A few inputs that mattered in this market included pack mix by product family (bottles and containers, vials and ampoules, and other pharma formats), shifts in capacity ranges (for example, small-dose pharma versus larger beverage packs), trends in recycled cullet use and its impact on cost, end-use growth indicators for alcohol, soft drinks, and pharmaceuticals, and observable price movement by key pack formats. For forecasting, we ran scenario analysis around end-use growth rates and pricing progression, and then aligned the final trajectory with what industry respondents considered realistic under base-case conditions. Where bottom-up signals were patchy for smaller local suppliers, gaps were handled using peer benchmarking on output mix and utilization, and then calibrated back to the top-down envelope.
Data Validation & Update Cycle
Outputs were tested through triangulation across independent signals, and large variances were flagged for review before numbers were finalized. We ran consistency checks by pack type and end-use, and then re-checked whether implied prices and implied volumes stayed realistic for India.
Before sign-off, the model and narrative go through multi-step internal reviews, and interview follow-ups are triggered when a key assumption moves materially. Reports are refreshed annually, and interim updates are made when major events change costs, capacity, or demand. Right before delivery, a fresh validation pass is completed so clients receive the latest updated view.
Mordor Intelligence's India Glass Packaging Market Size Versus Other Published Estimates
Published market numbers for India glass packaging can look far apart because each source draws the line around different products, end users, and years, and then applies its own pricing and growth assumptions. Differences also show up when some studies report only one end-use slice, while others count a wider packaging basket.
Non-packaging glass such as flat glass and tableware sits outside Mordor Intelligence's scope, and that alone can shift totals when another publisher mixes packaging with broader glass products. Gaps also come from whether the model is anchored on observable production and trade signals versus revenue-only extrapolations, how average selling prices are progressed across pack formats like beverage bottles versus pharma vials, and how often currency conversion and base-year prices are refreshed.
Benchmark comparison
| Source | Market Size | Gaps in Research Methodology |
|---|---|---|
| Mordor Intelligence | USD 9.94 B (2025) | |
| Industry Research Publisher A | USD 4.06 B (2025) | Uses a narrower revenue pool that appears to undercount pharma-oriented packs and smaller capacity formats, which pulls down the total even when the same year is referenced. |
| Industry Research Publisher B | USD 2.10 B (2023) | Relies on an older base year and a tighter set of type and application groupings, so the starting value is not comparable to a broader packaging-only coverage with refreshed pricing. |
Looking at the table, the spread is largely explained by scope coverage and base-year alignment, and then by how pricing and mix are handled across beverage and pharma packaging. By keeping the calculation tied to repeatable demand and supply signals and cross-checking it with grounded pricing and volume sanity checks, the resulting number stays easier to audit and reuse for planning.


Key Questions Answered in the Report
What is the 2026 value of the India glass packaging market?
The India glass packaging market size reached USD 10.33 billion in 2026.
How fast will pharmaceutical vials grow within Indian demand?
Vials are projected to register a 4.18% CAGR through 2031, the quickest among product categories.
Which region offers the fastest growth opportunity?
South India leads with a forecast 3.02% CAGR, powered by pharma clusters in Telangana and Karnataka.
How are plastic bans influencing glass demand?
Single-use plastic bans and QR-code traceability rules are steering FMCG and beauty brands toward recyclable glass containers.
Why are energy costs a concern for Indian glass makers?
Continuous furnaces rely on natural gas; projected tripling of industrial gas demand by 2050 raises long-term fuel cost risks.
Who are key players shaping market sustainability trends?
PGP Glass, Gerresheimer and Borosil are advancing cullet usage, renewable energy and lightweight designs to align with ESG goals.
Page last updated on:





